GMS location: 516
Random forest results
| names |
period |
power |
significance |
meanSquareError |
absError |
maxError |
CRPS |
IGN |
| baseline |
winter 2016 |
0.989 |
0.100 |
0.321 |
0.436 |
1.916 |
NaN |
NaN |
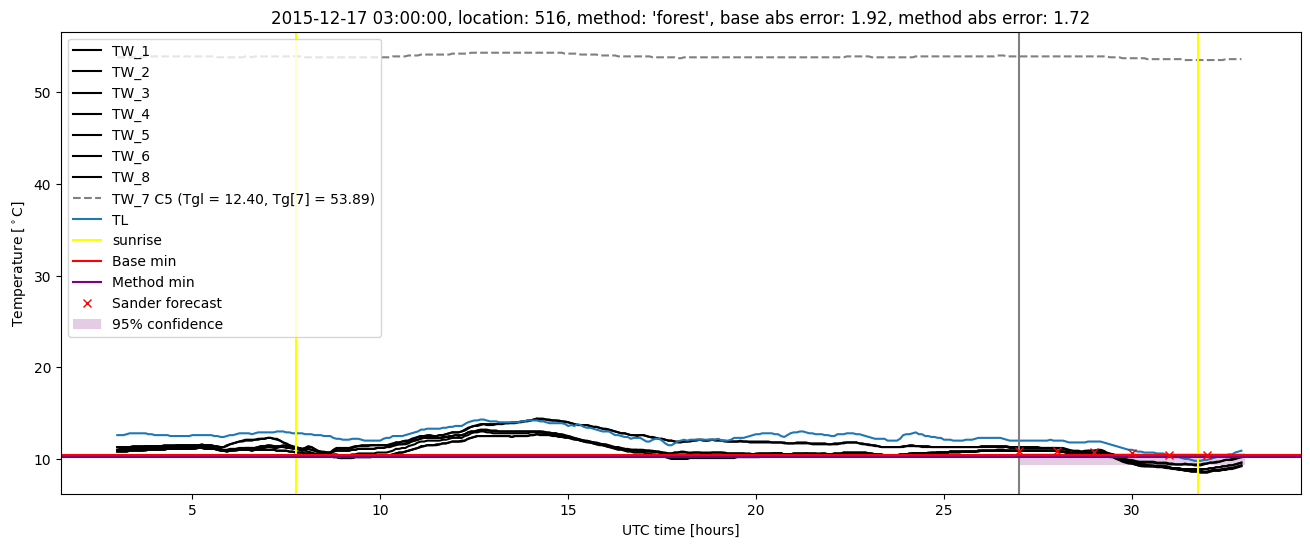
| forest |
winter 2016 |
0.989 |
0.100 |
0.254 |
0.386 |
1.722 |
0.520 |
4.592 |
| baseline |
winter 2017 |
0.933 |
0.189 |
0.436 |
0.476 |
2.199 |
NaN |
NaN |
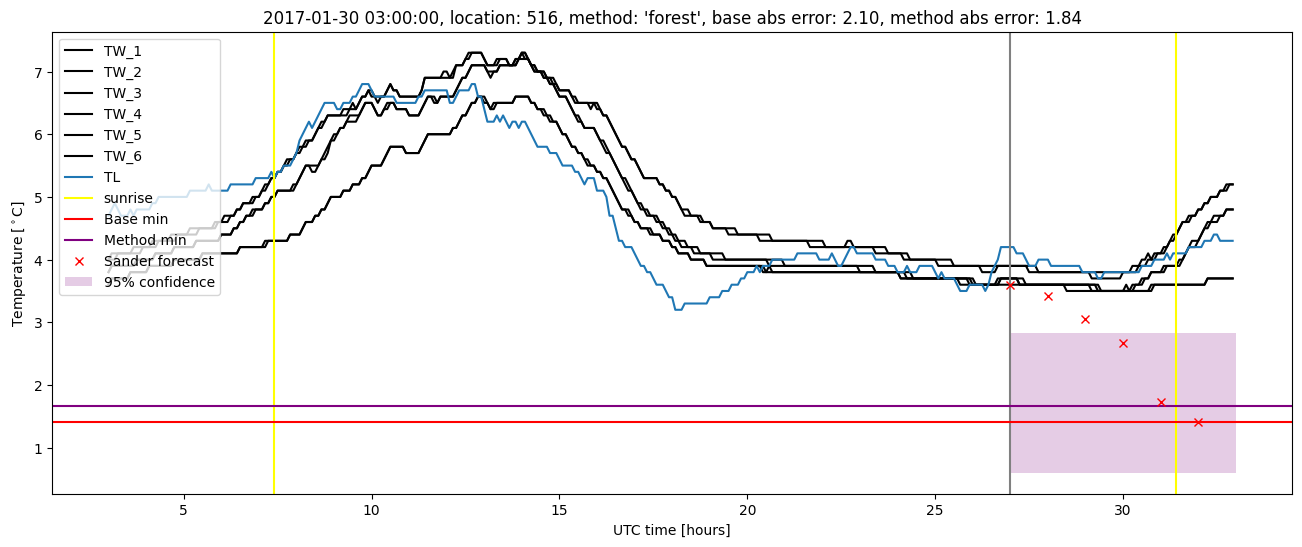
| forest |
winter 2017 |
0.933 |
0.162 |
0.335 |
0.416 |
1.963 |
0.515 |
5.062 |
| baseline |
winter 2018 |
0.986 |
0.057 |
0.344 |
0.421 |
1.830 |
NaN |
NaN |
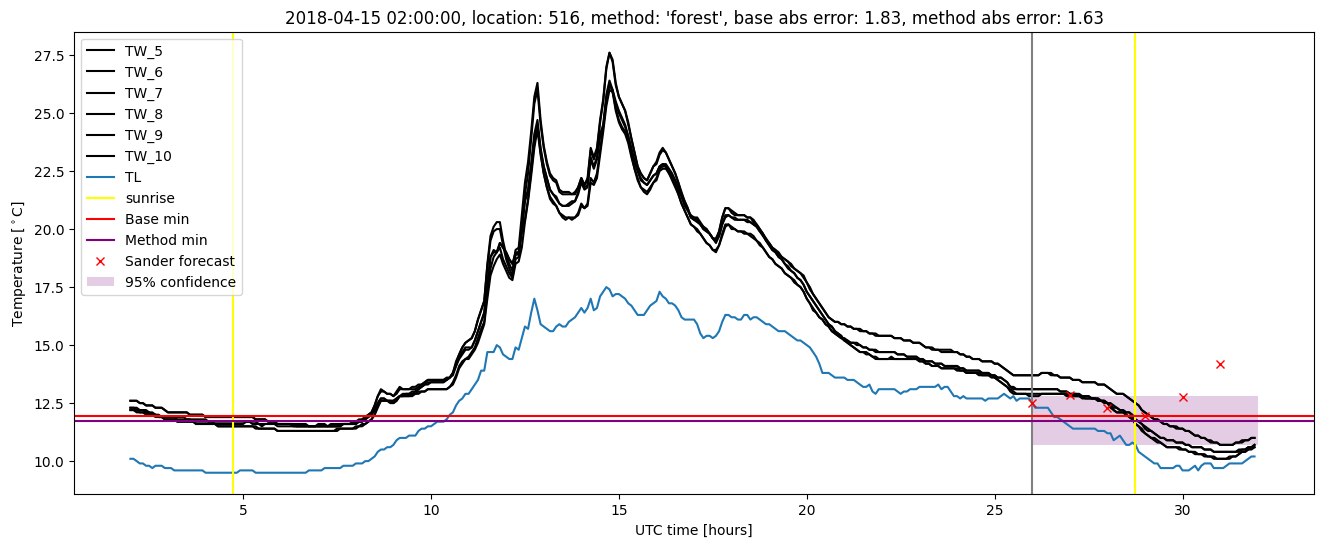
| forest |
winter 2018 |
0.986 |
0.057 |
0.287 |
0.398 |
1.633 |
0.514 |
3.206 |
| baseline |
winter 2019 |
1.000 |
0.000e+00 |
0.309 |
0.429 |
2.299 |
NaN |
NaN |
| forest |
winter 2019 |
0.993 |
0.000e+00 |
0.240 |
0.377 |
1.959 |
0.526 |
3.928 |
| baseline |
all |
0.982 |
0.104 |
0.346 |
0.438 |
2.299 |
NaN |
NaN |
| forest |
all |
0.980 |
0.094 |
0.275 |
0.393 |
1.963 |
0.519 |
4.150 |
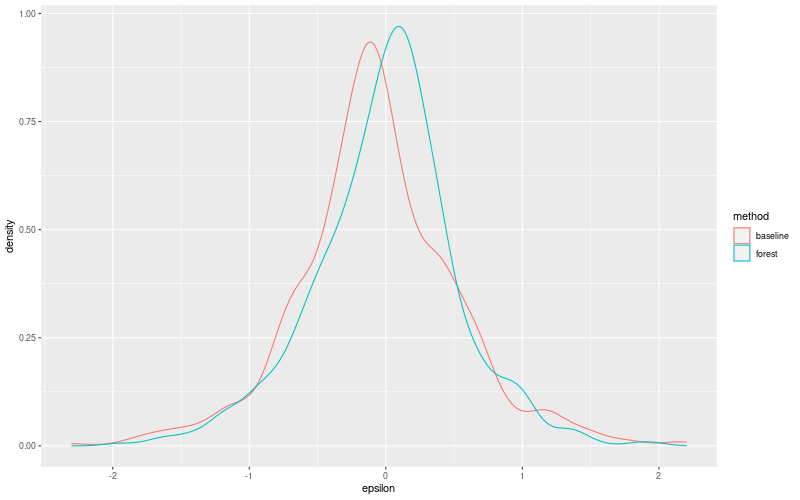
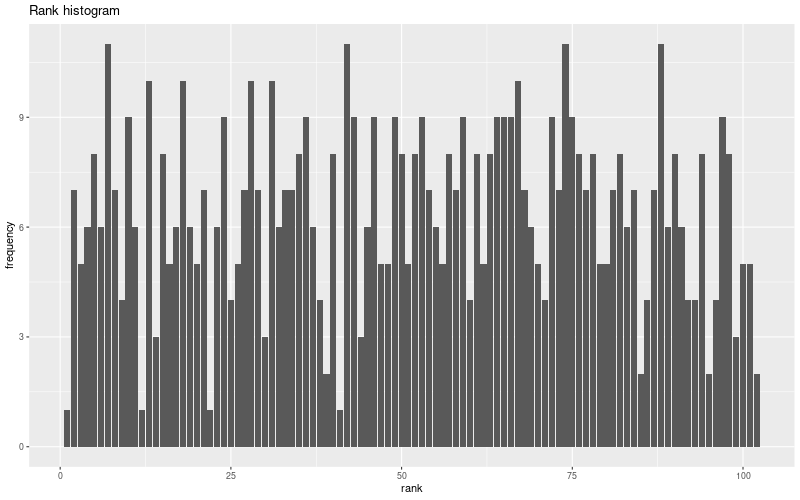
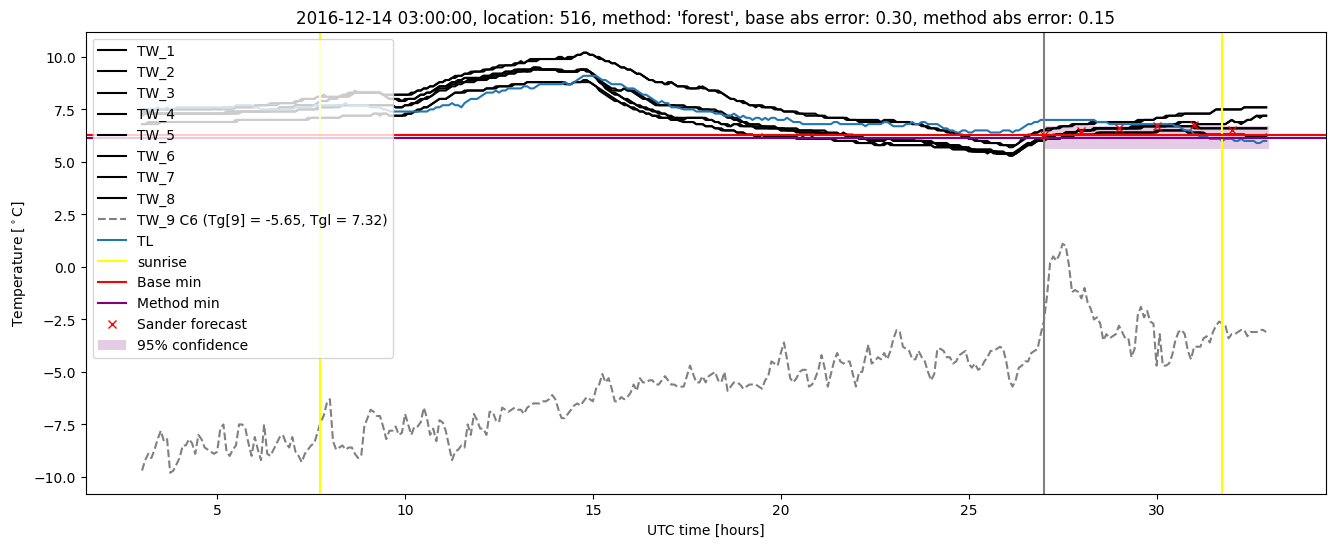
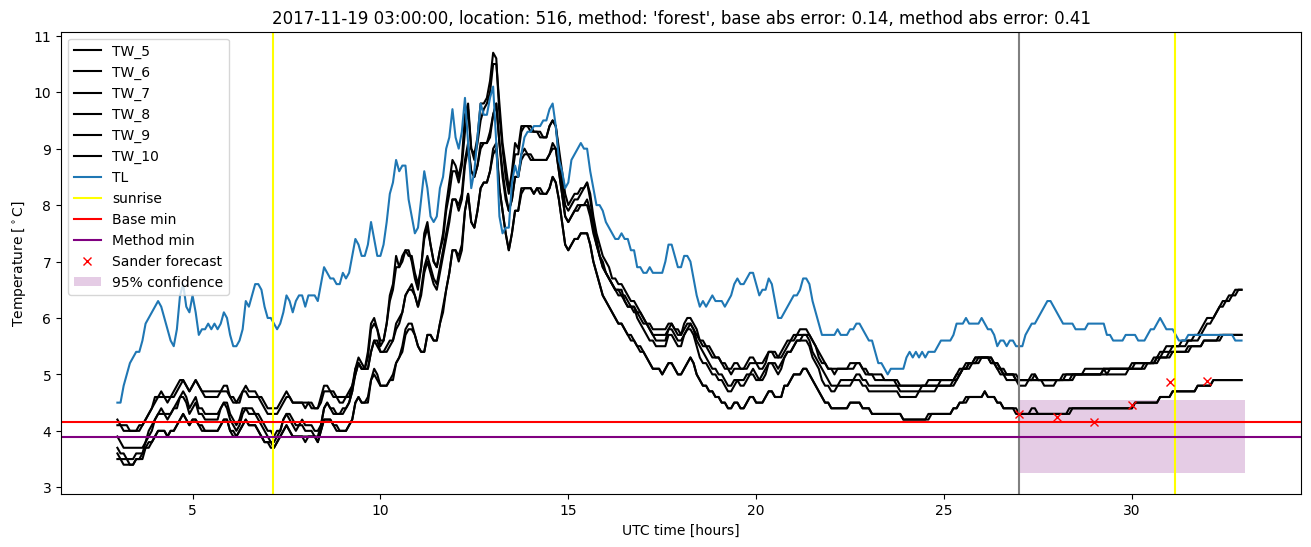
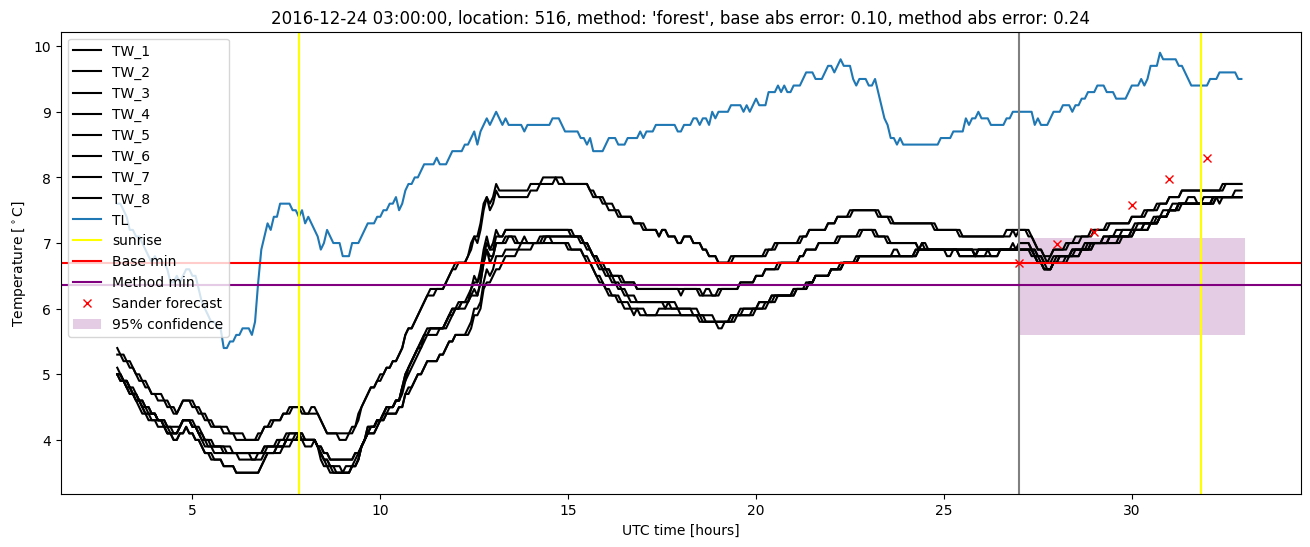
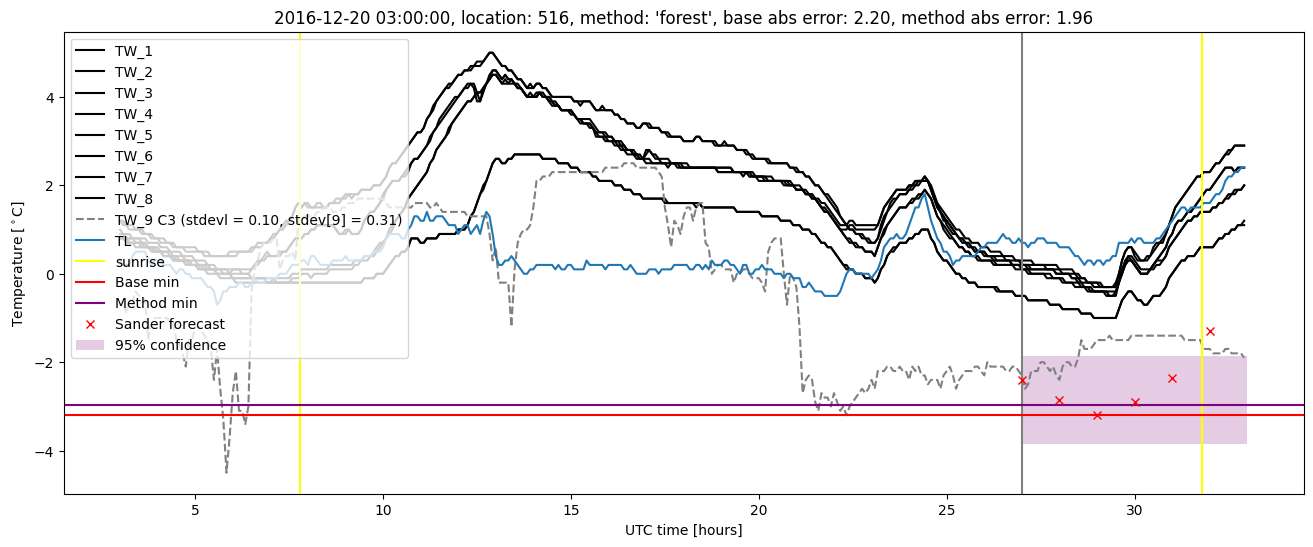
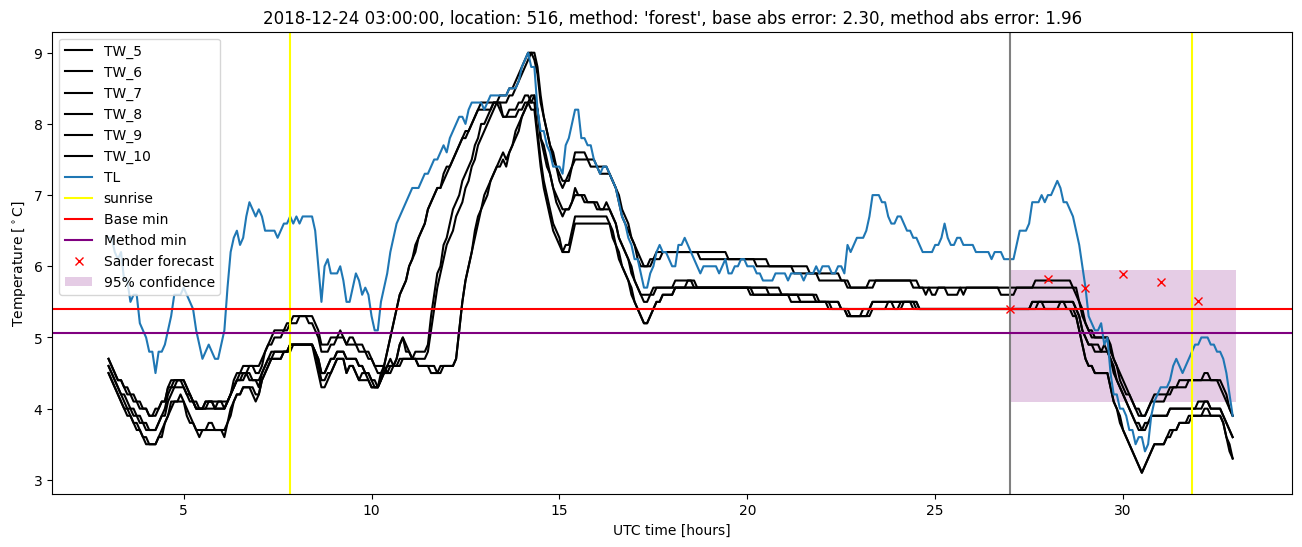
Random forest plots
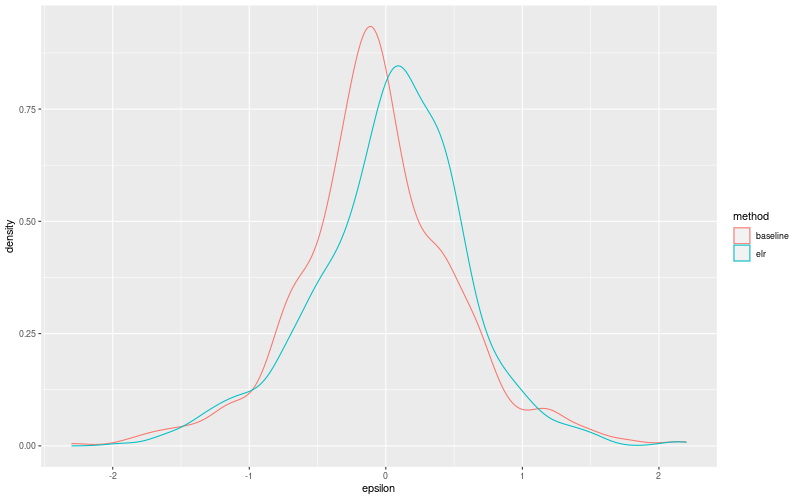
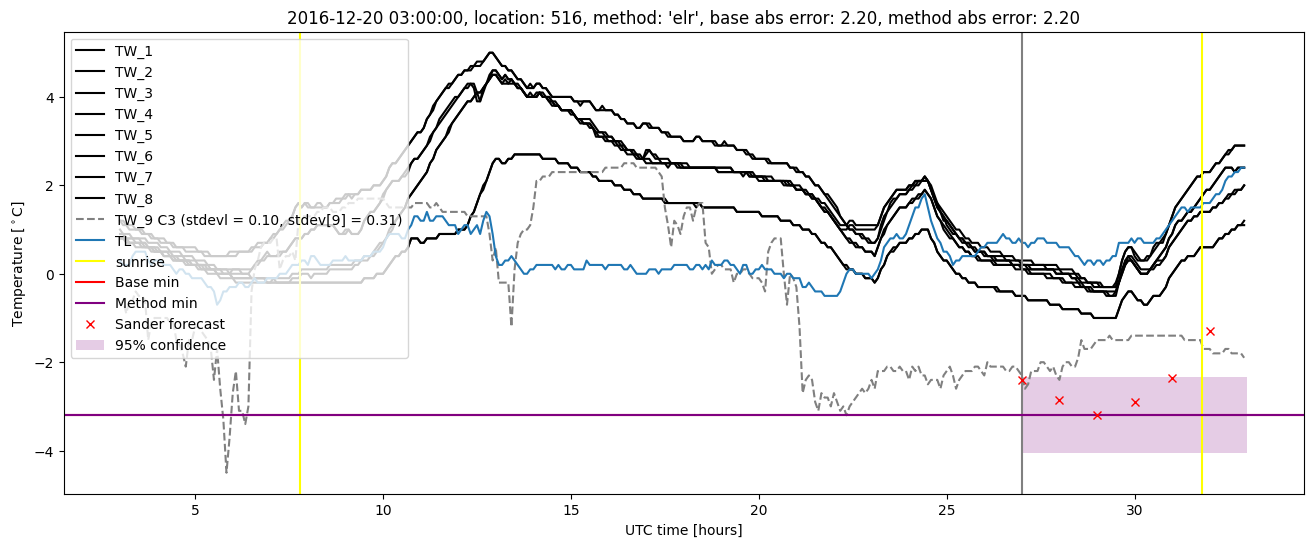
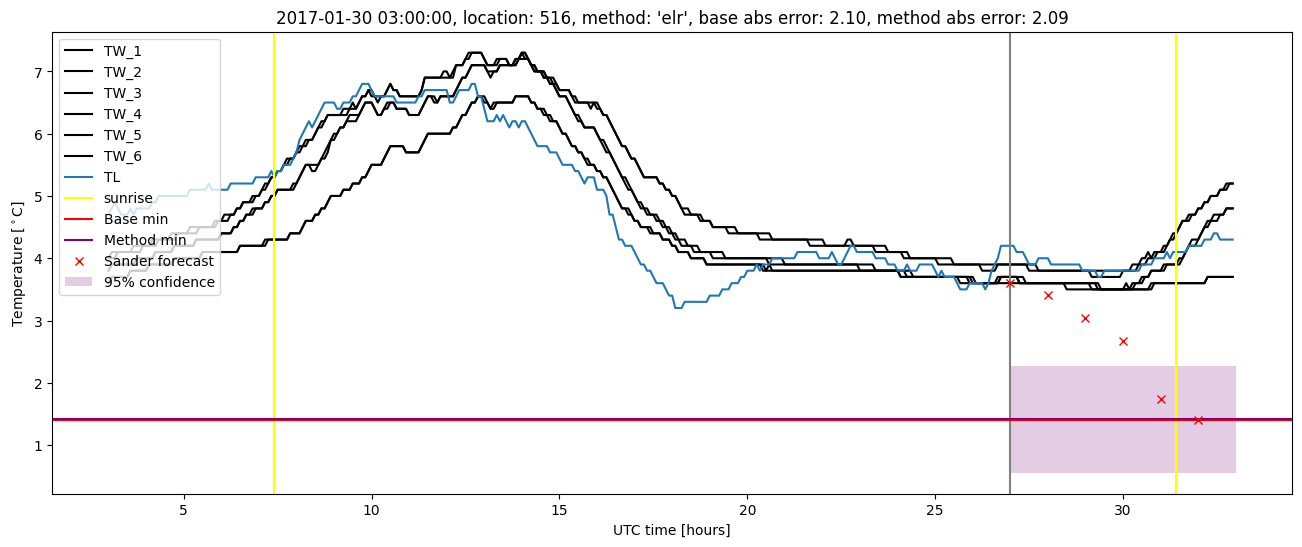
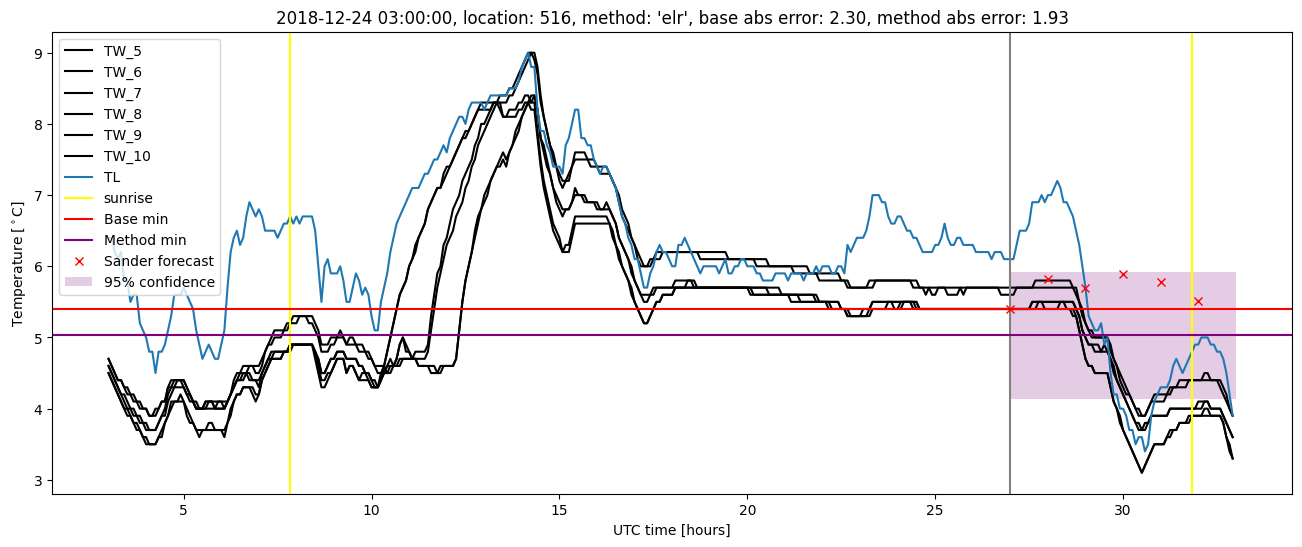
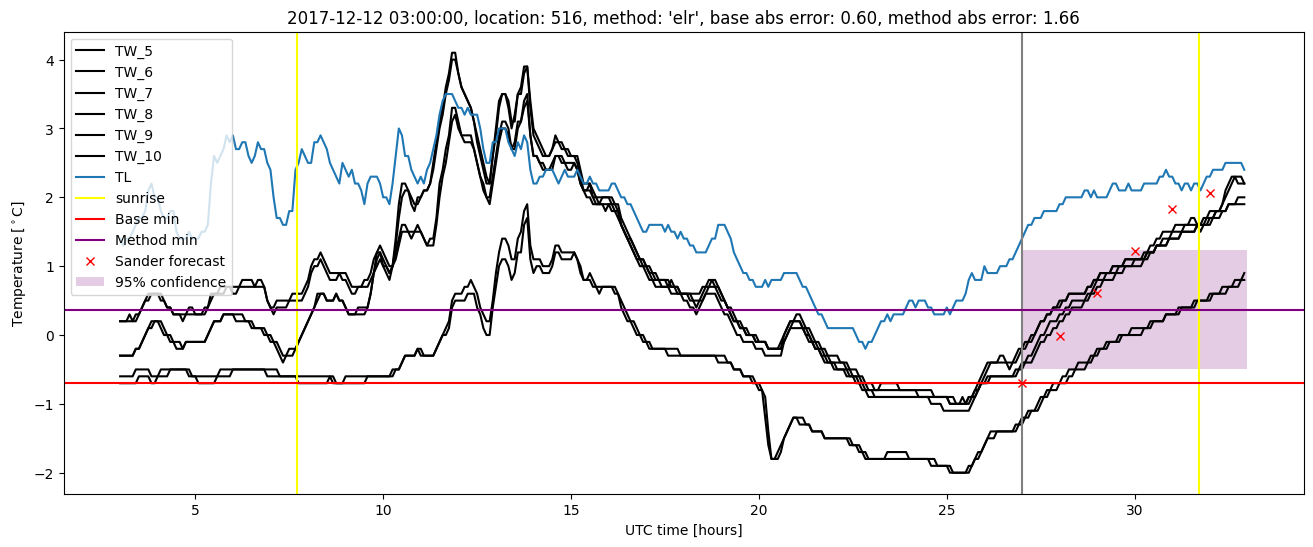
Extended logistic regression results
| names |
period |
power |
significance |
meanSquareError |
absError |
maxError |
CRPS |
IGN |
| baseline |
winter 2016 |
0.989 |
0.100 |
0.321 |
0.436 |
1.916 |
NaN |
NaN |
| elr |
winter 2016 |
0.983 |
0.100 |
0.310 |
0.435 |
1.636 |
0.603 |
5.410 |
| baseline |
winter 2017 |
0.933 |
0.189 |
0.436 |
0.476 |
2.199 |
NaN |
NaN |
| elr |
winter 2017 |
0.944 |
0.135 |
0.369 |
0.440 |
2.196 |
0.584 |
5.400 |
| baseline |
winter 2018 |
0.986 |
0.057 |
0.344 |
0.421 |
1.830 |
NaN |
NaN |
| elr |
winter 2018 |
0.979 |
0.143 |
0.327 |
0.438 |
1.661 |
0.571 |
4.934 |
| baseline |
winter 2019 |
1.000 |
0.000e+00 |
0.309 |
0.429 |
2.299 |
NaN |
NaN |
| elr |
winter 2019 |
0.993 |
0.071 |
0.272 |
0.405 |
1.933 |
0.565 |
4.454 |
| baseline |
all |
0.982 |
0.104 |
0.346 |
0.438 |
2.299 |
NaN |
NaN |
| elr |
all |
0.978 |
0.123 |
0.317 |
0.430 |
2.196 |
0.582 |
5.052 |
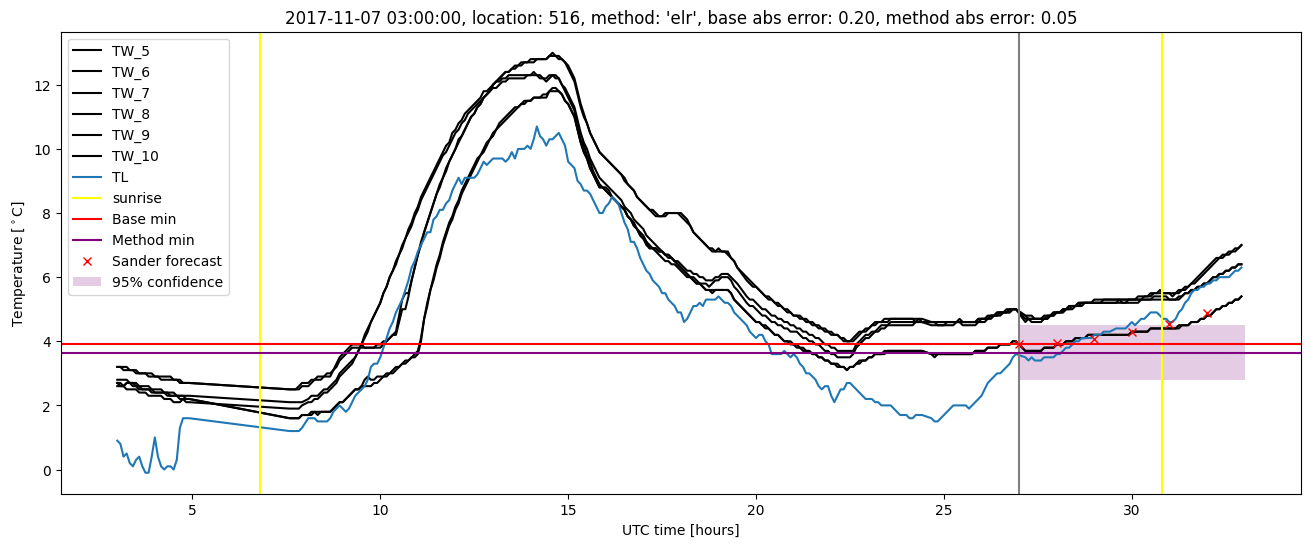
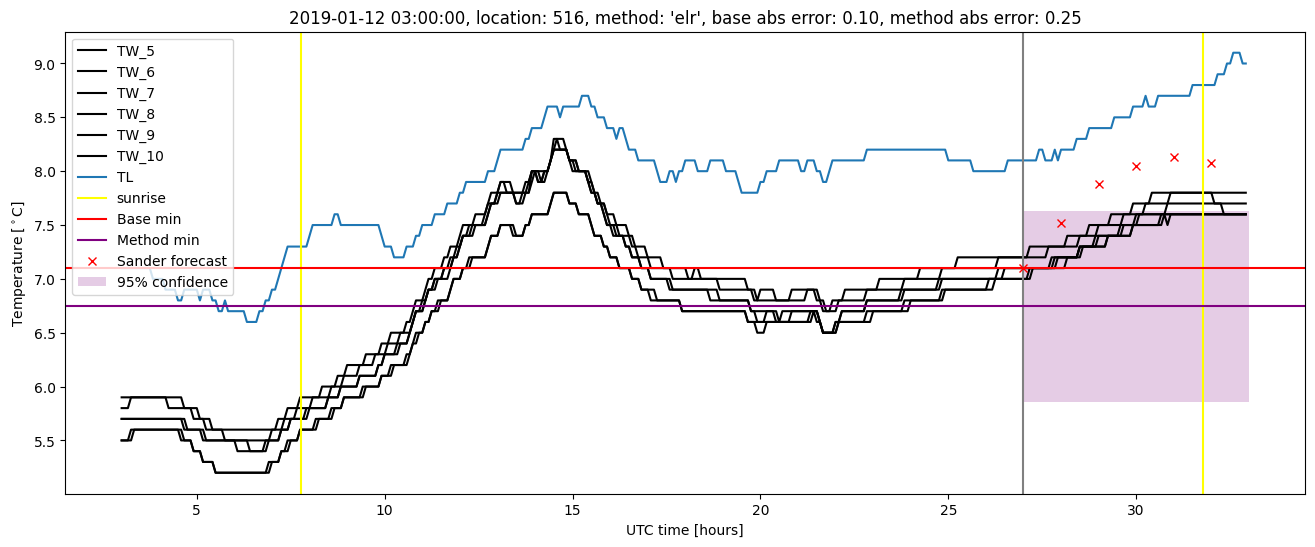
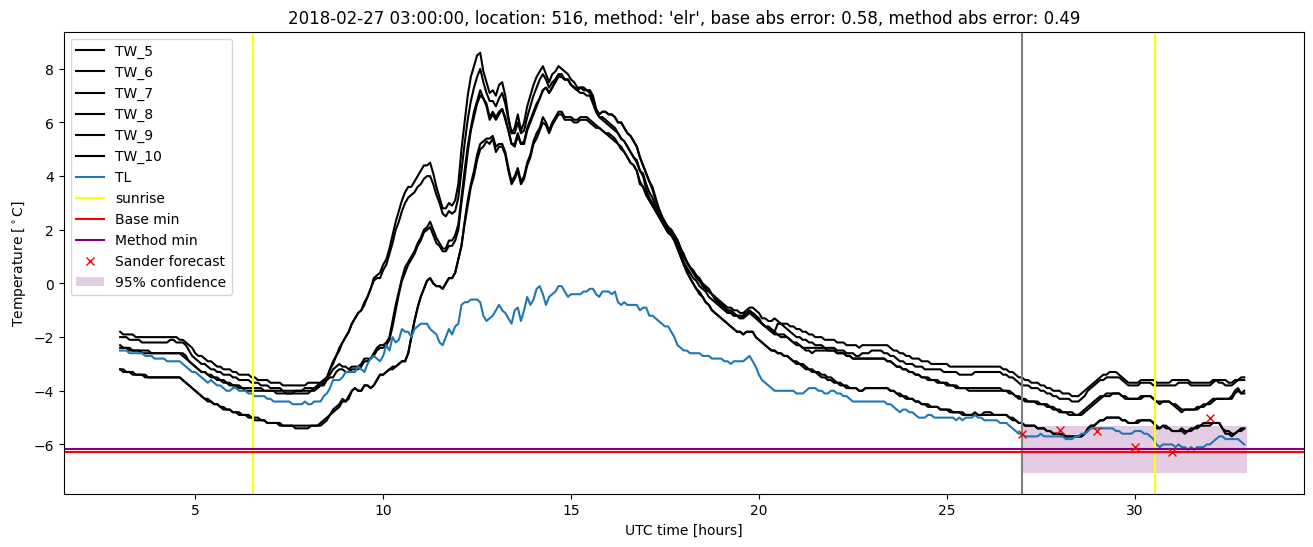
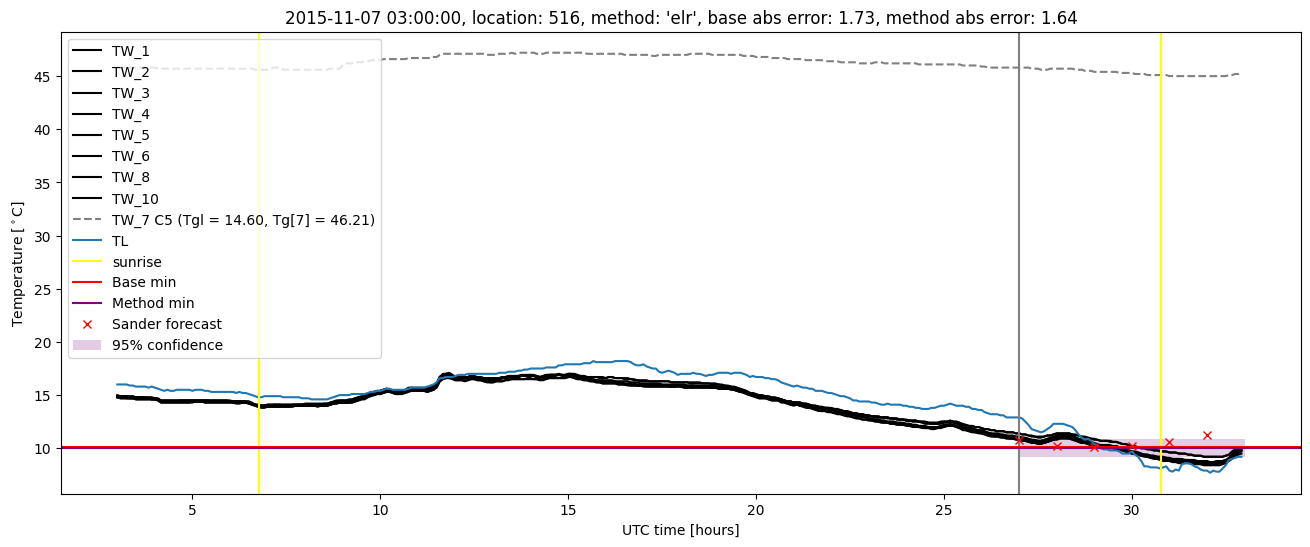
Extended logistic regression plots