GMS location: 515
Random forest results
| names |
period |
power |
significance |
meanSquareError |
absError |
maxError |
CRPS |
IGN |
| baseline |
winter 2016 |
0.994 |
0.167 |
0.369 |
0.452 |
2.198 |
NaN |
NaN |
| forest |
winter 2016 |
0.977 |
0.125 |
0.328 |
0.416 |
2.301 |
0.522 |
1.634 |
| baseline |
winter 2017 |
0.991 |
0.068 |
0.562 |
0.542 |
3.501 |
NaN |
NaN |
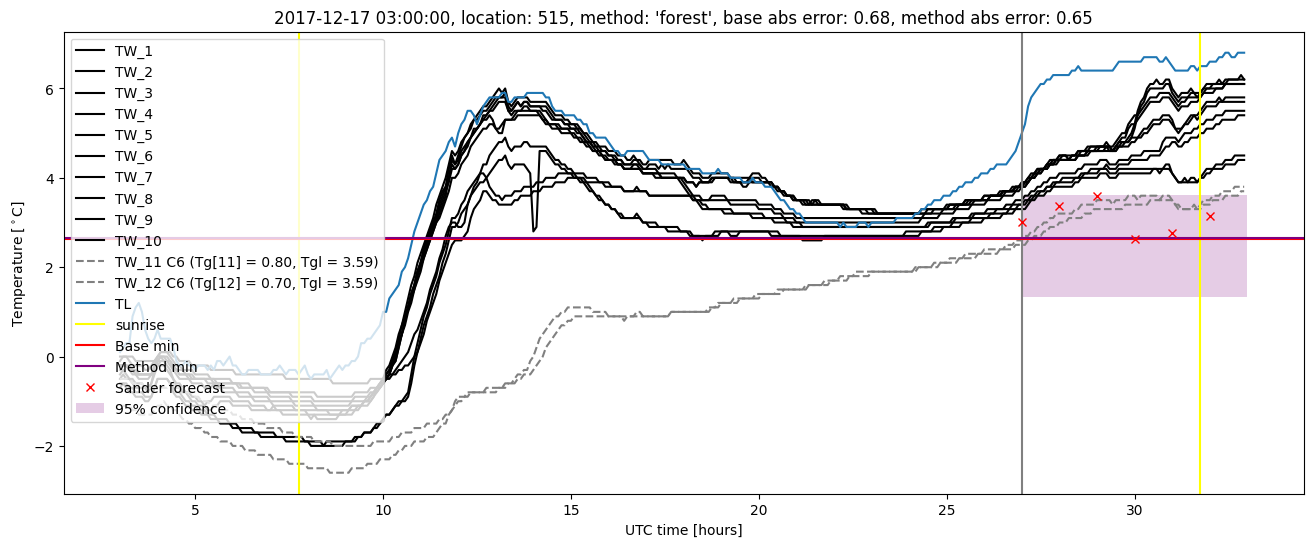
| forest |
winter 2017 |
0.991 |
0.045 |
0.473 |
0.484 |
3.339 |
0.503 |
1.879 |
| baseline |
winter 2018 |
0.992 |
0.167 |
1.508 |
0.736 |
6.500 |
NaN |
NaN |
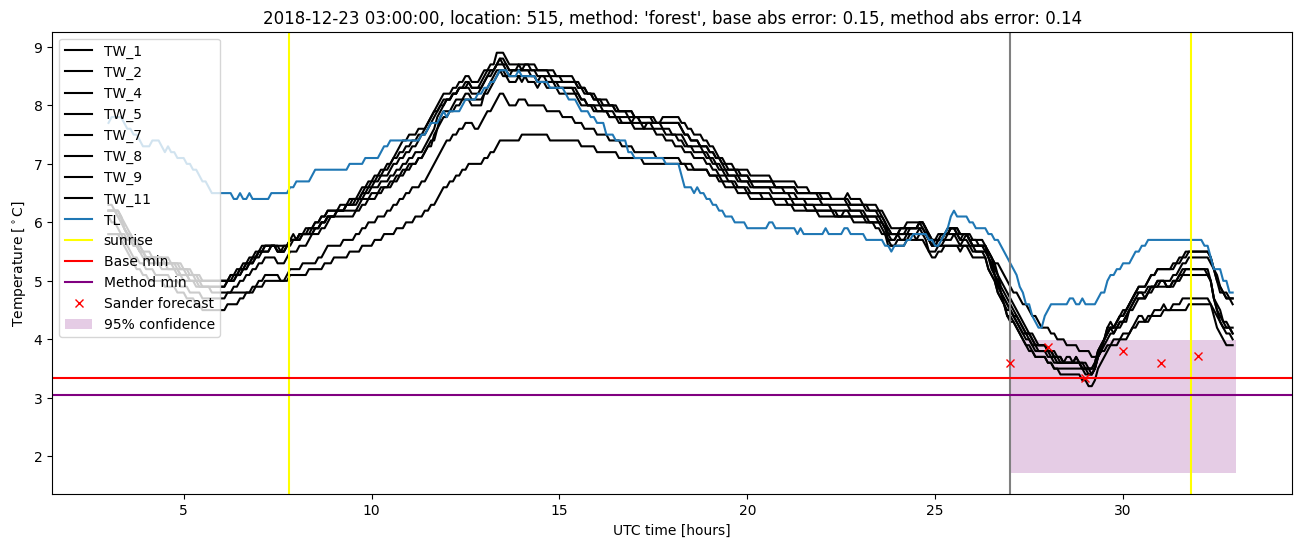
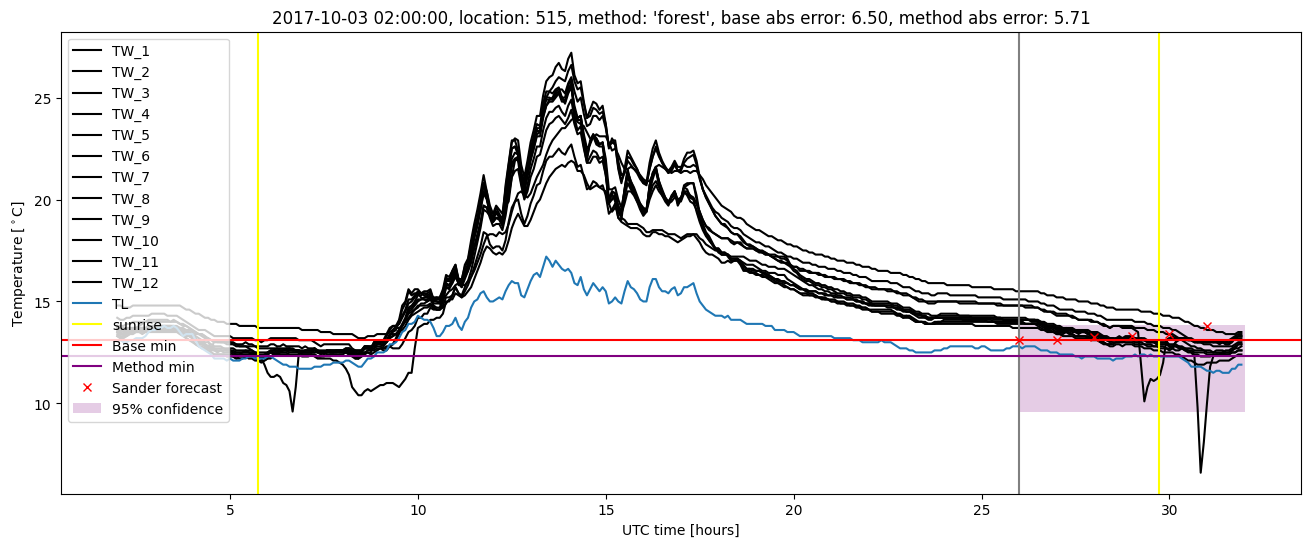
| forest |
winter 2018 |
0.977 |
0.167 |
1.365 |
0.701 |
5.705 |
0.553 |
3.050 |
| baseline |
winter 2019 |
0.993 |
0.000e+00 |
0.296 |
0.407 |
1.798 |
NaN |
NaN |
| forest |
winter 2019 |
0.985 |
0.000e+00 |
0.235 |
0.363 |
1.448 |
0.499 |
1.670 |
| baseline |
all |
0.993 |
0.109 |
0.677 |
0.532 |
6.500 |
NaN |
NaN |
| forest |
all |
0.982 |
0.091 |
0.596 |
0.490 |
5.705 |
0.520 |
2.047 |
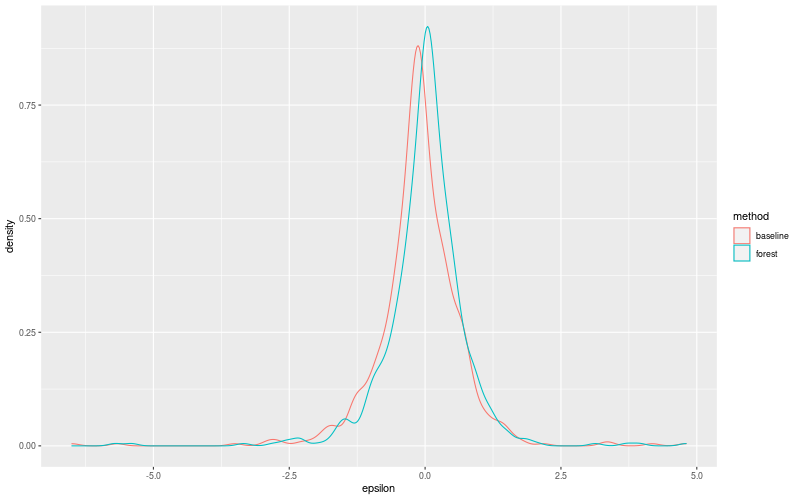
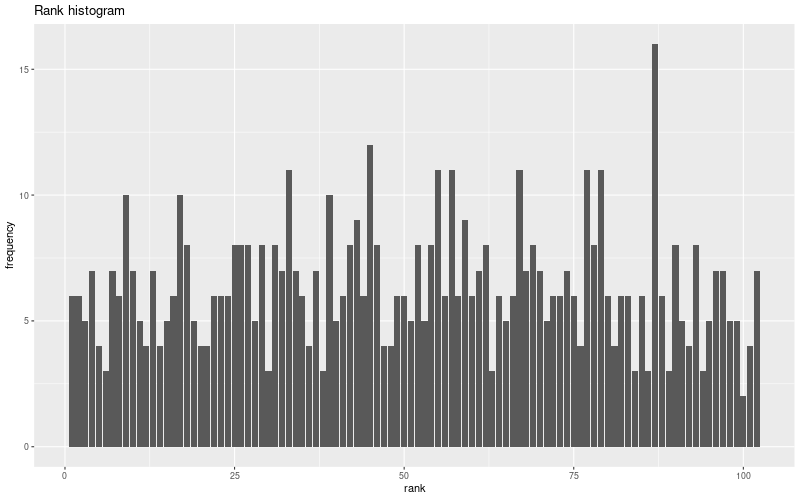
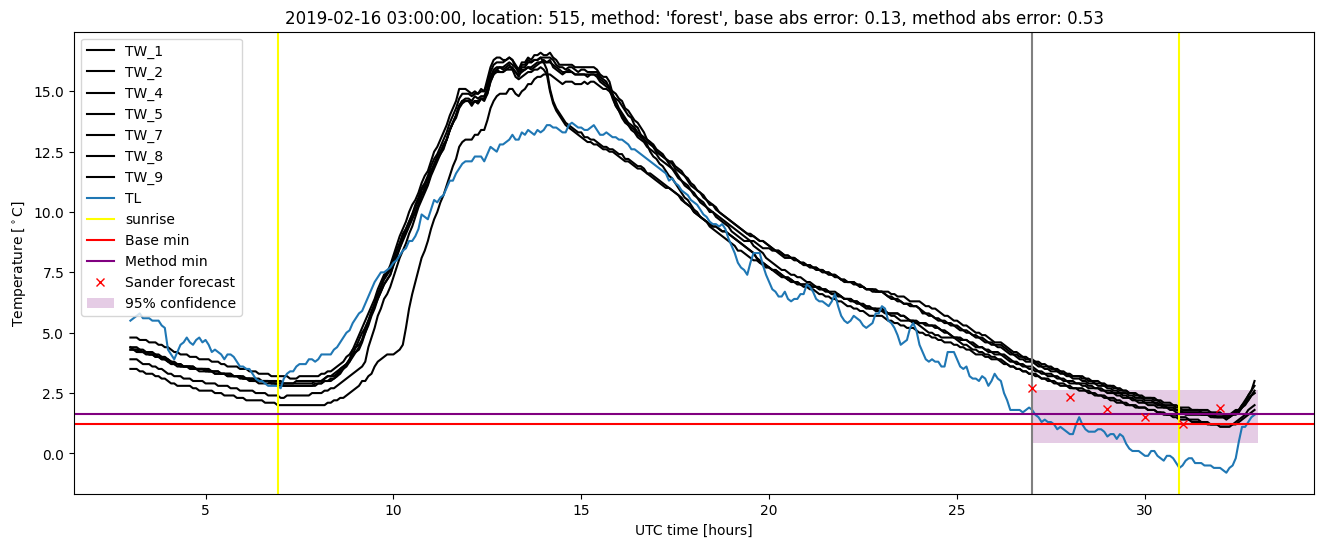
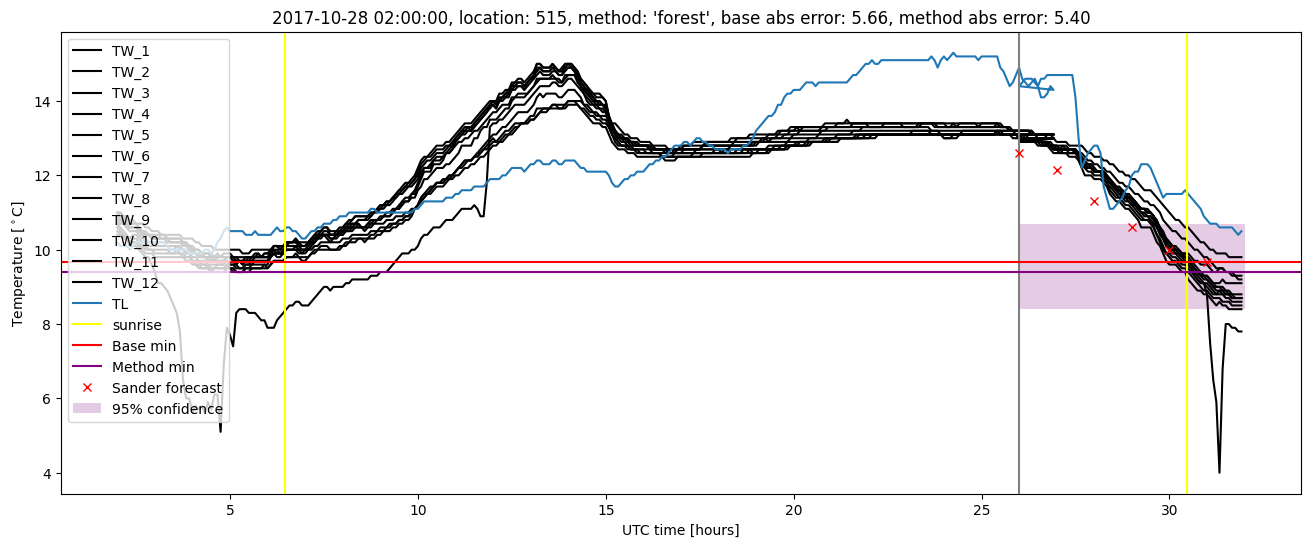
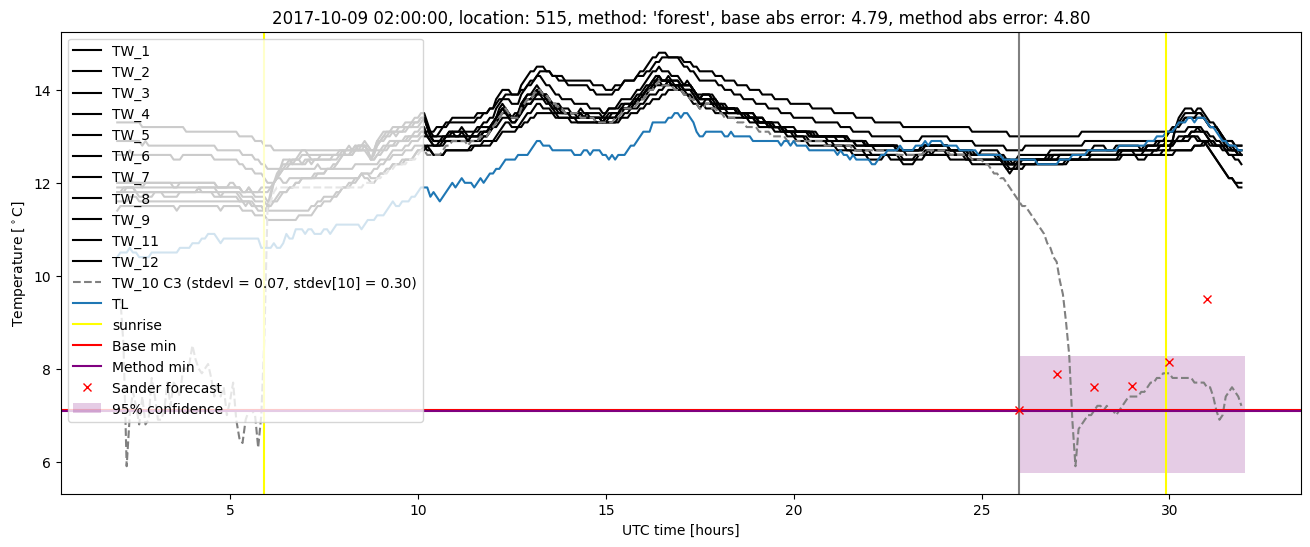
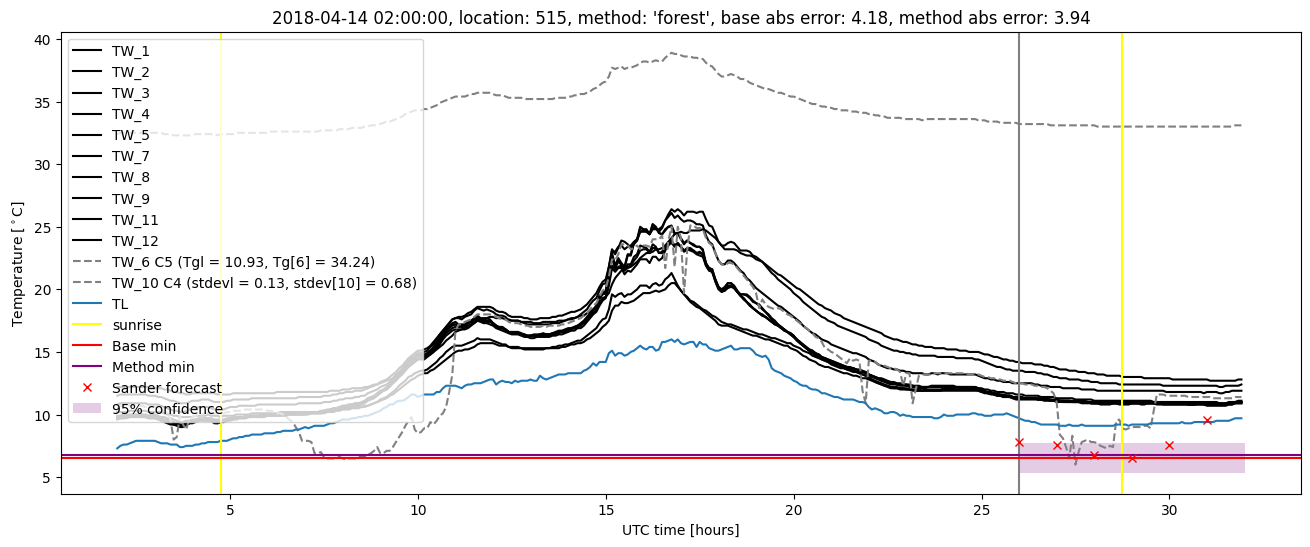
Random forest plots

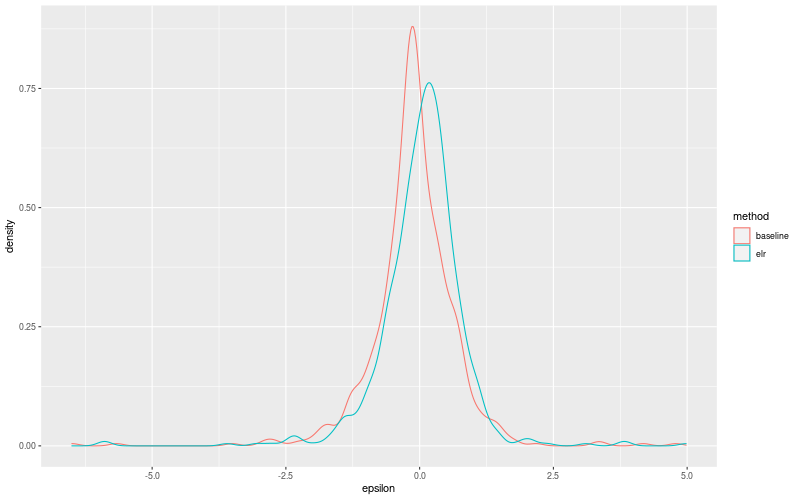
Extended logistic regression results
| names |
period |
power |
significance |
meanSquareError |
absError |
maxError |
CRPS |
IGN |
| baseline |
winter 2016 |
0.994 |
0.167 |
0.369 |
0.452 |
2.198 |
NaN |
NaN |
| elr |
winter 2016 |
0.988 |
0.167 |
0.399 |
0.468 |
2.384 |
0.582 |
1.768 |
| baseline |
winter 2017 |
0.991 |
0.068 |
0.562 |
0.542 |
3.501 |
NaN |
NaN |
| elr |
winter 2017 |
0.972 |
0.045 |
0.524 |
0.528 |
3.600 |
0.545 |
1.696 |
| baseline |
winter 2018 |
0.992 |
0.167 |
1.508 |
0.736 |
6.500 |
NaN |
NaN |
| elr |
winter 2018 |
0.977 |
0.167 |
1.431 |
0.732 |
5.906 |
0.636 |
5.062 |
| baseline |
winter 2019 |
0.993 |
0.000e+00 |
0.296 |
0.407 |
1.798 |
NaN |
NaN |
| elr |
winter 2019 |
0.985 |
0.000e+00 |
0.221 |
0.372 |
1.456 |
0.542 |
1.557 |
| baseline |
all |
0.993 |
0.109 |
0.677 |
0.532 |
6.500 |
NaN |
NaN |
| elr |
all |
0.982 |
0.100 |
0.641 |
0.525 |
5.906 |
0.578 |
2.515 |
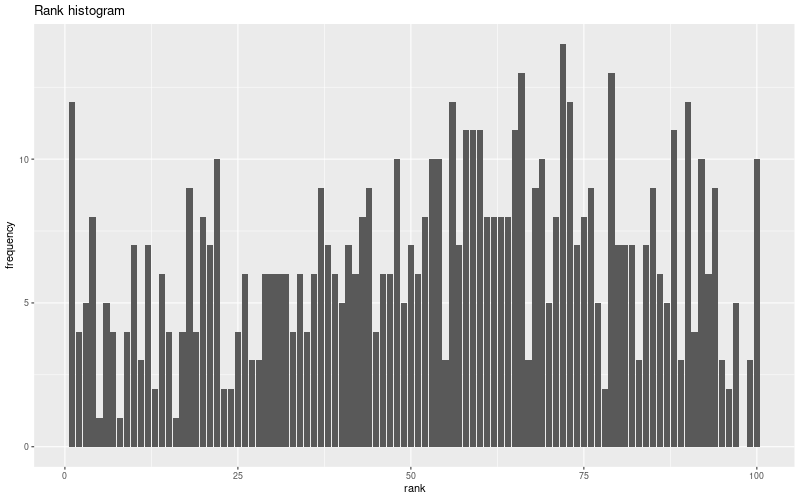
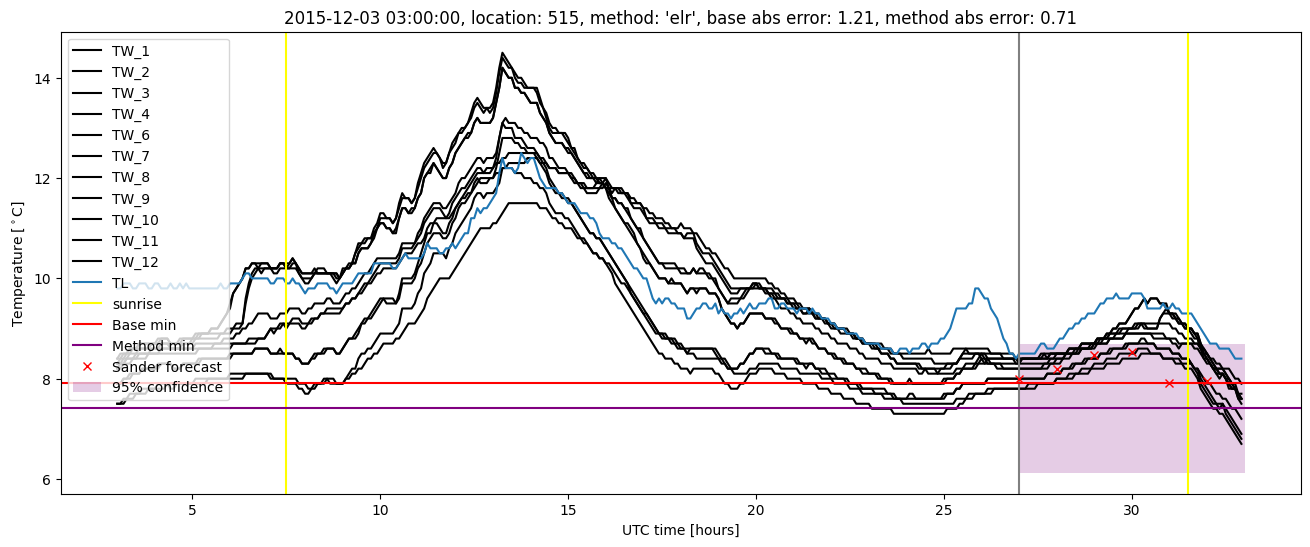
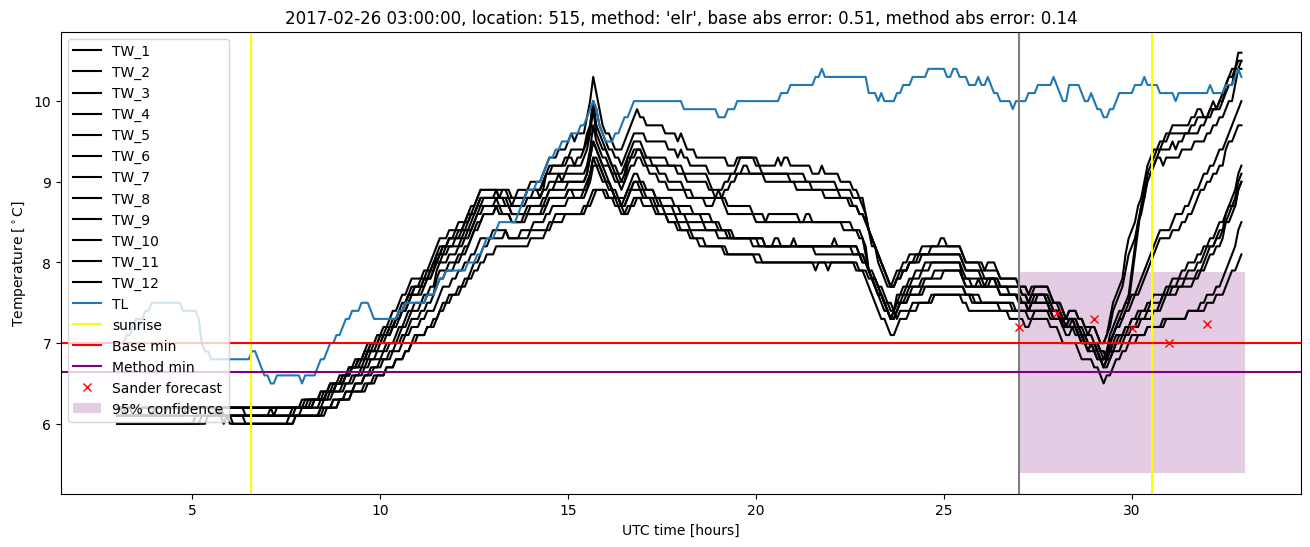
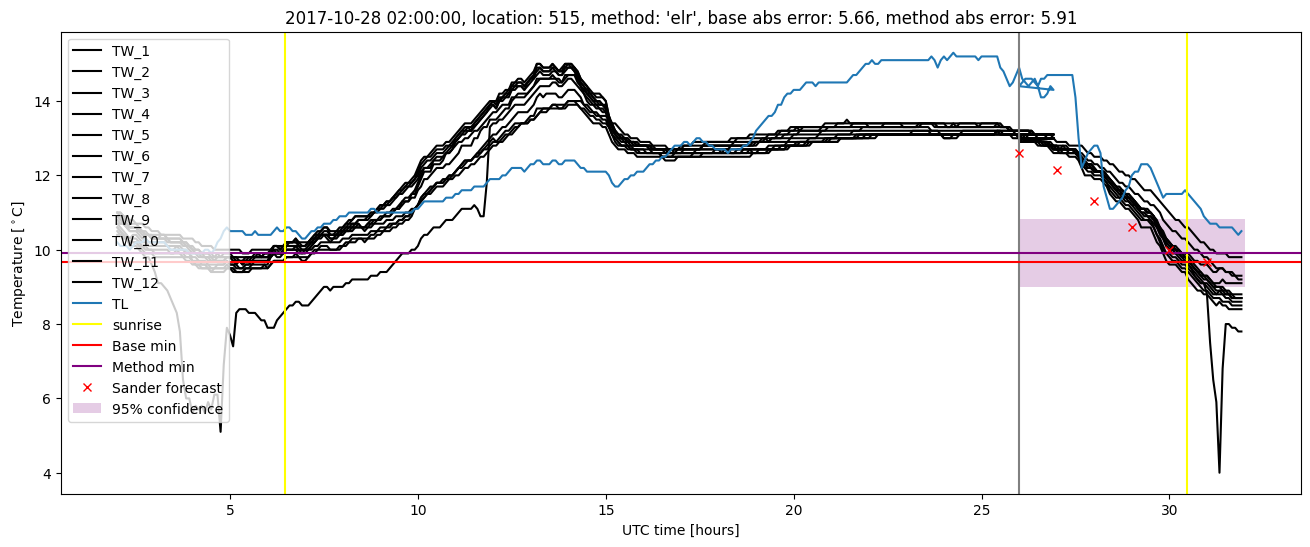
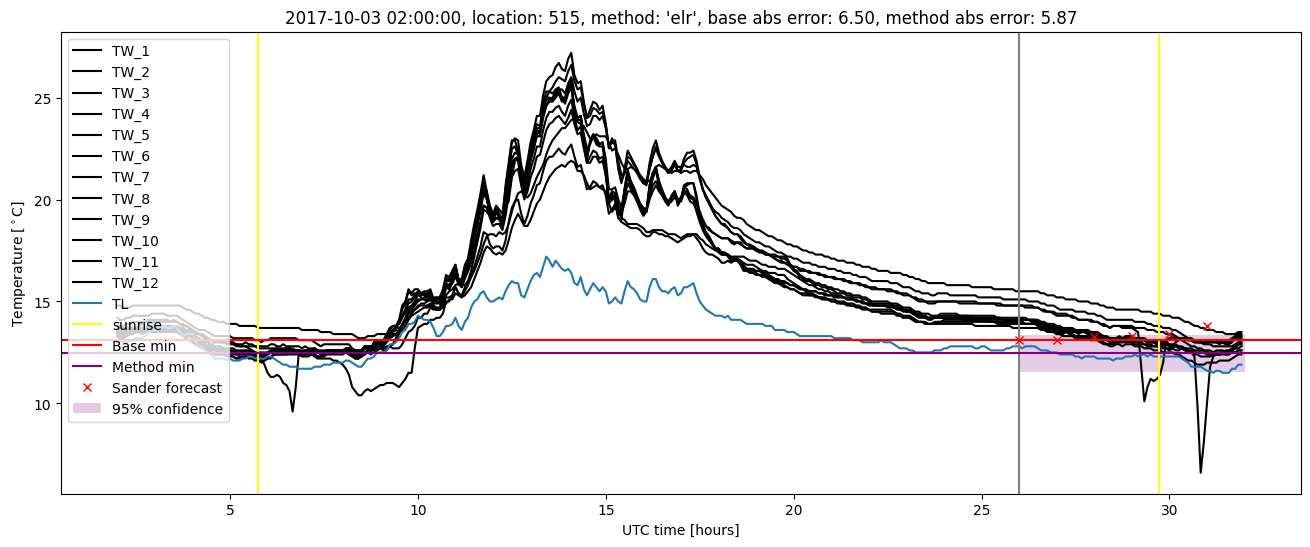
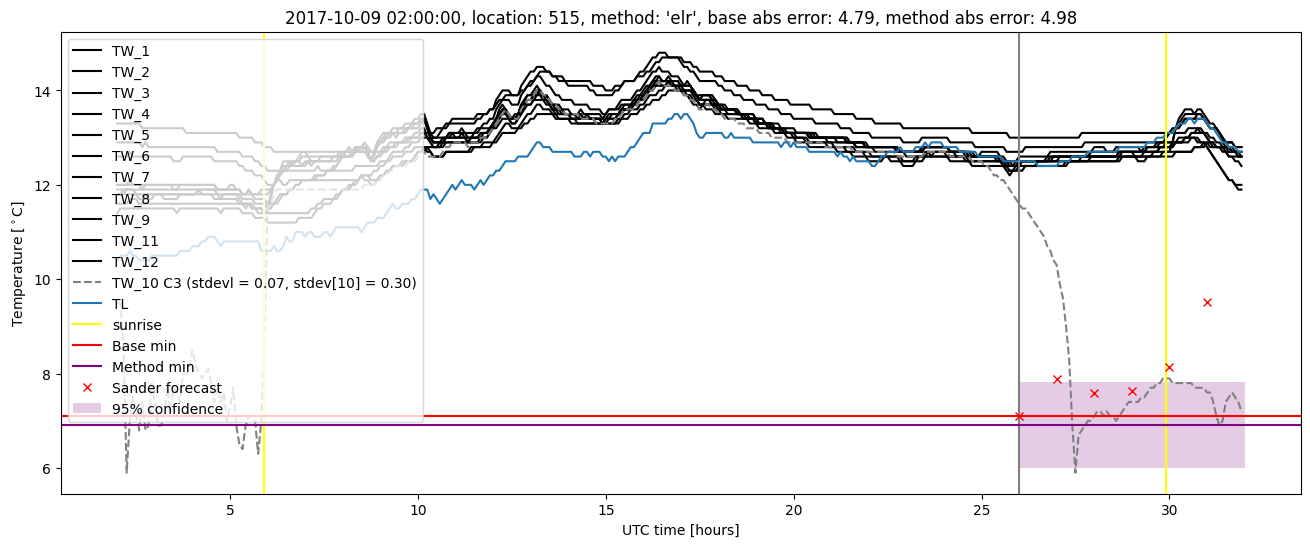
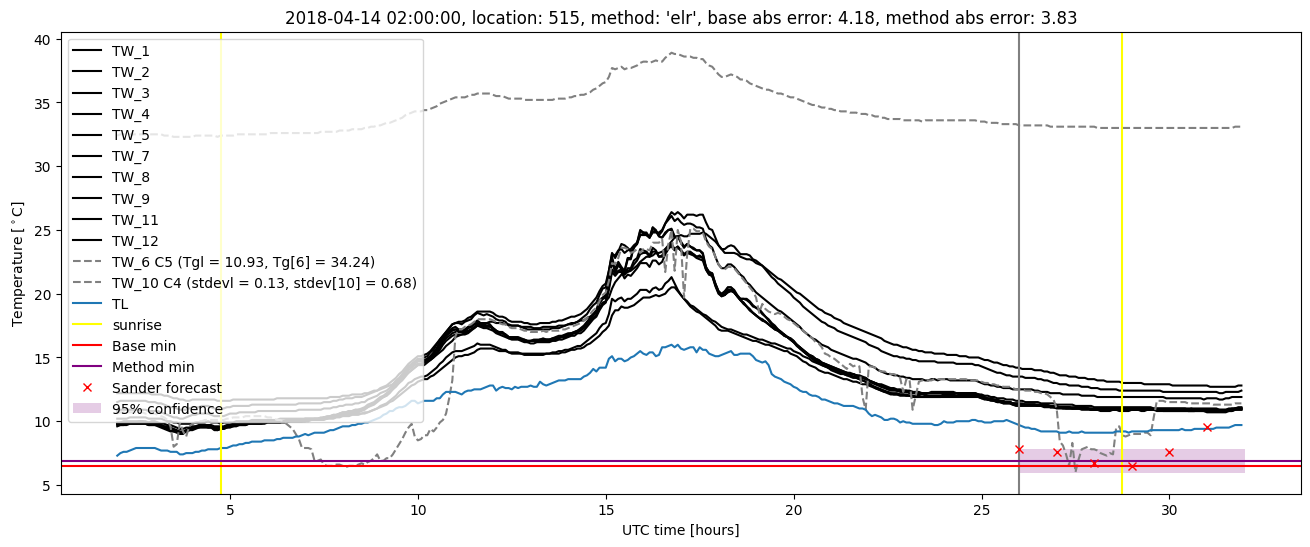
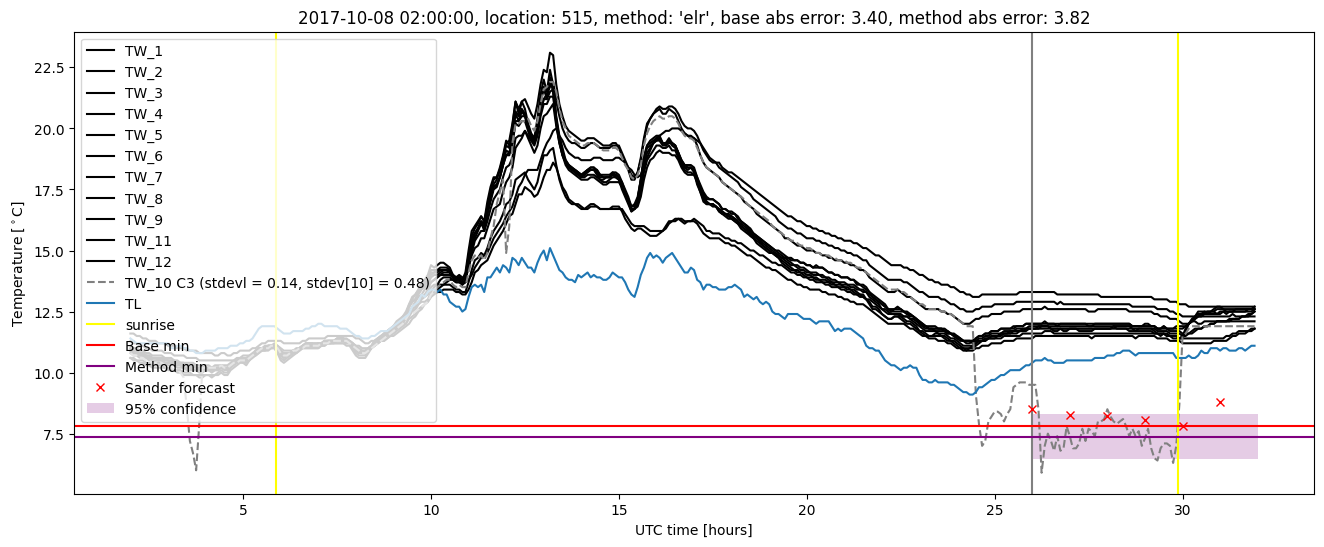
Extended logistic regression plots