GMS location: 514
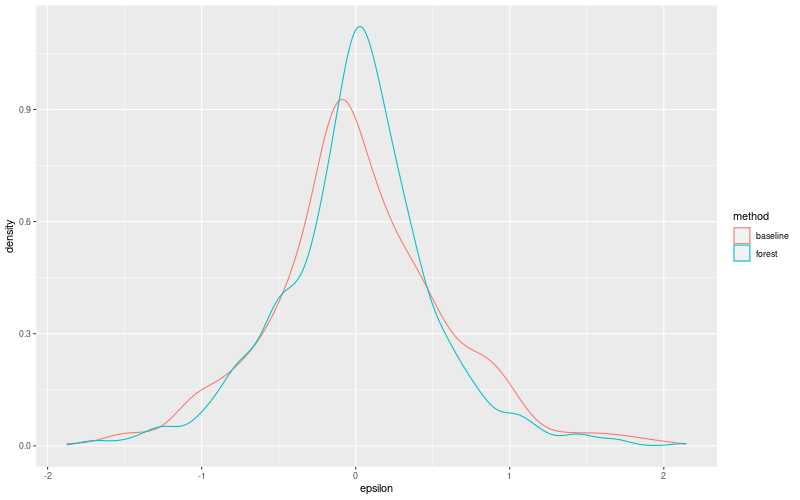
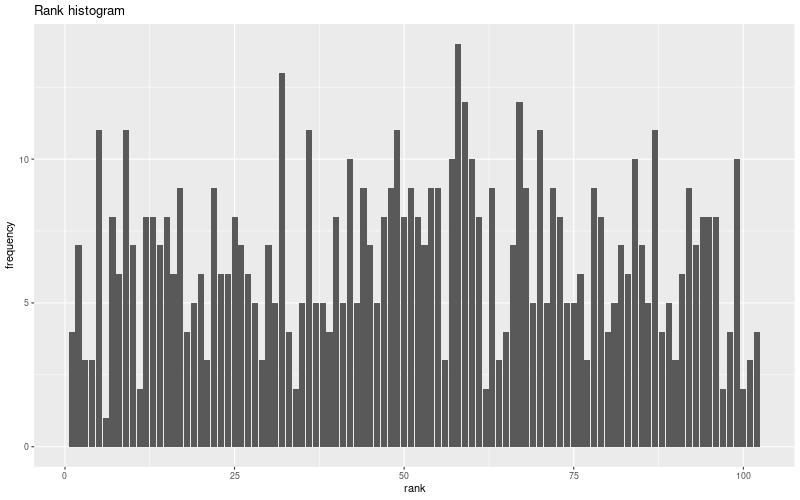
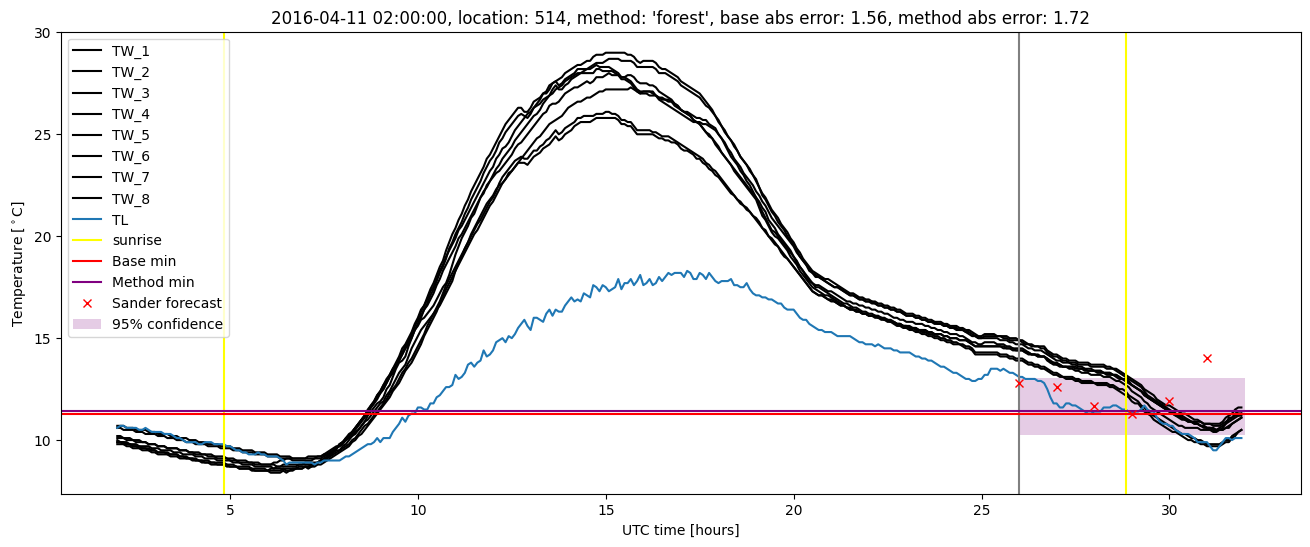
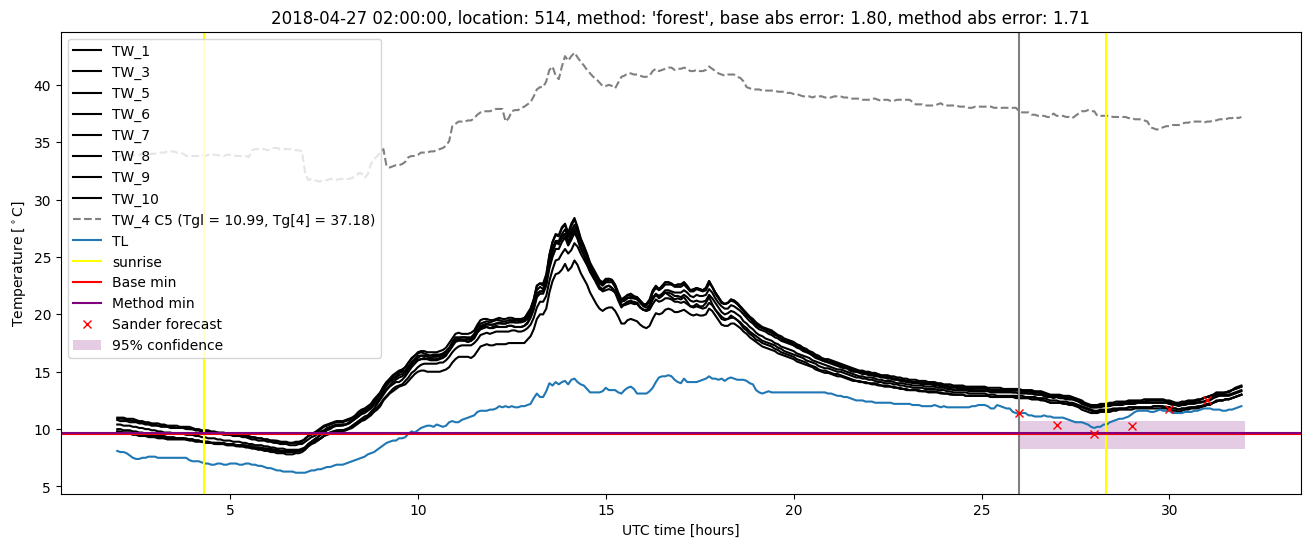
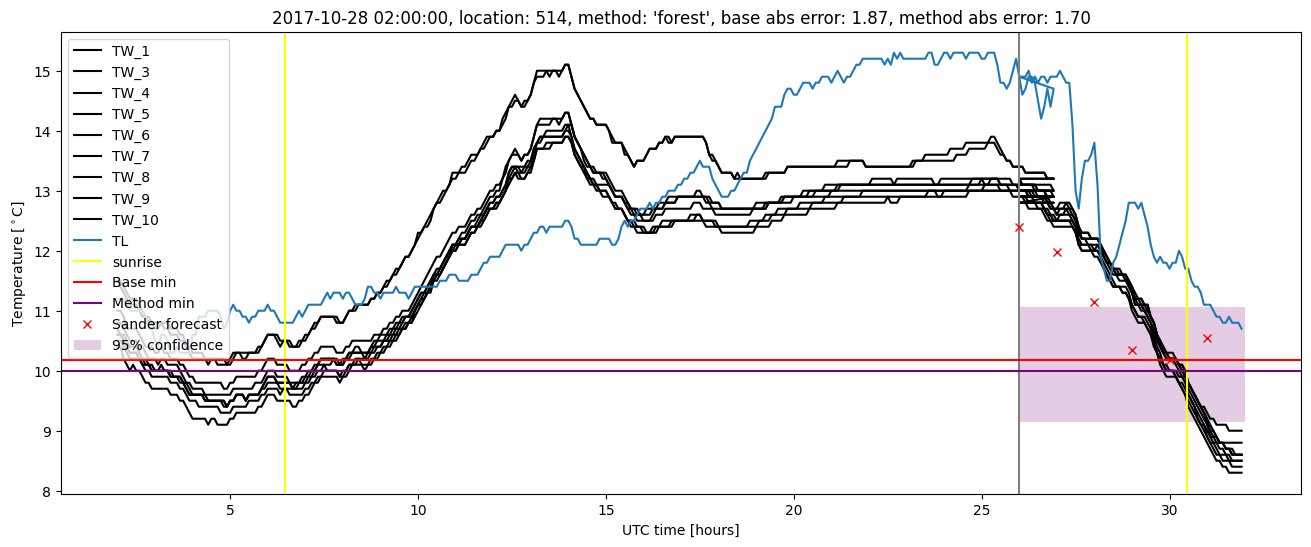
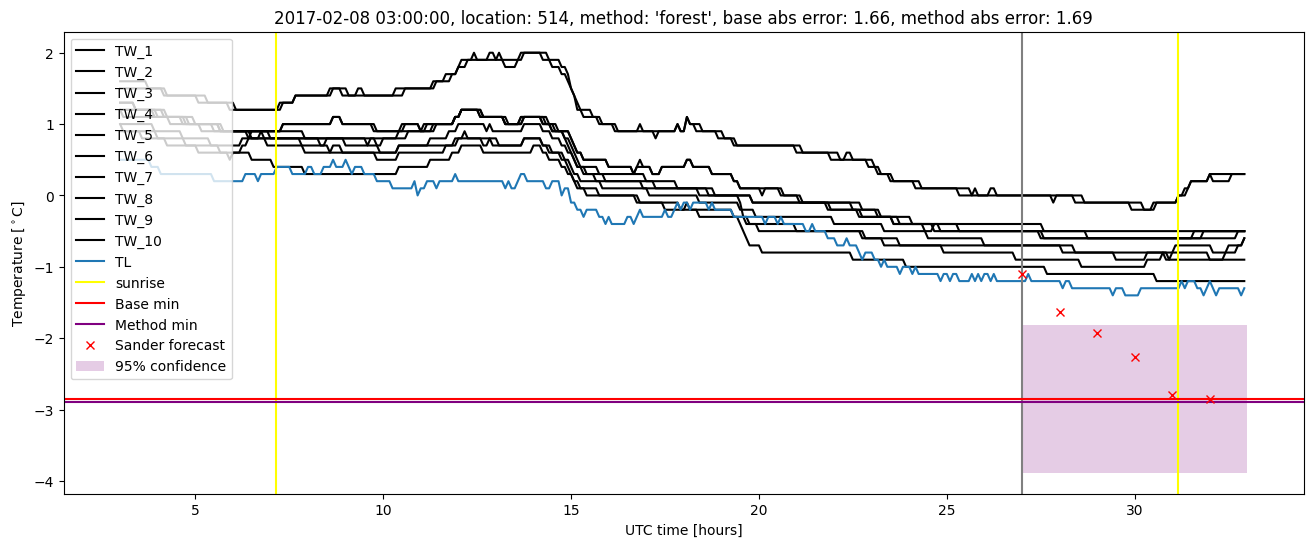
Random forest results
| names |
period |
power |
significance |
meanSquareError |
absError |
maxError |
CRPS |
IGN |
| baseline |
winter 2016 |
0.989 |
0.048 |
0.303 |
0.423 |
1.563 |
NaN |
NaN |
| forest |
winter 2016 |
0.989 |
0.048 |
0.237 |
0.369 |
1.723 |
0.486 |
4.362 |
| baseline |
winter 2017 |
0.947 |
0.079 |
0.386 |
0.467 |
1.822 |
NaN |
NaN |
| forest |
winter 2017 |
0.974 |
0.079 |
0.286 |
0.392 |
1.691 |
0.483 |
4.558 |
| baseline |
winter 2018 |
0.979 |
0.154 |
0.367 |
0.442 |
2.045 |
NaN |
NaN |
| forest |
winter 2018 |
0.986 |
0.128 |
0.282 |
0.374 |
2.144 |
0.487 |
4.412 |
| baseline |
winter 2019 |
1.000 |
0.000e+00 |
0.245 |
0.379 |
1.598 |
NaN |
NaN |
| forest |
winter 2019 |
1.000 |
0.000e+00 |
0.172 |
0.308 |
1.223 |
0.490 |
3.717 |
| baseline |
all |
0.981 |
0.091 |
0.327 |
0.428 |
2.045 |
NaN |
NaN |
| forest |
all |
0.988 |
0.082 |
0.246 |
0.362 |
2.144 |
0.487 |
4.283 |
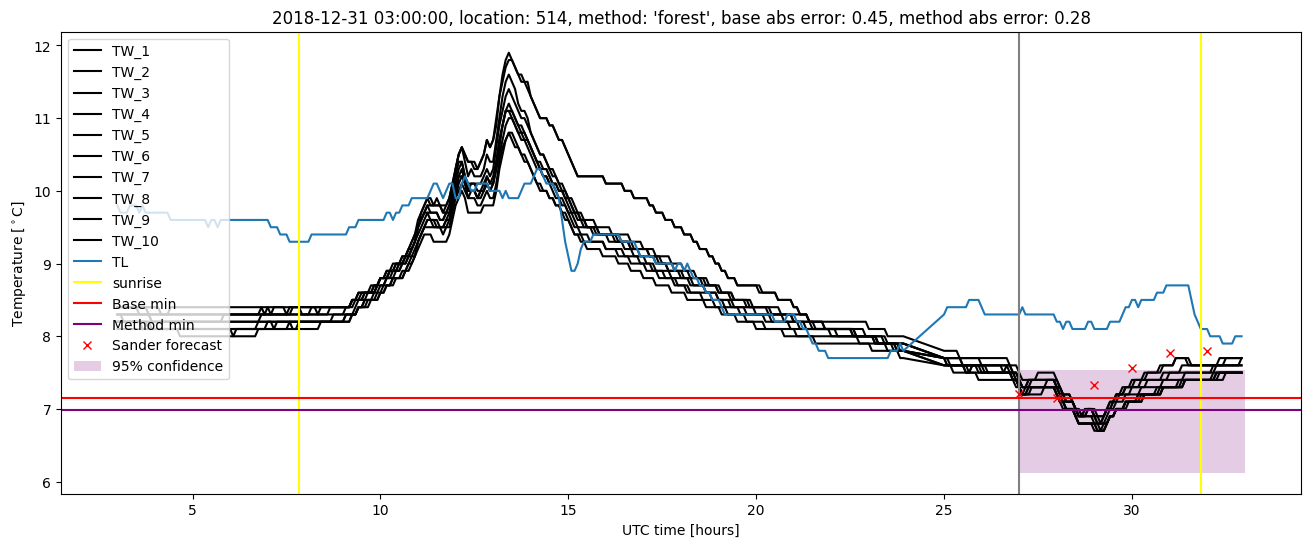
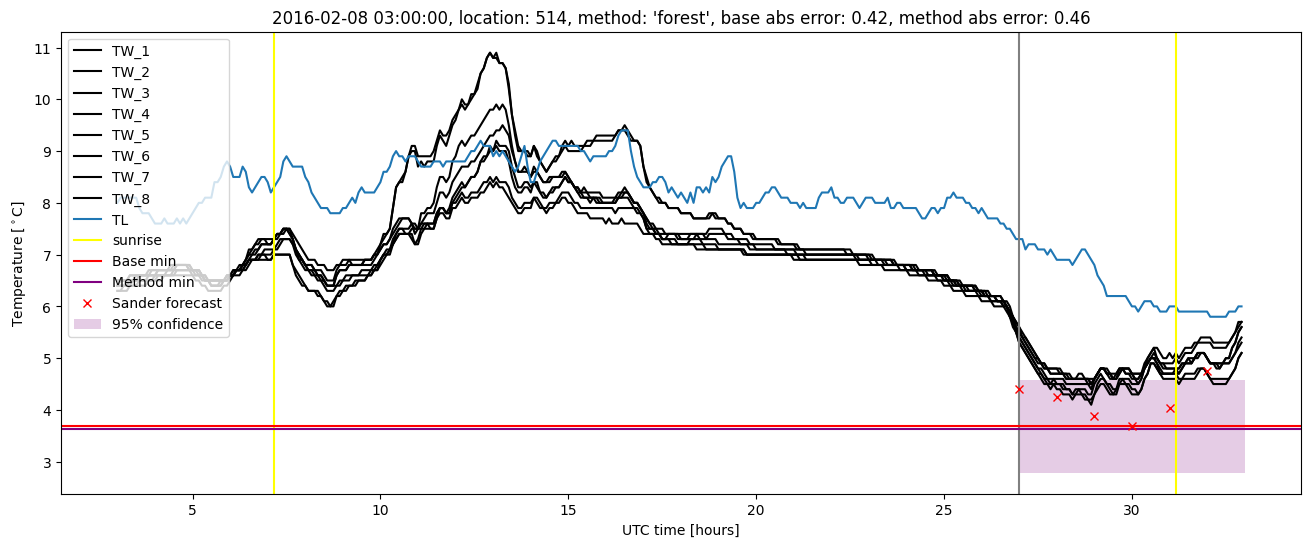
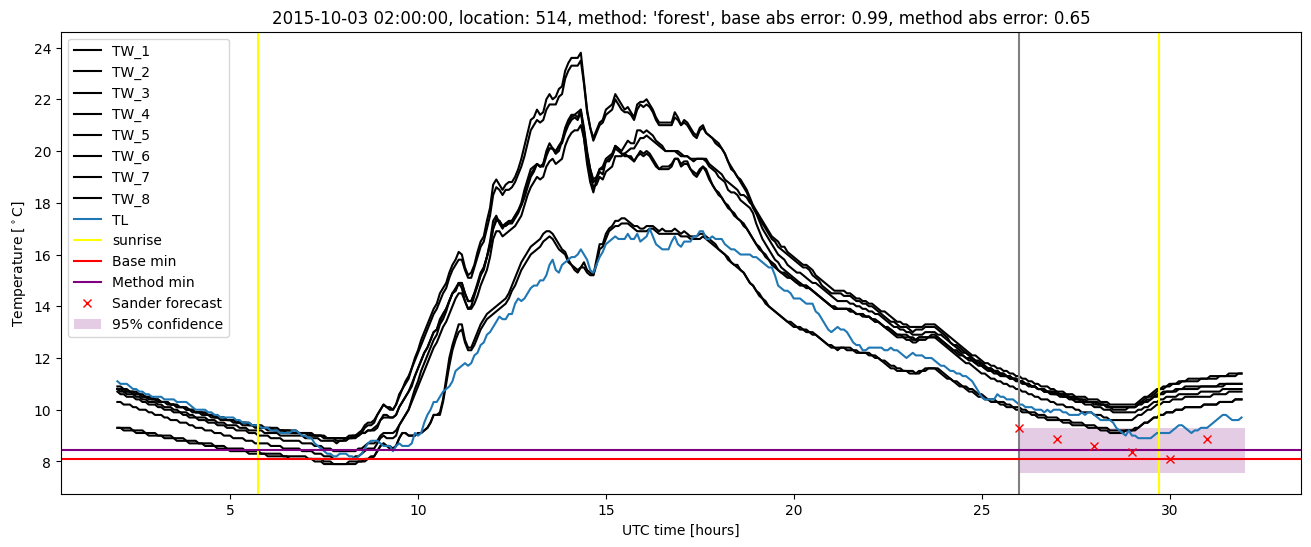
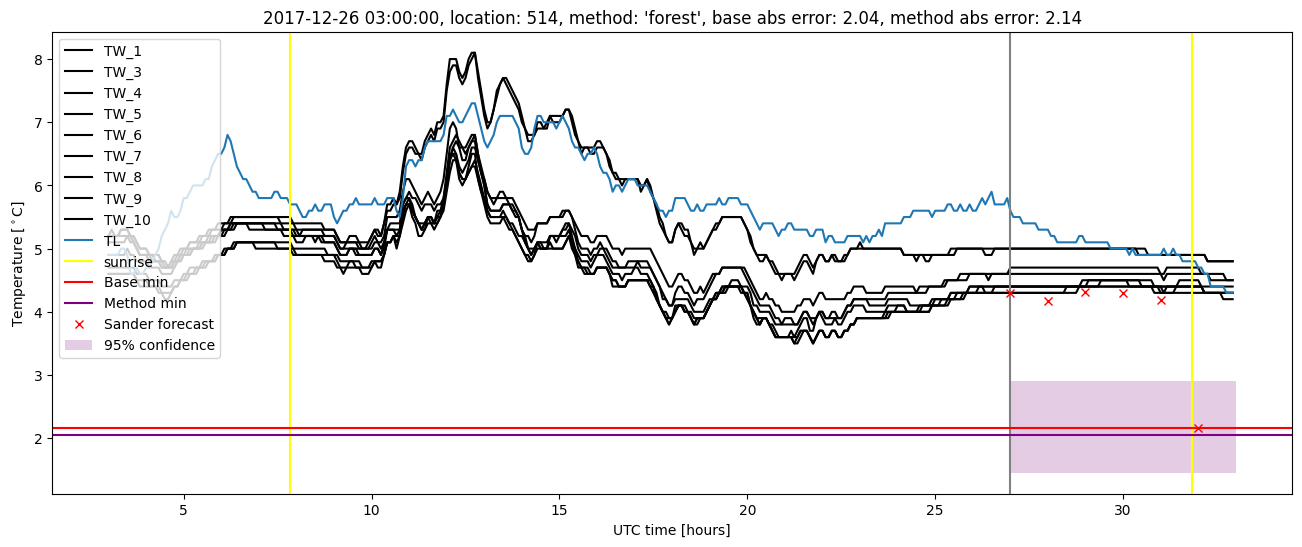
Random forest plots
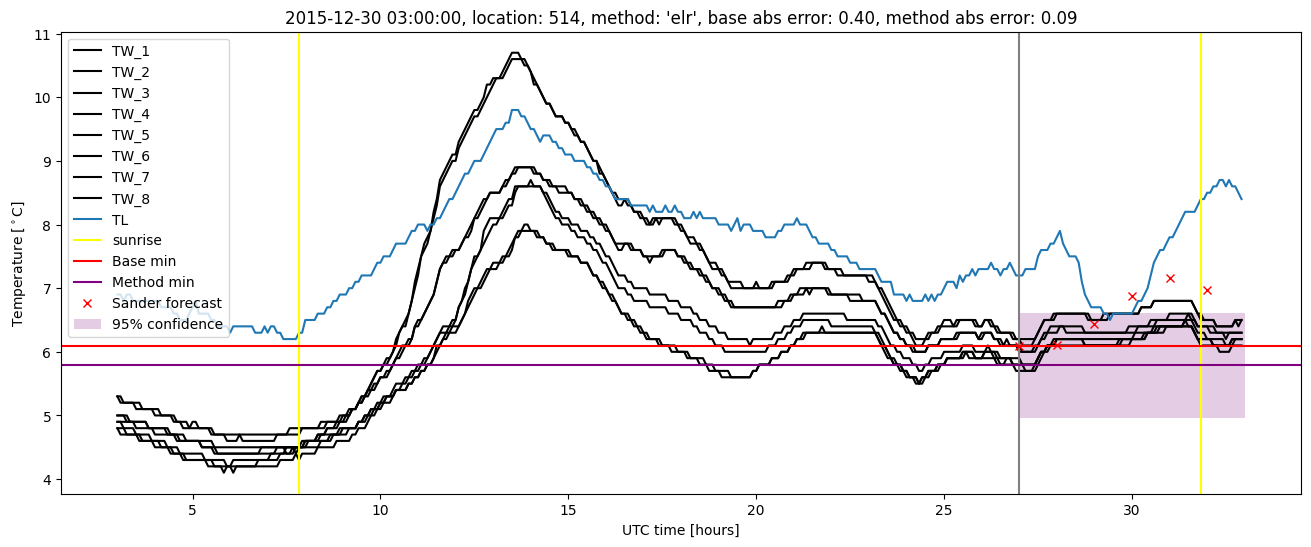
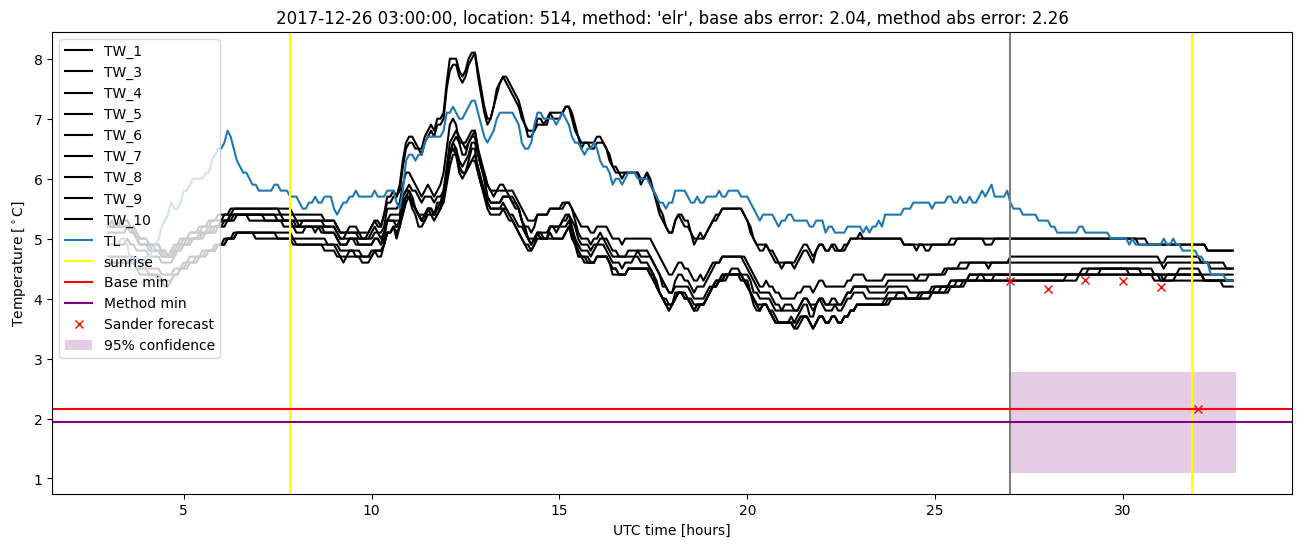
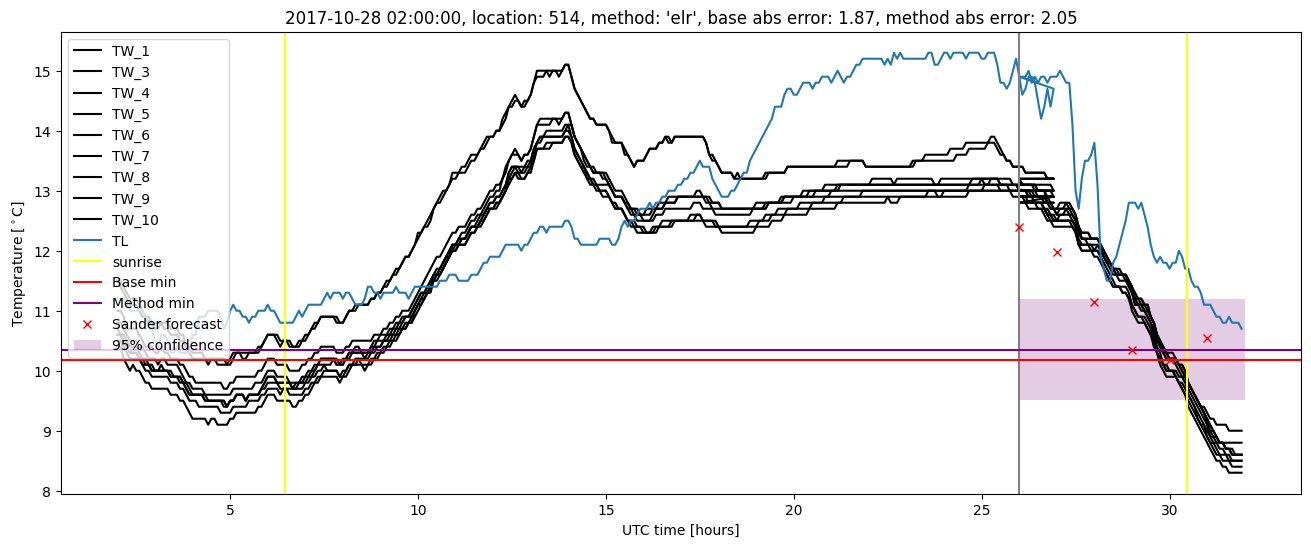
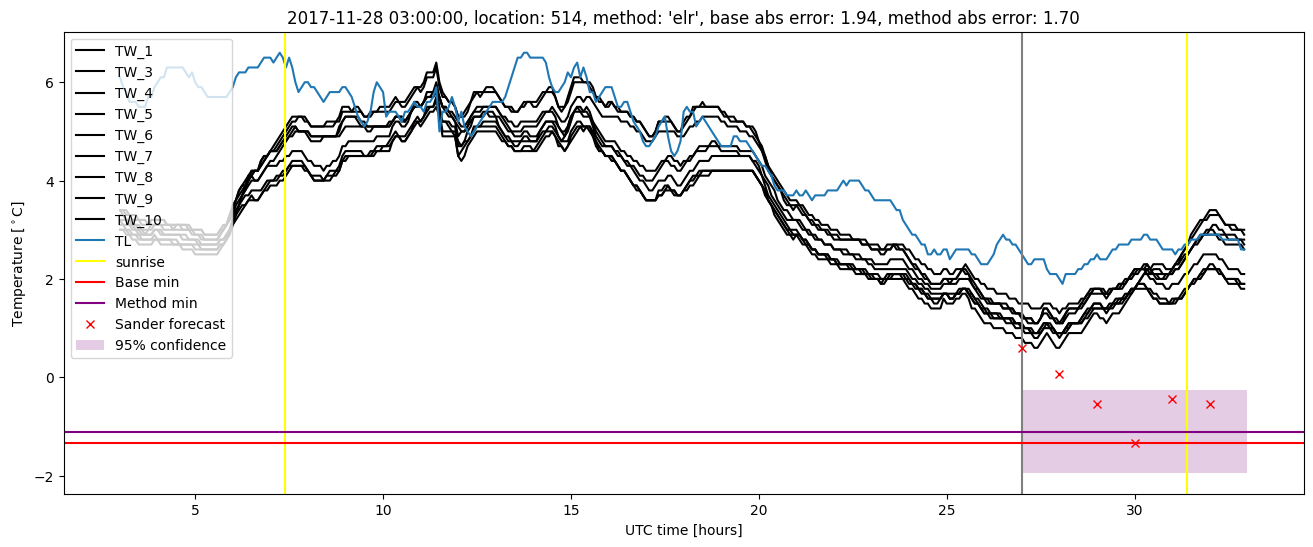
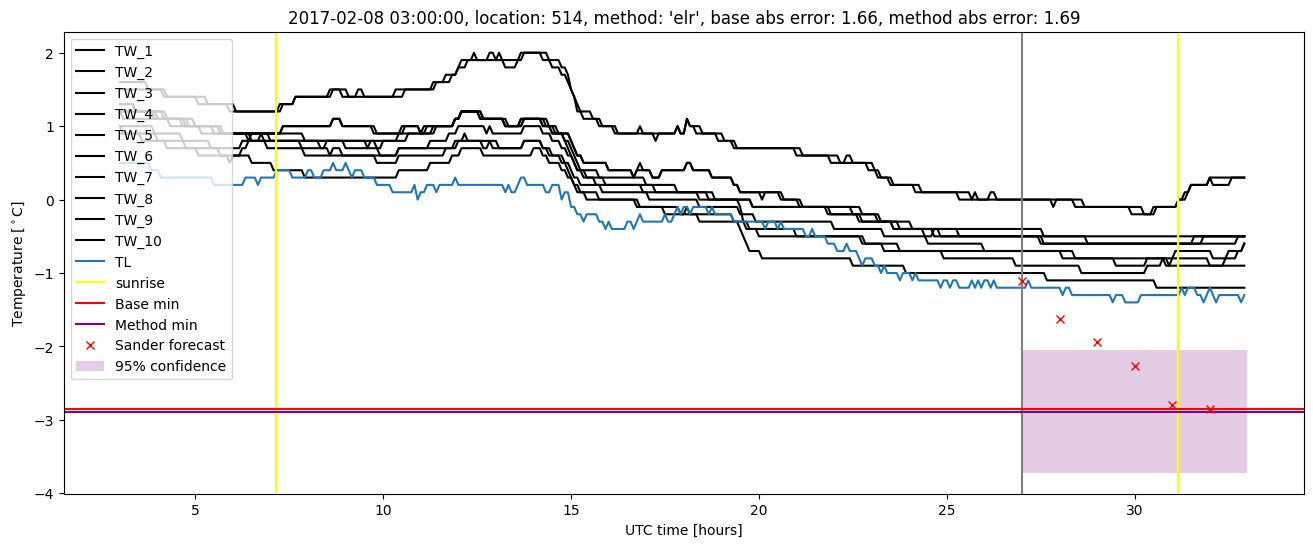
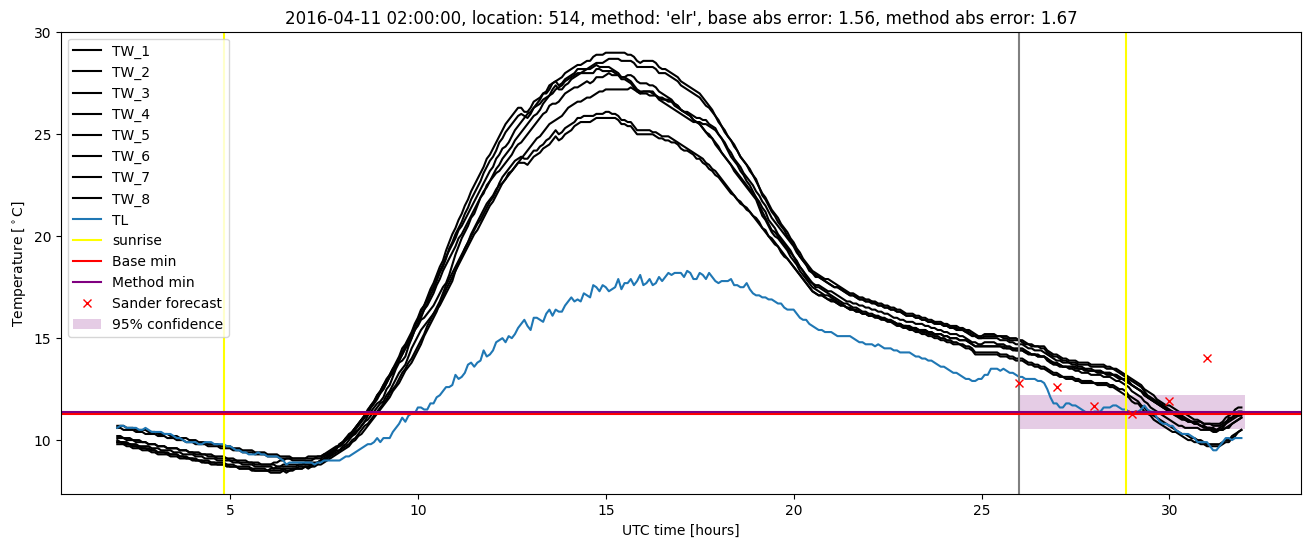
Extended logistic regression results
| names |
period |
power |
significance |
meanSquareError |
absError |
maxError |
CRPS |
IGN |
| baseline |
winter 2016 |
0.989 |
0.048 |
0.303 |
0.423 |
1.563 |
NaN |
NaN |
| elr |
winter 2016 |
0.983 |
0.048 |
0.268 |
0.395 |
1.668 |
0.534 |
5.179 |
| baseline |
winter 2017 |
0.947 |
0.079 |
0.386 |
0.467 |
1.822 |
NaN |
NaN |
| elr |
winter 2017 |
0.956 |
0.079 |
0.325 |
0.439 |
1.686 |
0.546 |
5.326 |
| baseline |
winter 2018 |
0.979 |
0.154 |
0.367 |
0.442 |
2.045 |
NaN |
NaN |
| elr |
winter 2018 |
0.986 |
0.128 |
0.297 |
0.385 |
2.263 |
0.540 |
5.046 |
| baseline |
winter 2019 |
1.000 |
0.000e+00 |
0.245 |
0.379 |
1.598 |
NaN |
NaN |
| elr |
winter 2019 |
1.000 |
0.000e+00 |
0.212 |
0.351 |
1.350 |
0.527 |
4.112 |
| baseline |
all |
0.981 |
0.091 |
0.327 |
0.428 |
2.045 |
NaN |
NaN |
| elr |
all |
0.983 |
0.082 |
0.277 |
0.393 |
2.263 |
0.537 |
4.950 |
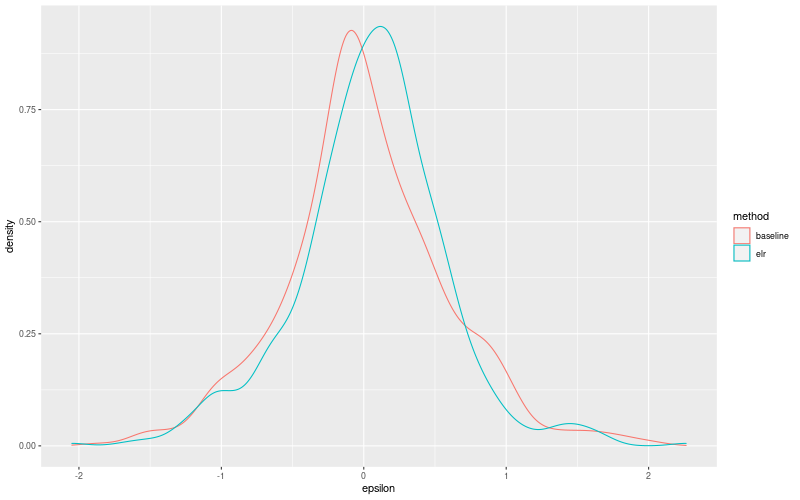
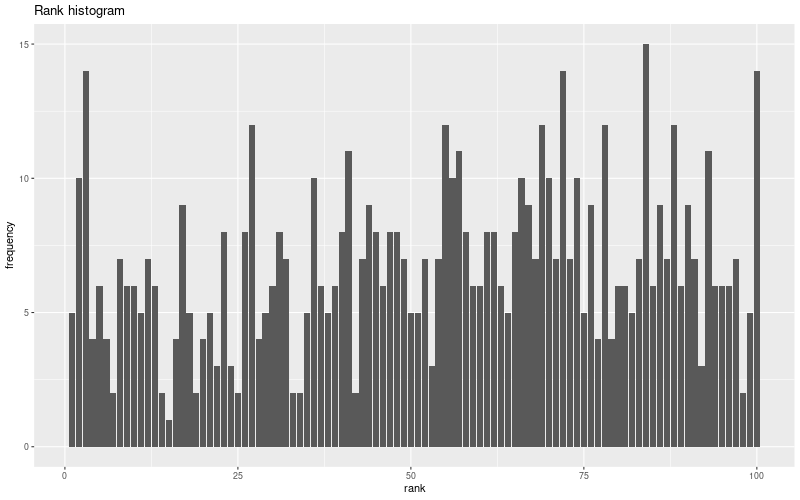
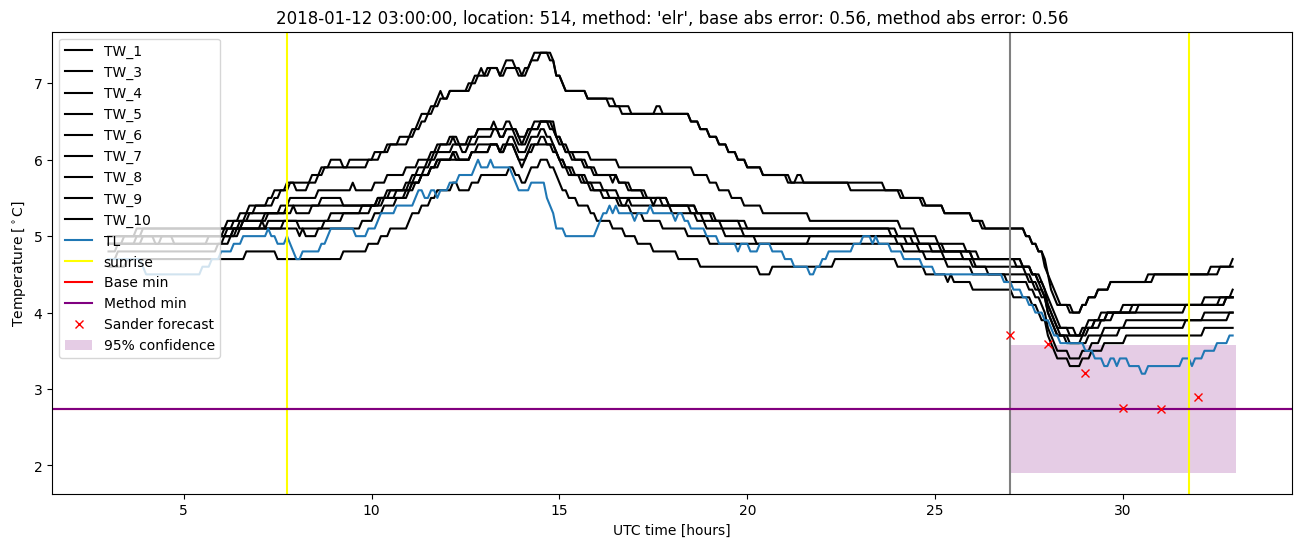
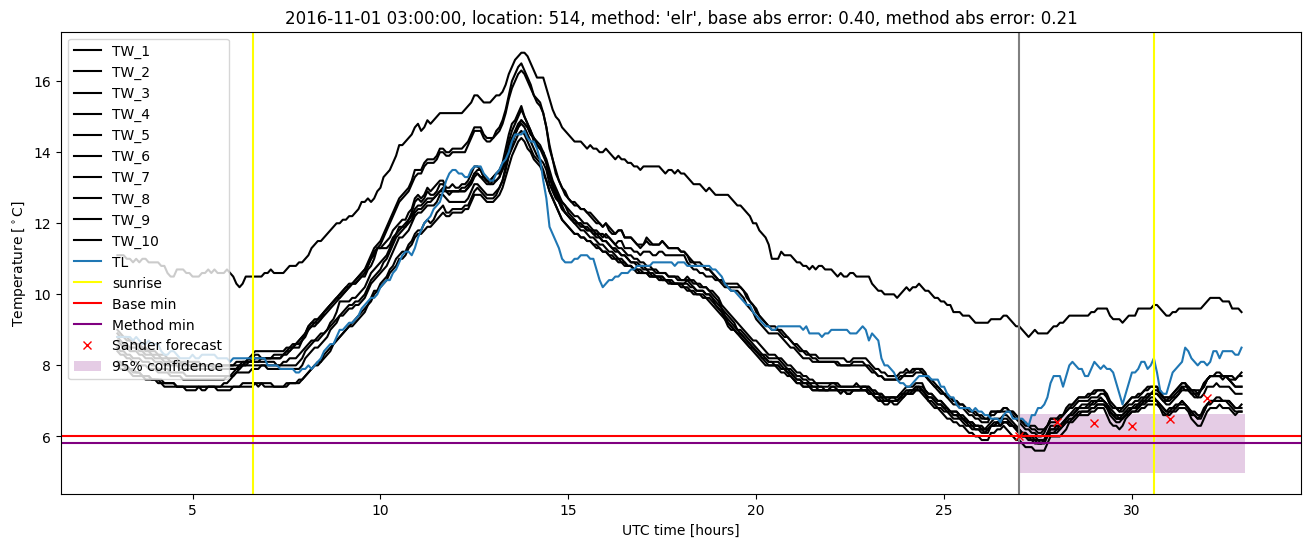
Extended logistic regression plots