GMS location: 513
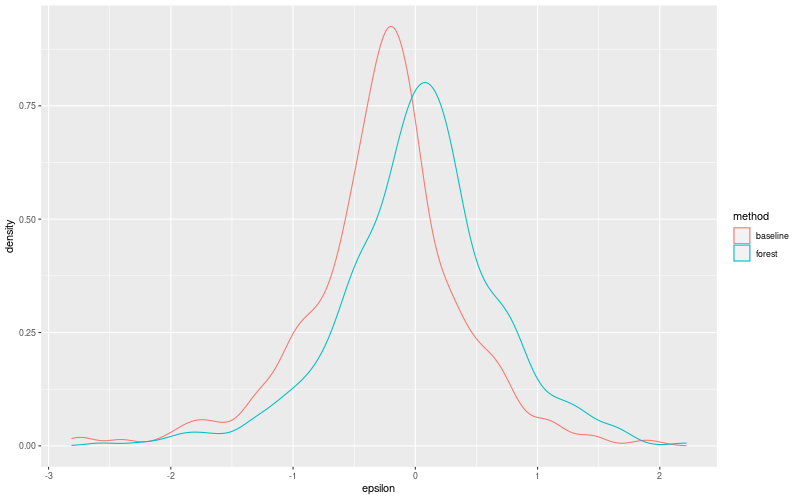
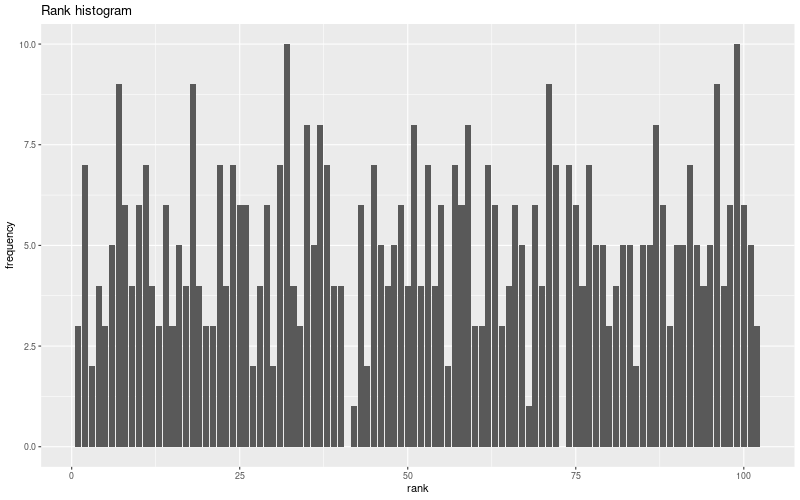
Random forest results
| names |
period |
power |
significance |
meanSquareError |
absError |
maxError |
CRPS |
IGN |
| baseline |
winter 2016 |
0.988 |
0.191 |
0.419 |
0.490 |
2.400 |
NaN |
NaN |
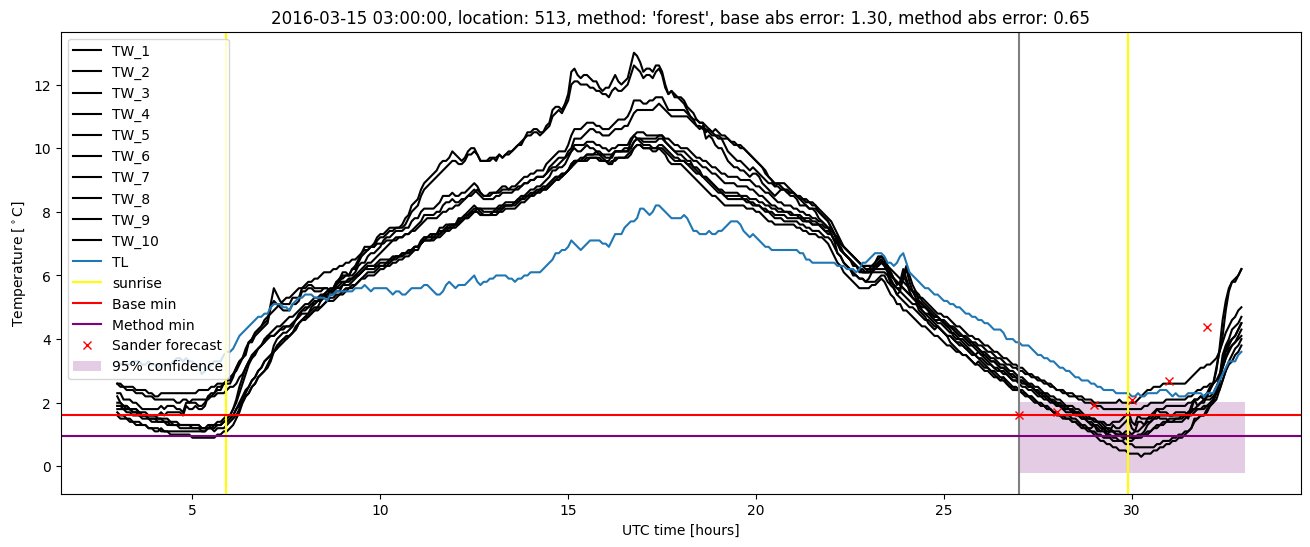
| forest |
winter 2016 |
0.952 |
0.095 |
0.498 |
0.548 |
2.215 |
0.722 |
3.814 |
| baseline |
winter 2017 |
1.000 |
NaN |
0.265 |
0.373 |
0.959 |
NaN |
NaN |
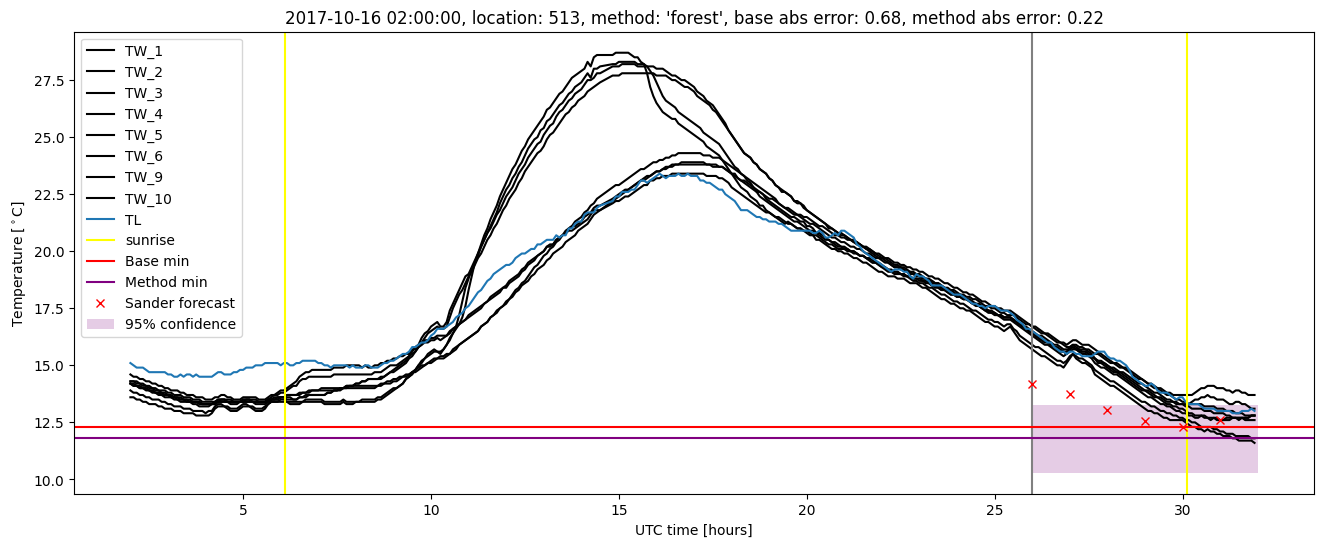
| forest |
winter 2017 |
1.000 |
NaN |
0.229 |
0.433 |
0.787 |
0.625 |
1.771 |
| baseline |
winter 2018 |
1.000 |
0.100 |
0.505 |
0.500 |
2.809 |
NaN |
NaN |
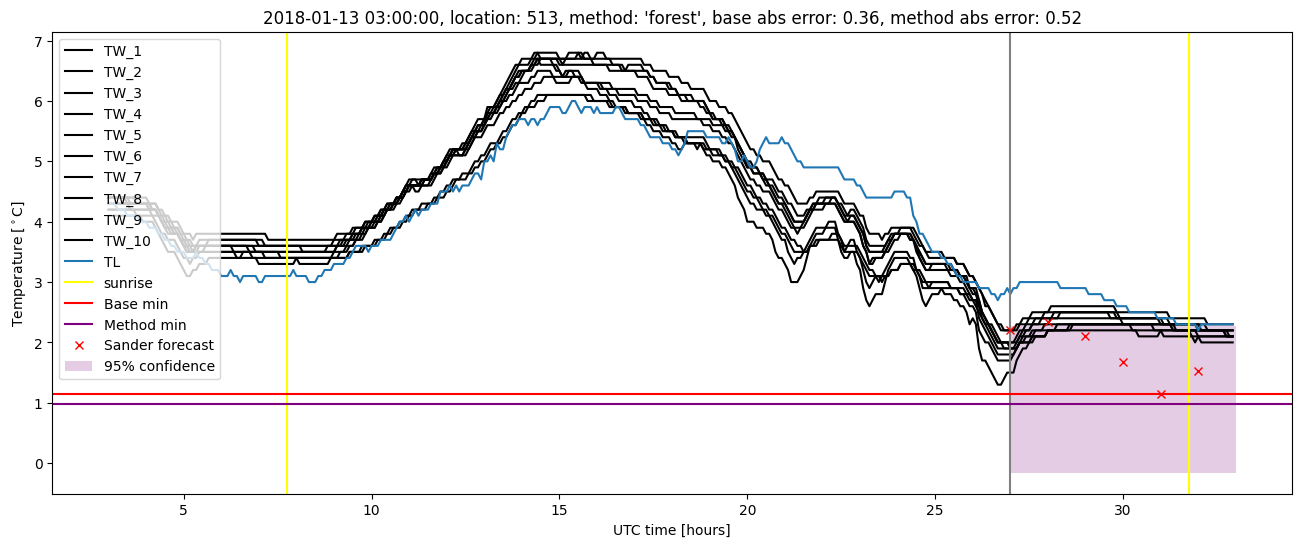
| forest |
winter 2018 |
1.000 |
0.050 |
0.372 |
0.445 |
2.246 |
0.603 |
2.936 |
| baseline |
winter 2019 |
0.993 |
0.333 |
0.503 |
0.529 |
2.730 |
NaN |
NaN |
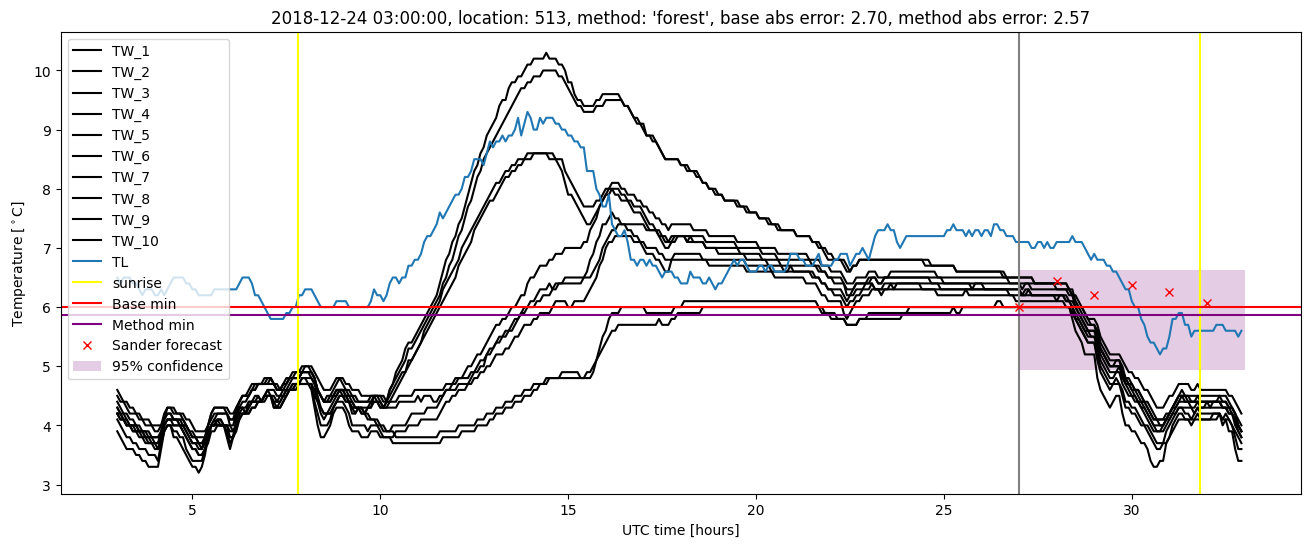
| forest |
winter 2019 |
0.985 |
0.333 |
0.349 |
0.420 |
2.572 |
0.620 |
3.393 |
| baseline |
all |
0.993 |
0.183 |
0.471 |
0.504 |
2.809 |
NaN |
NaN |
| forest |
all |
0.977 |
0.134 |
0.409 |
0.475 |
2.572 |
0.651 |
3.381 |
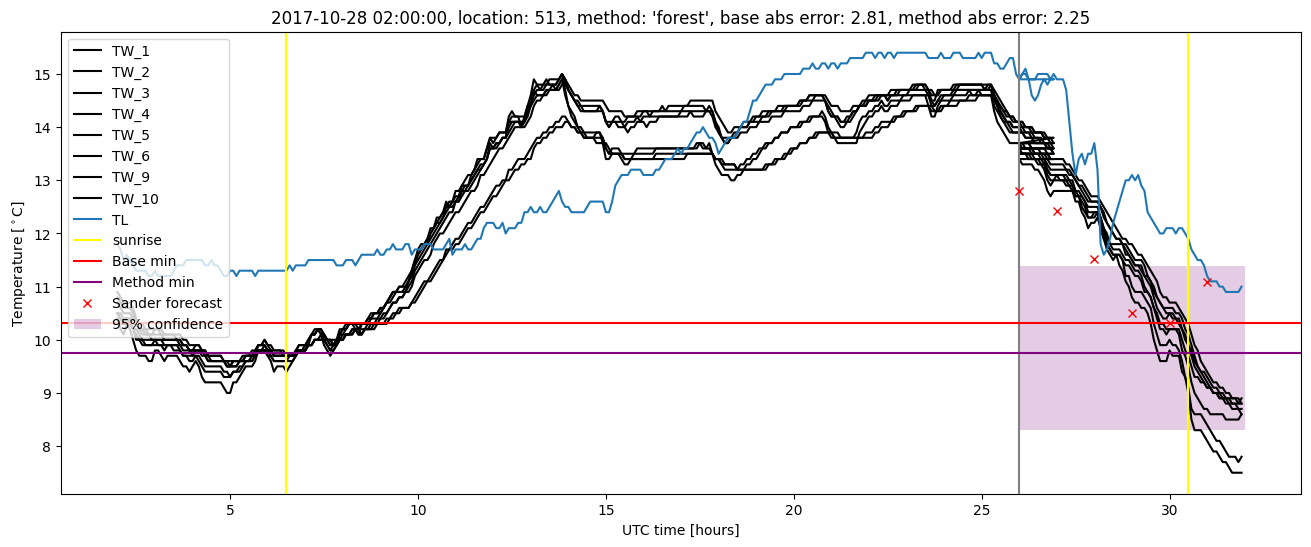
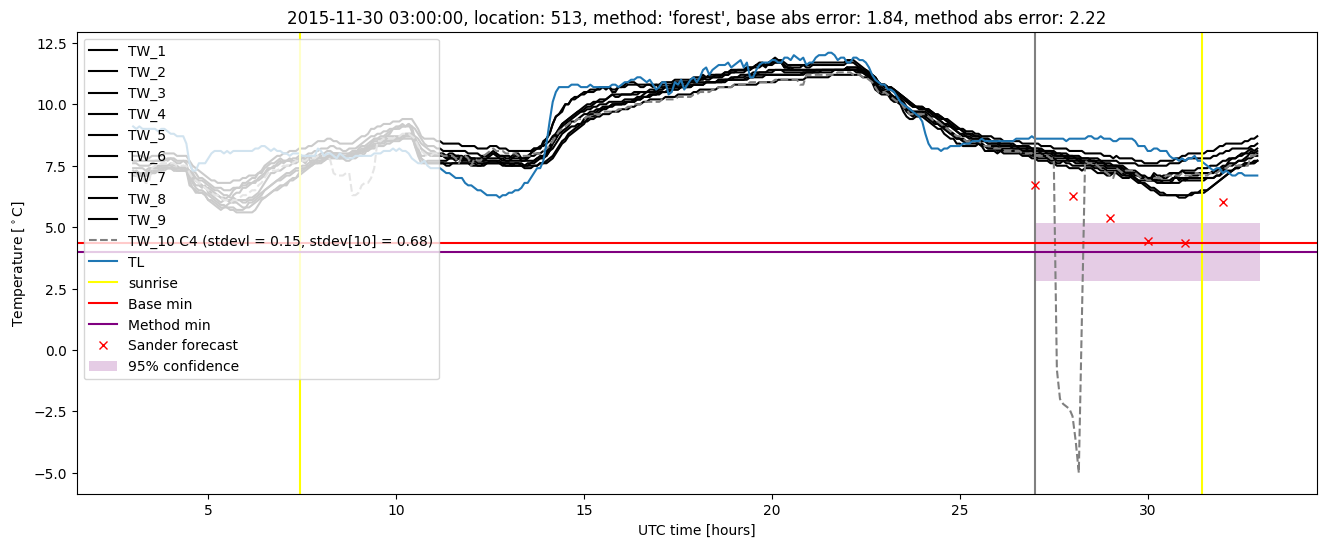
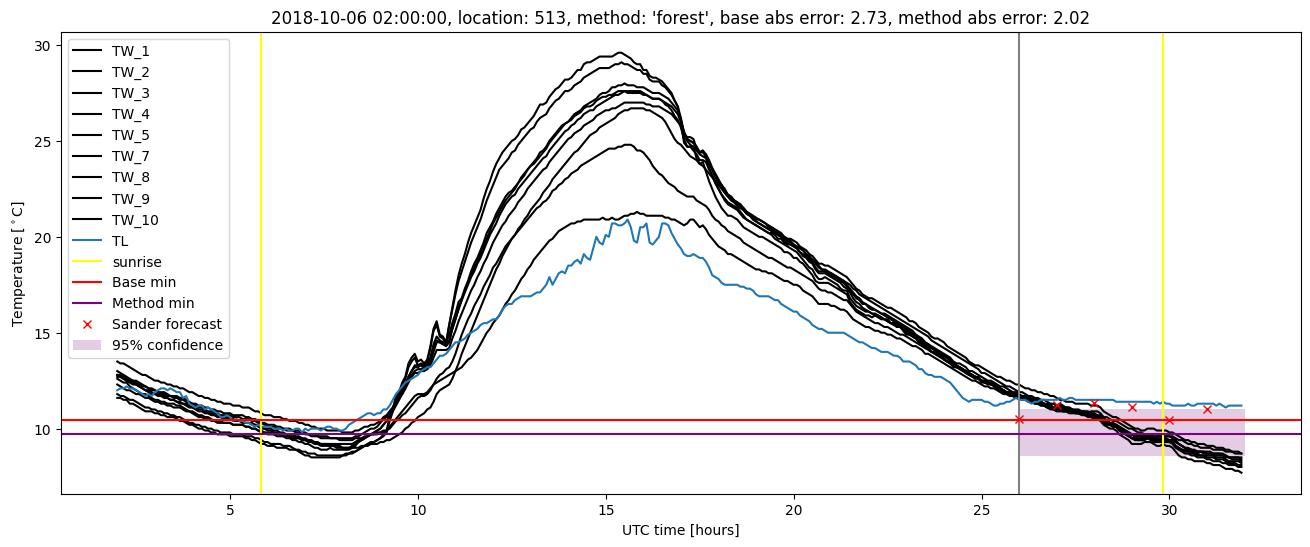
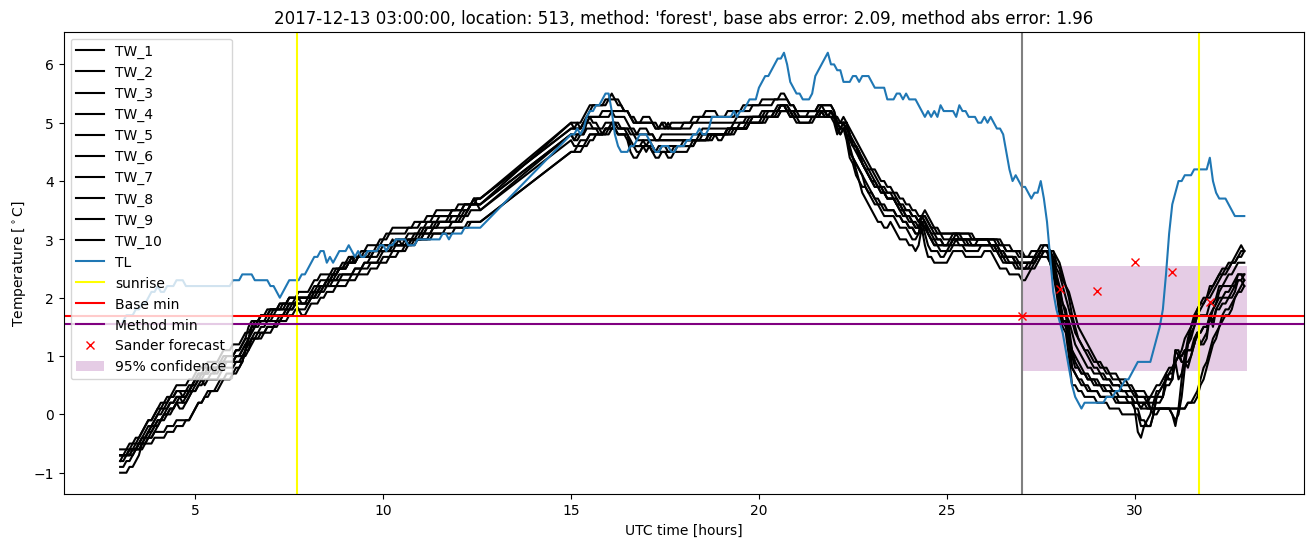
Random forest plots
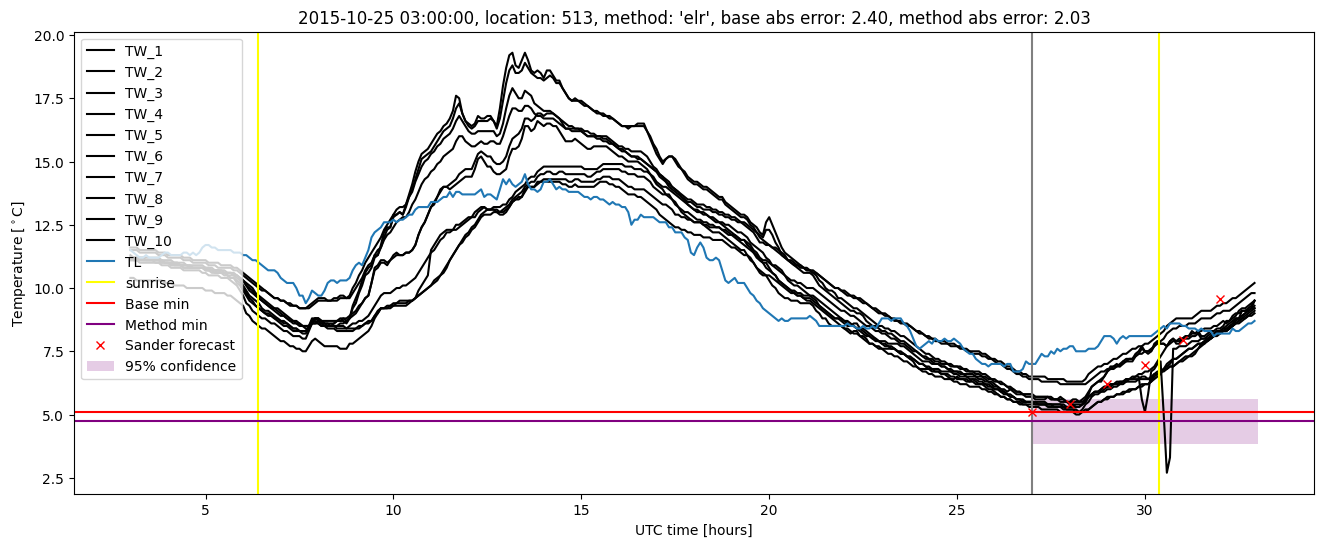
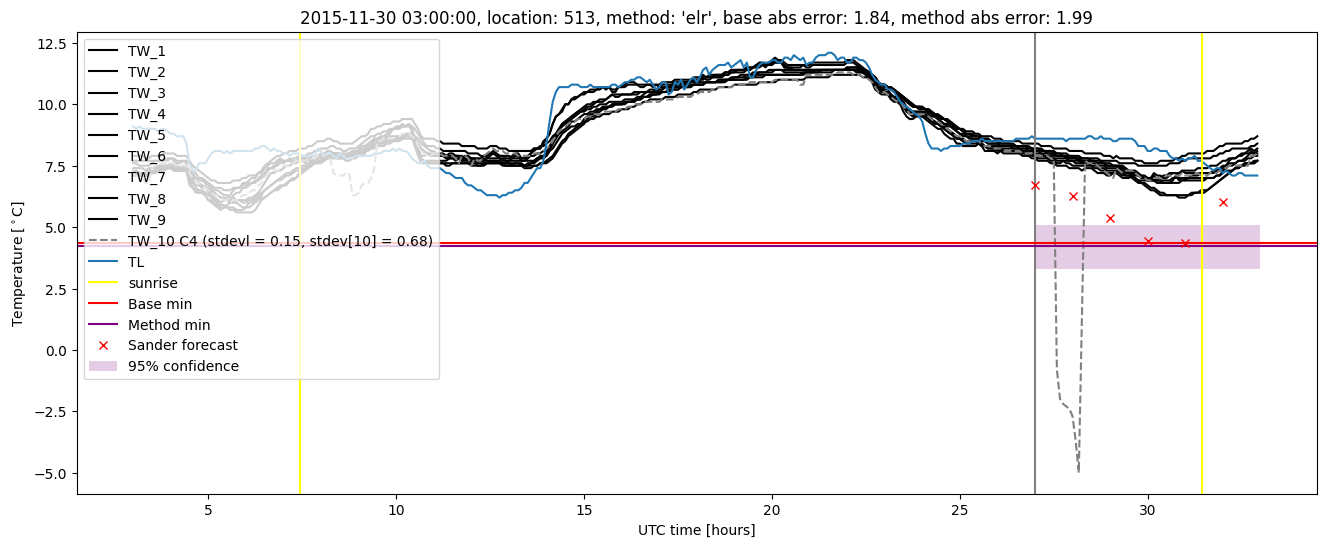
Extended logistic regression results
| names |
period |
power |
significance |
meanSquareError |
absError |
maxError |
CRPS |
IGN |
| baseline |
winter 2016 |
0.988 |
0.191 |
0.419 |
0.490 |
2.400 |
NaN |
NaN |
| elr |
winter 2016 |
0.958 |
0.048 |
0.531 |
0.574 |
2.028 |
0.831 |
8.022 |
| baseline |
winter 2017 |
1.000 |
NaN |
0.265 |
0.373 |
0.959 |
NaN |
NaN |
| elr |
winter 2017 |
1.000 |
NaN |
0.342 |
0.498 |
0.975 |
0.726 |
5.595 |
| baseline |
winter 2018 |
1.000 |
0.100 |
0.505 |
0.500 |
2.809 |
NaN |
NaN |
| elr |
winter 2018 |
1.000 |
0.050 |
0.357 |
0.431 |
2.243 |
0.689 |
5.581 |
| baseline |
winter 2019 |
0.993 |
0.333 |
0.503 |
0.529 |
2.730 |
NaN |
NaN |
| elr |
winter 2019 |
0.985 |
0.286 |
0.366 |
0.436 |
2.481 |
0.698 |
5.282 |
| baseline |
all |
0.993 |
0.183 |
0.471 |
0.504 |
2.809 |
NaN |
NaN |
| elr |
all |
0.979 |
0.110 |
0.423 |
0.485 |
2.481 |
0.743 |
6.380 |
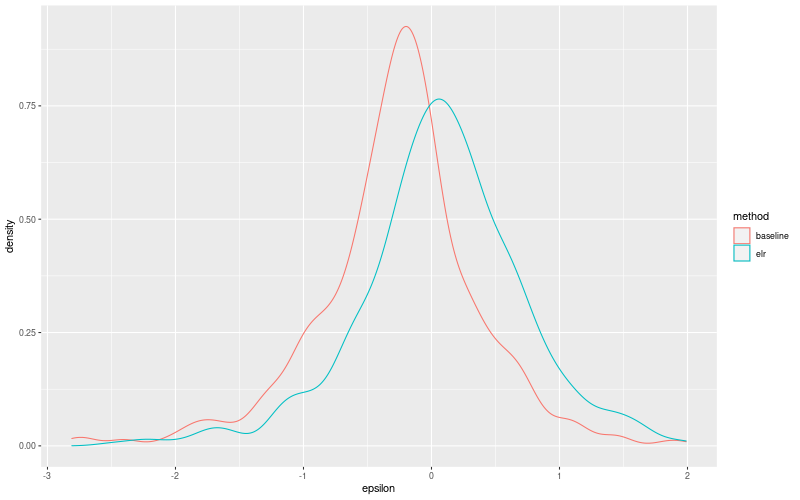
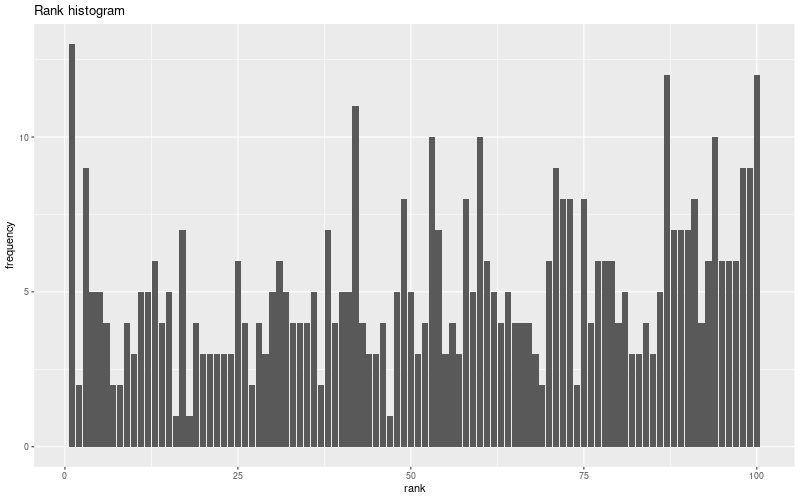
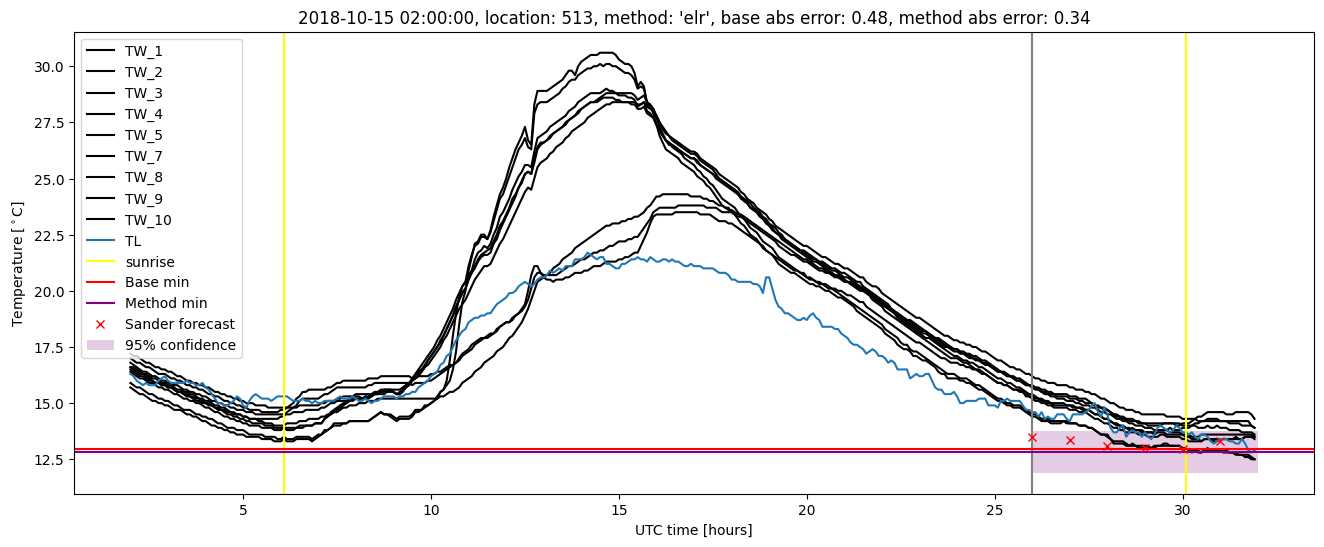
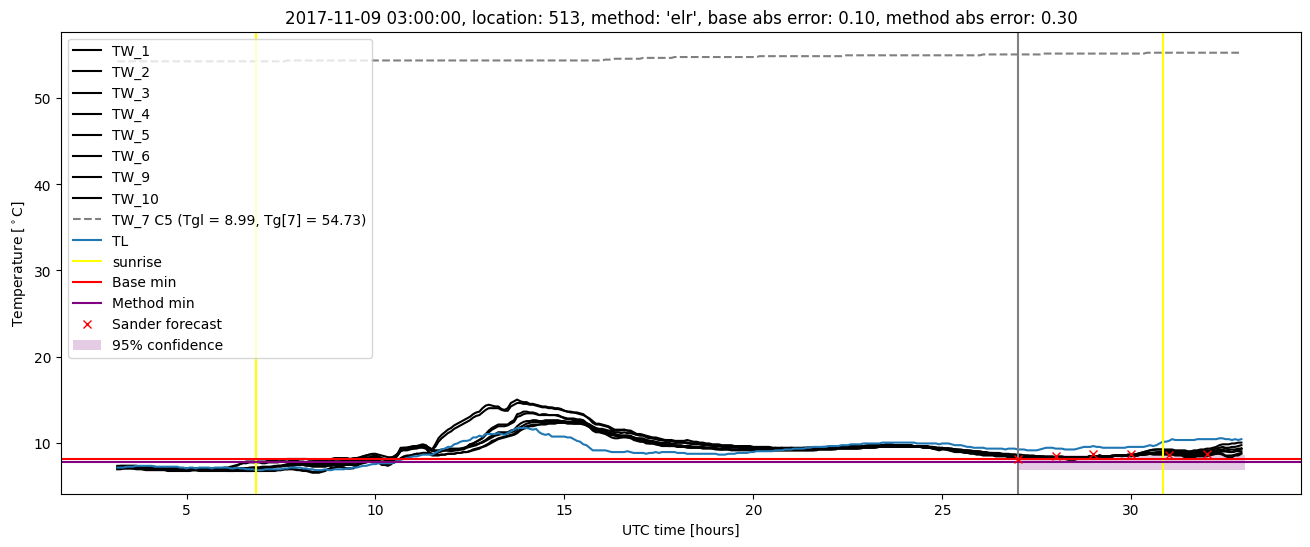
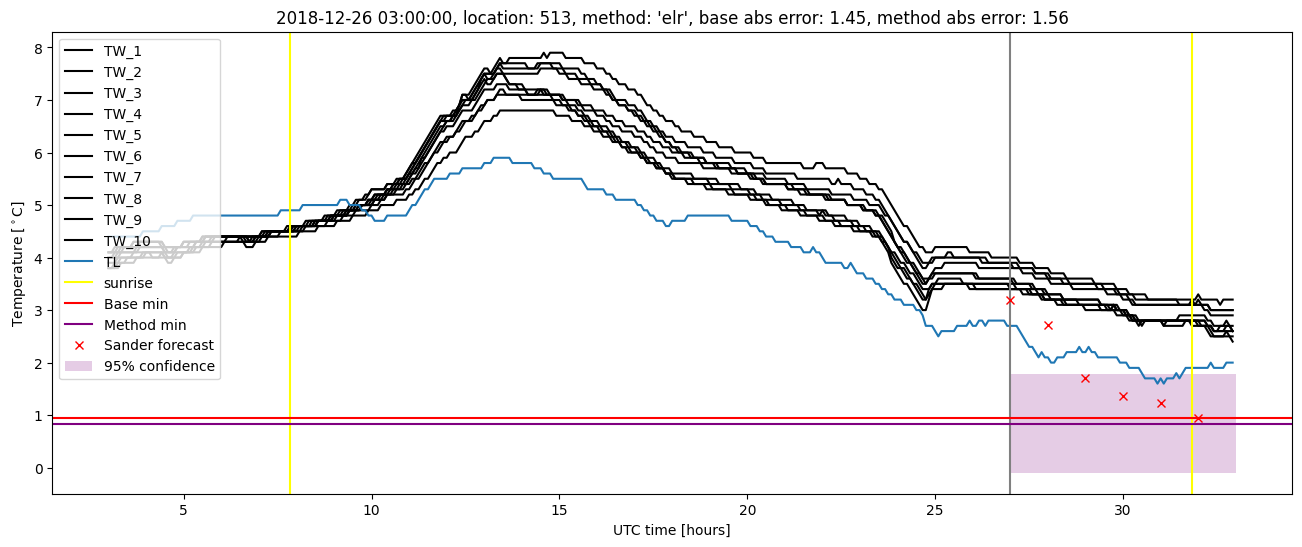
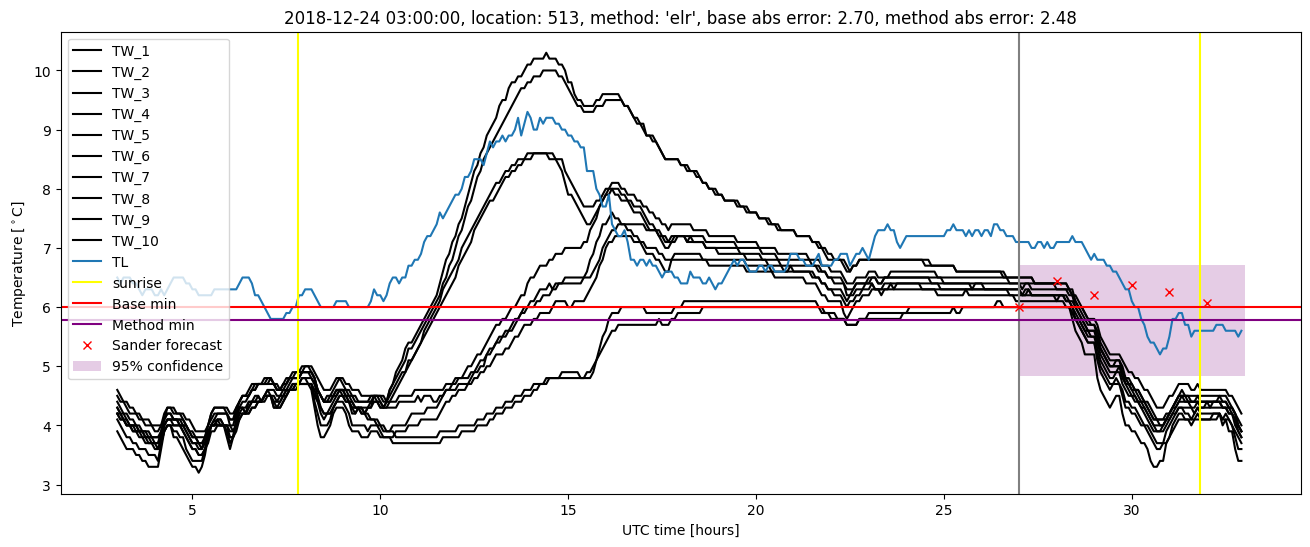
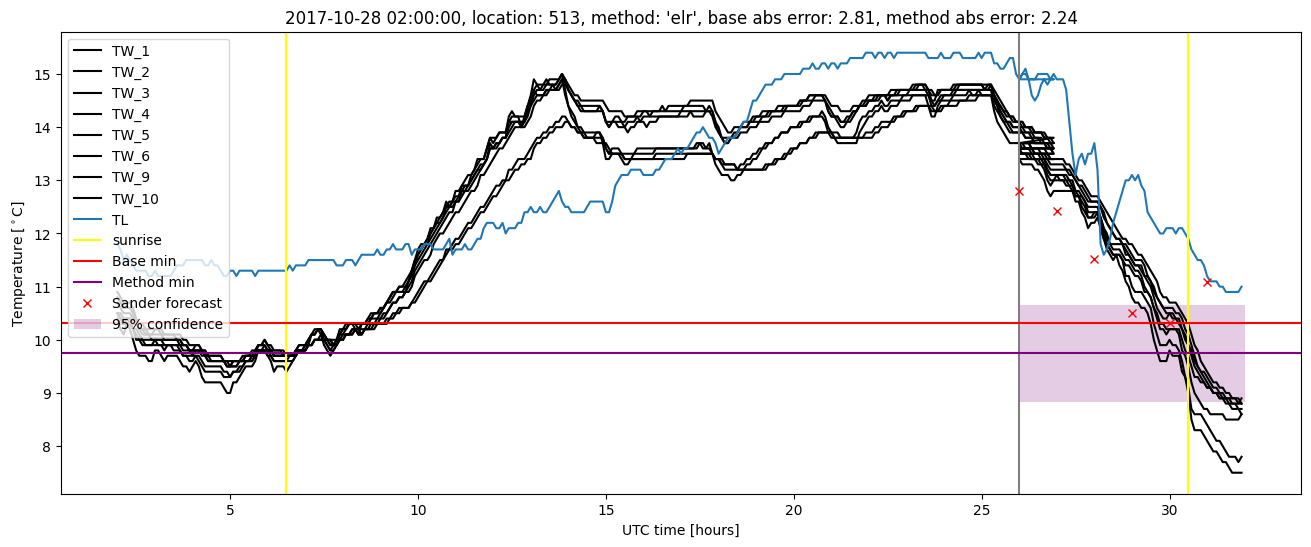
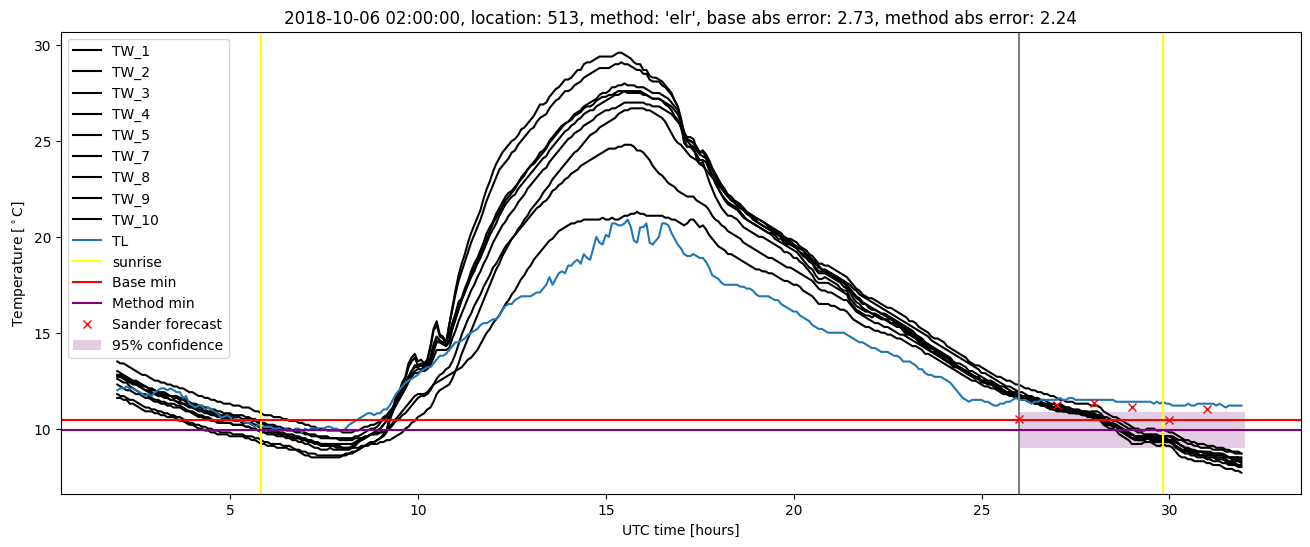
Extended logistic regression plots