GMS location: 512
Random forest results
| names |
period |
power |
significance |
meanSquareError |
absError |
maxError |
CRPS |
IGN |
| baseline |
winter 2016 |
0.983 |
0.000e+00 |
0.379 |
0.477 |
2.294 |
NaN |
NaN |
| forest |
winter 2016 |
0.994 |
0.062 |
0.250 |
0.372 |
2.207 |
0.459 |
4.931 |
| baseline |
winter 2017 |
0.984 |
0.103 |
0.457 |
0.513 |
2.030 |
NaN |
NaN |
| forest |
winter 2017 |
1.000 |
0.103 |
0.254 |
0.379 |
1.534 |
0.443 |
4.267 |
| baseline |
winter 2018 |
0.993 |
0.115 |
0.322 |
0.432 |
1.889 |
NaN |
NaN |
| forest |
winter 2018 |
0.993 |
0.154 |
0.230 |
0.353 |
1.778 |
0.447 |
3.869 |
| baseline |
winter 2019 |
0.985 |
0.000e+00 |
0.281 |
0.391 |
1.500 |
NaN |
NaN |
| forest |
winter 2019 |
0.993 |
0.000e+00 |
0.246 |
0.377 |
1.608 |
0.441 |
3.864 |
| baseline |
all |
0.986 |
0.074 |
0.361 |
0.455 |
2.294 |
NaN |
NaN |
| forest |
all |
0.995 |
0.099 |
0.245 |
0.370 |
2.207 |
0.448 |
4.265 |
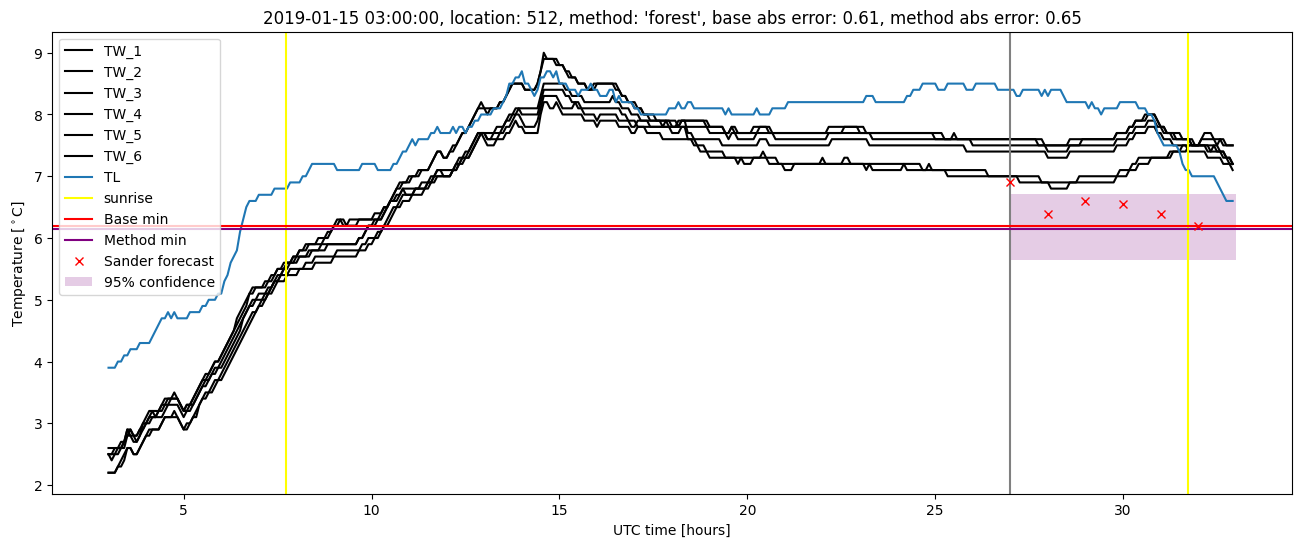
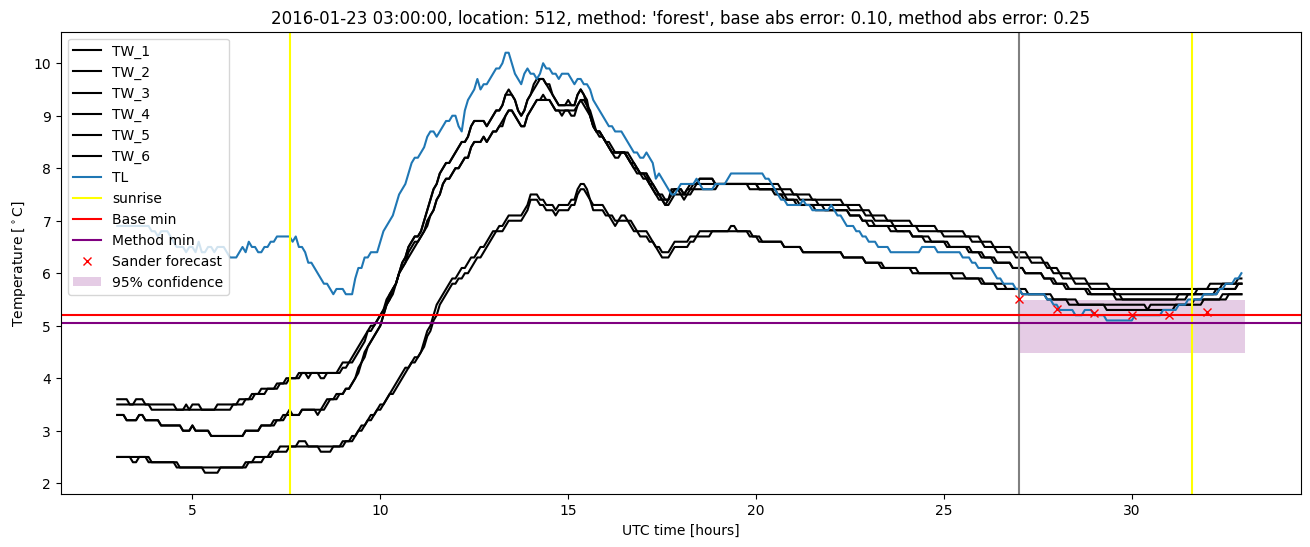
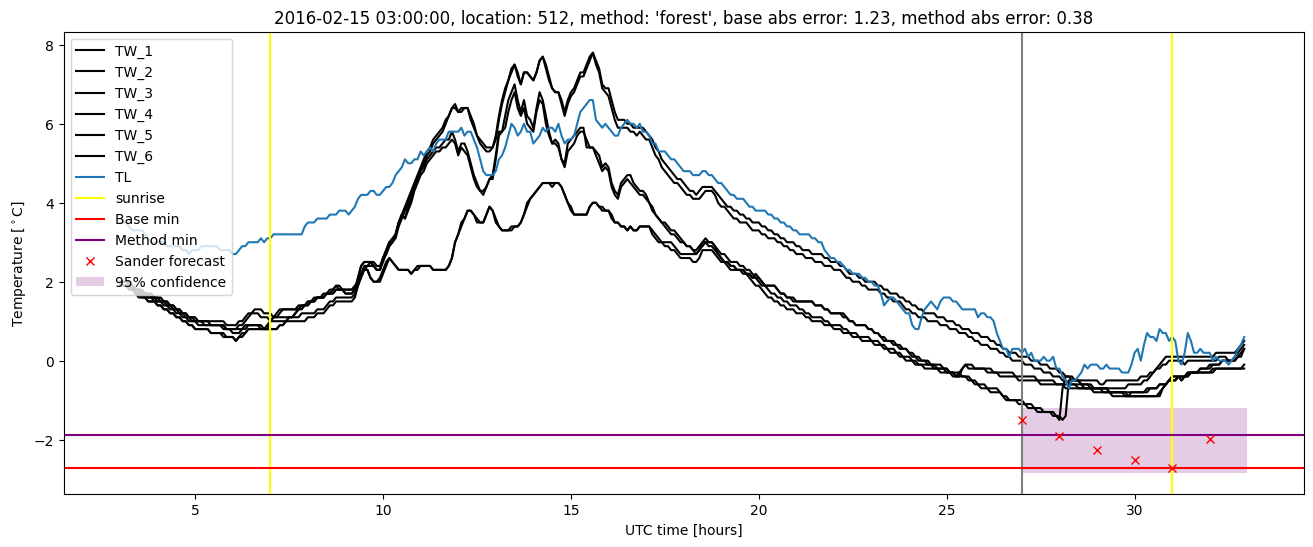
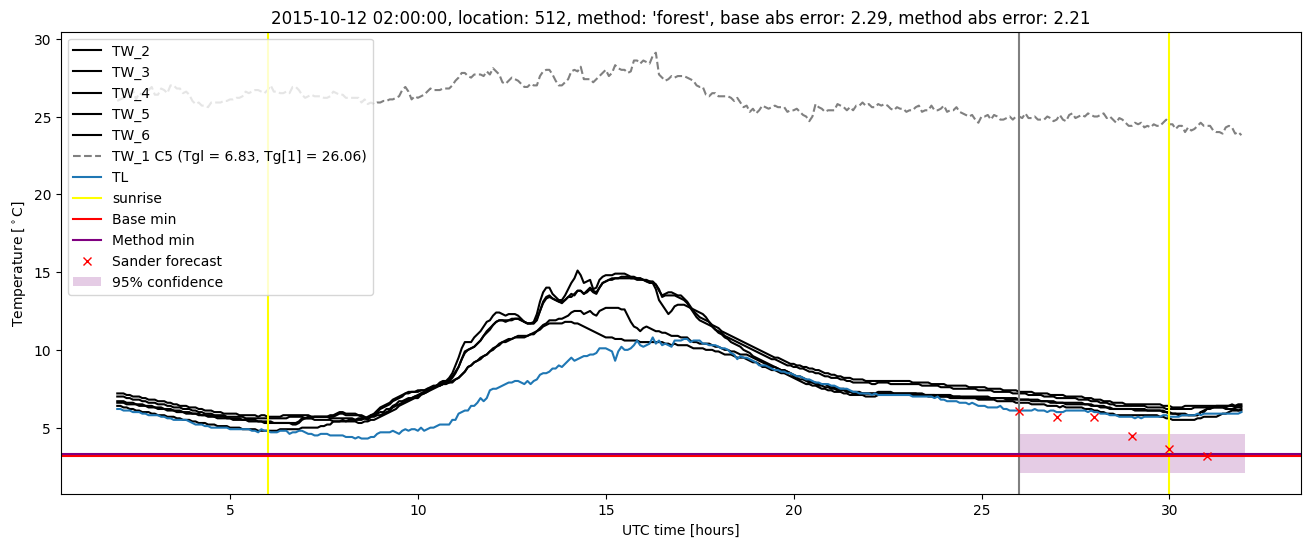
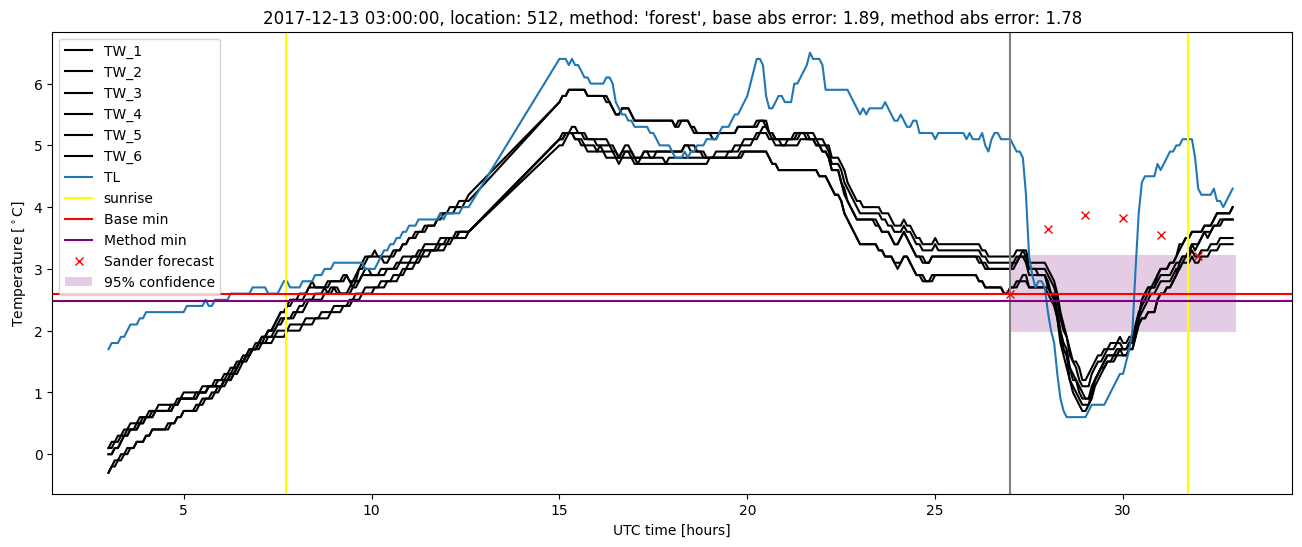
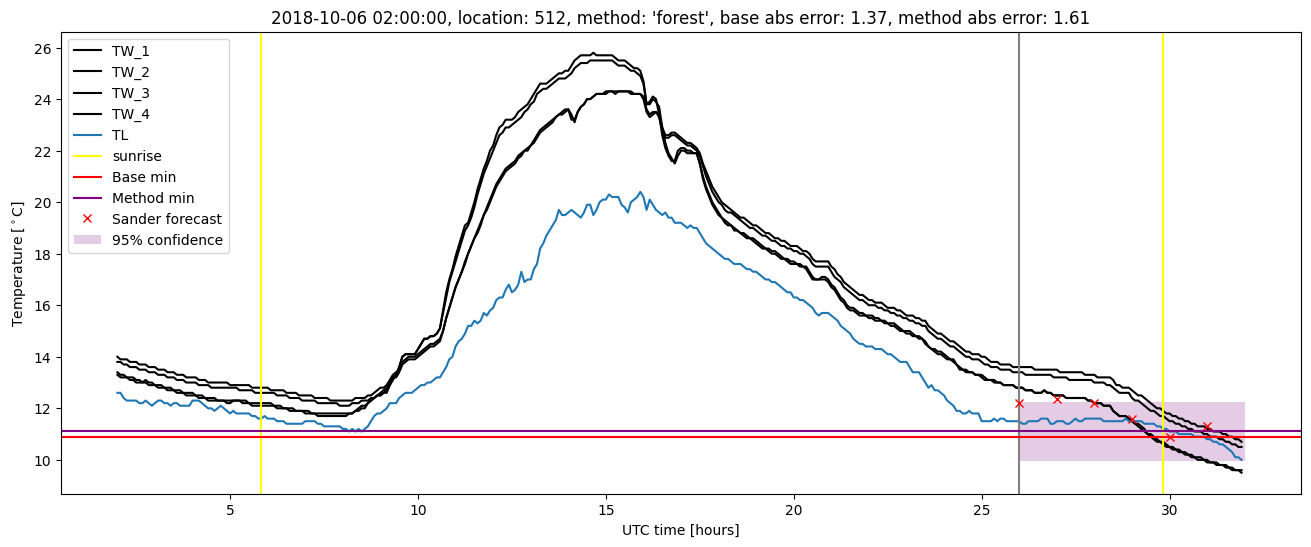
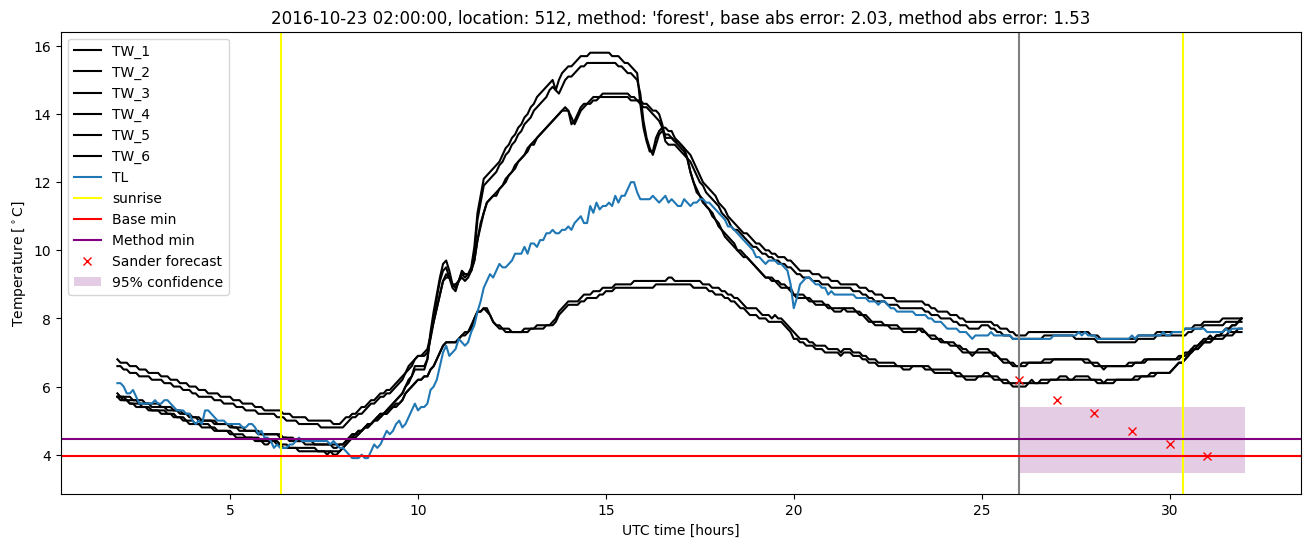
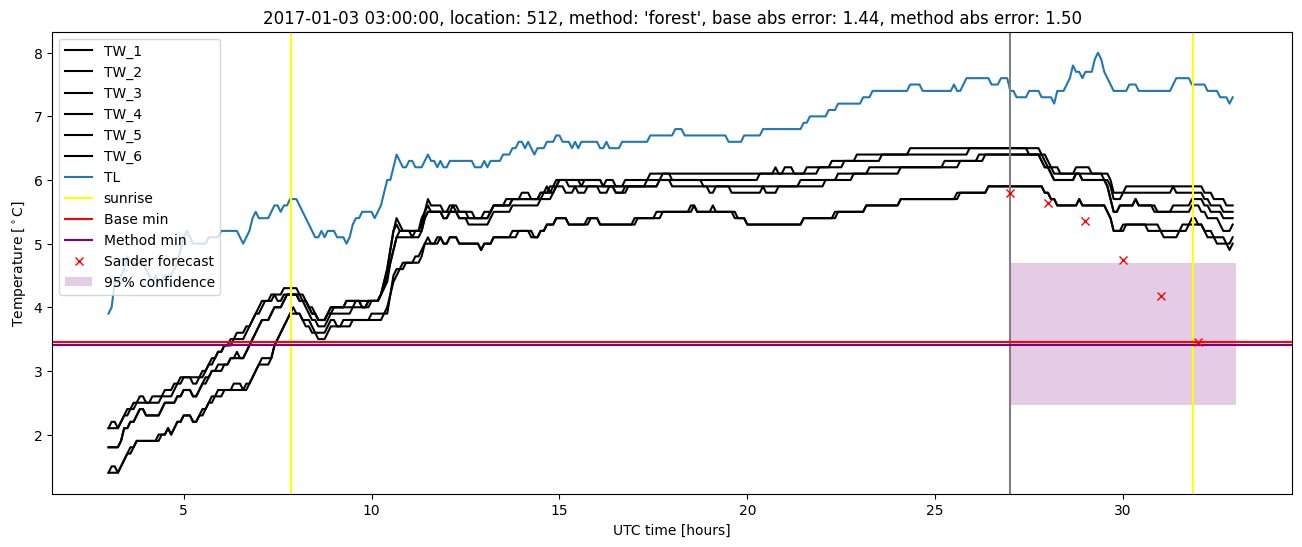
Random forest plots
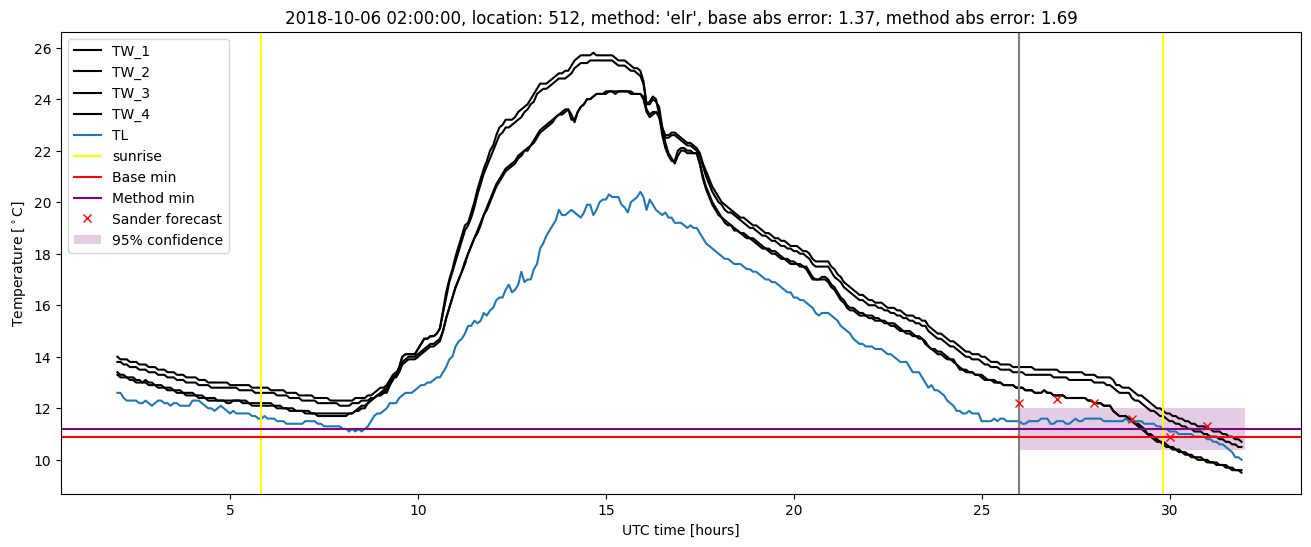
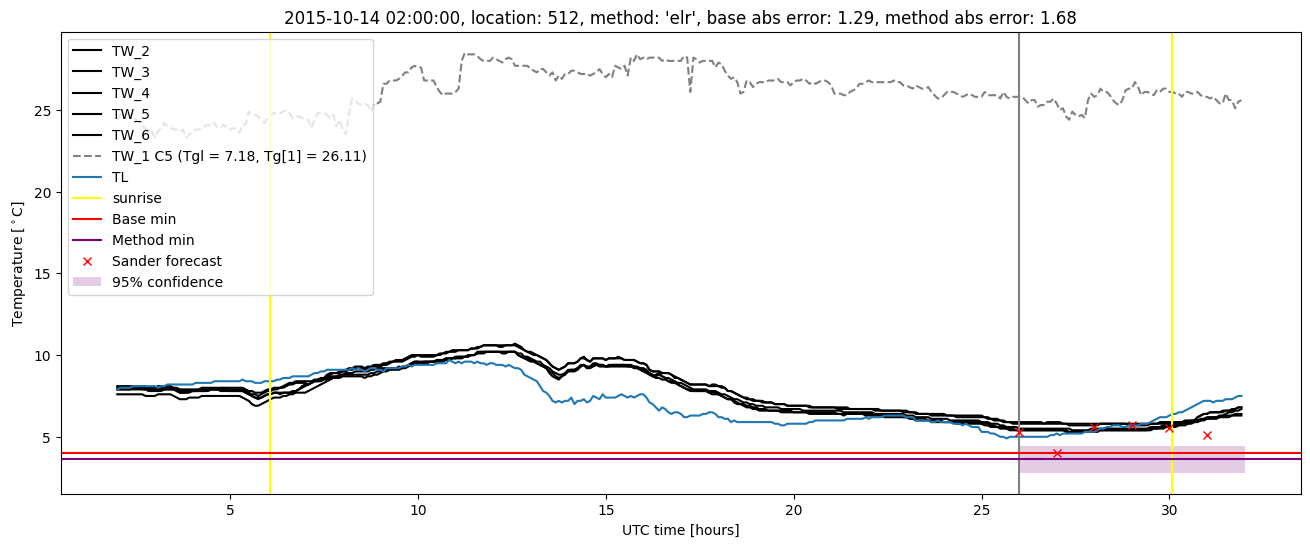
Extended logistic regression results
| names |
period |
power |
significance |
meanSquareError |
absError |
maxError |
CRPS |
IGN |
| baseline |
winter 2016 |
0.983 |
0.000e+00 |
0.379 |
0.477 |
2.294 |
NaN |
NaN |
| elr |
winter 2016 |
0.989 |
0.062 |
0.302 |
0.422 |
2.052 |
0.515 |
5.194 |
| baseline |
winter 2017 |
0.984 |
0.103 |
0.457 |
0.513 |
2.030 |
NaN |
NaN |
| elr |
winter 2017 |
1.000 |
0.103 |
0.299 |
0.422 |
1.617 |
0.496 |
4.608 |
| baseline |
winter 2018 |
0.993 |
0.115 |
0.322 |
0.432 |
1.889 |
NaN |
NaN |
| elr |
winter 2018 |
0.993 |
0.154 |
0.296 |
0.418 |
1.884 |
0.530 |
5.164 |
| baseline |
winter 2019 |
0.985 |
0.000e+00 |
0.281 |
0.391 |
1.500 |
NaN |
NaN |
| elr |
winter 2019 |
0.993 |
0.000e+00 |
0.260 |
0.379 |
1.687 |
0.506 |
4.645 |
| baseline |
all |
0.986 |
0.074 |
0.361 |
0.455 |
2.294 |
NaN |
NaN |
| elr |
all |
0.993 |
0.099 |
0.291 |
0.411 |
2.052 |
0.513 |
4.931 |
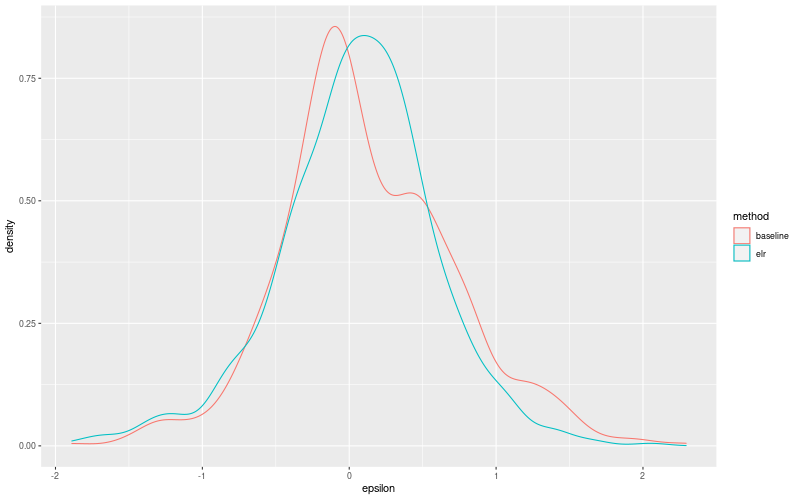
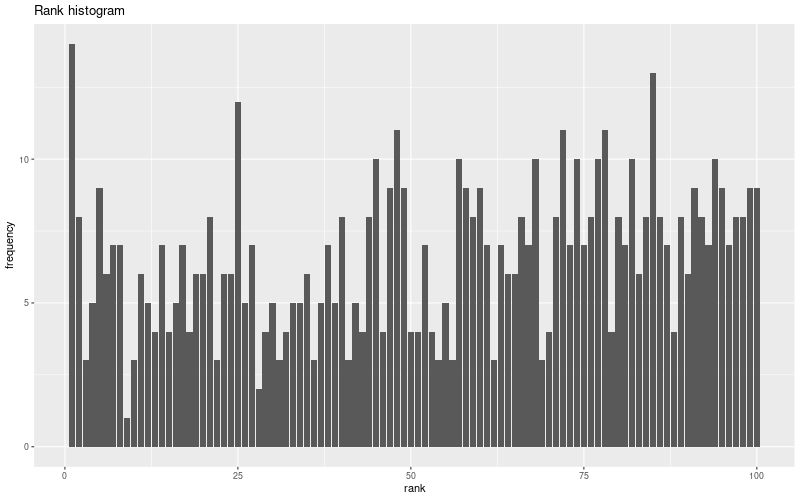
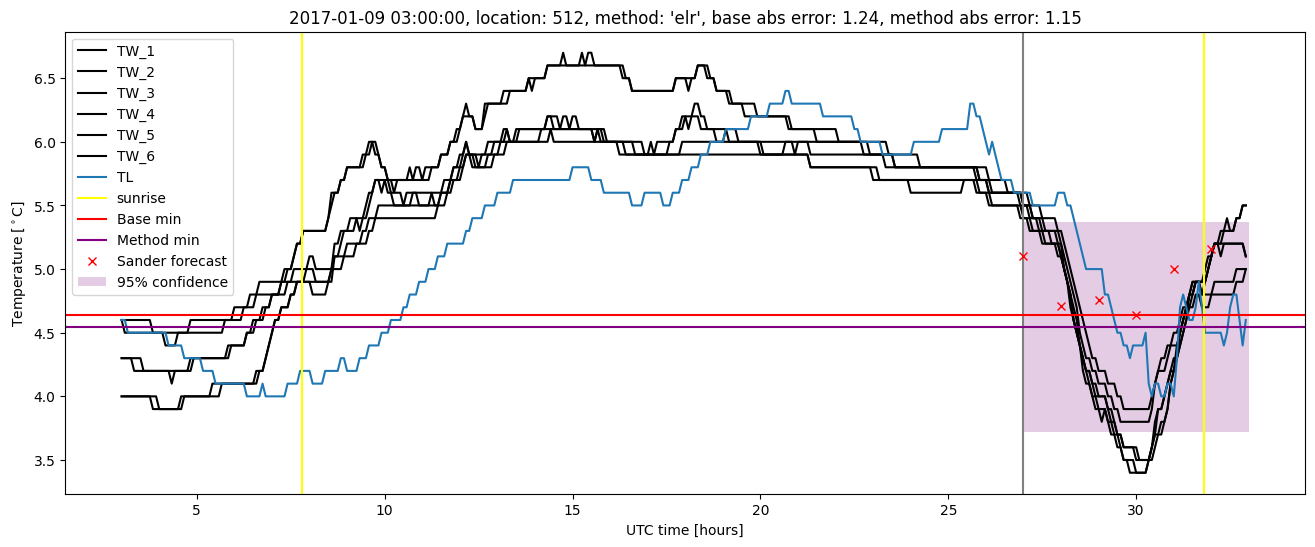
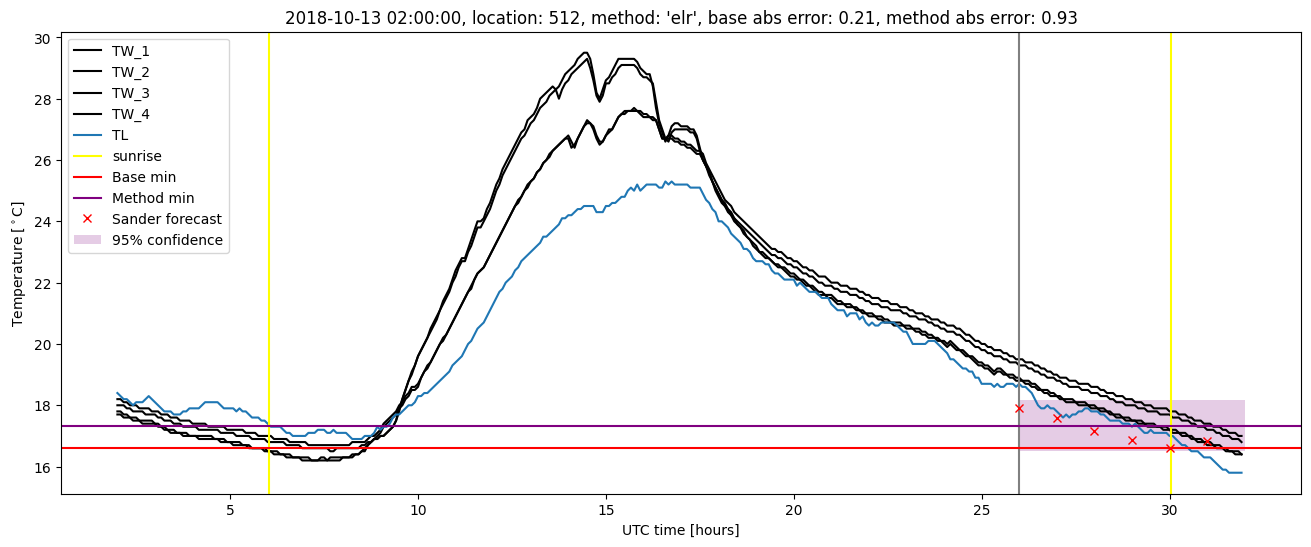
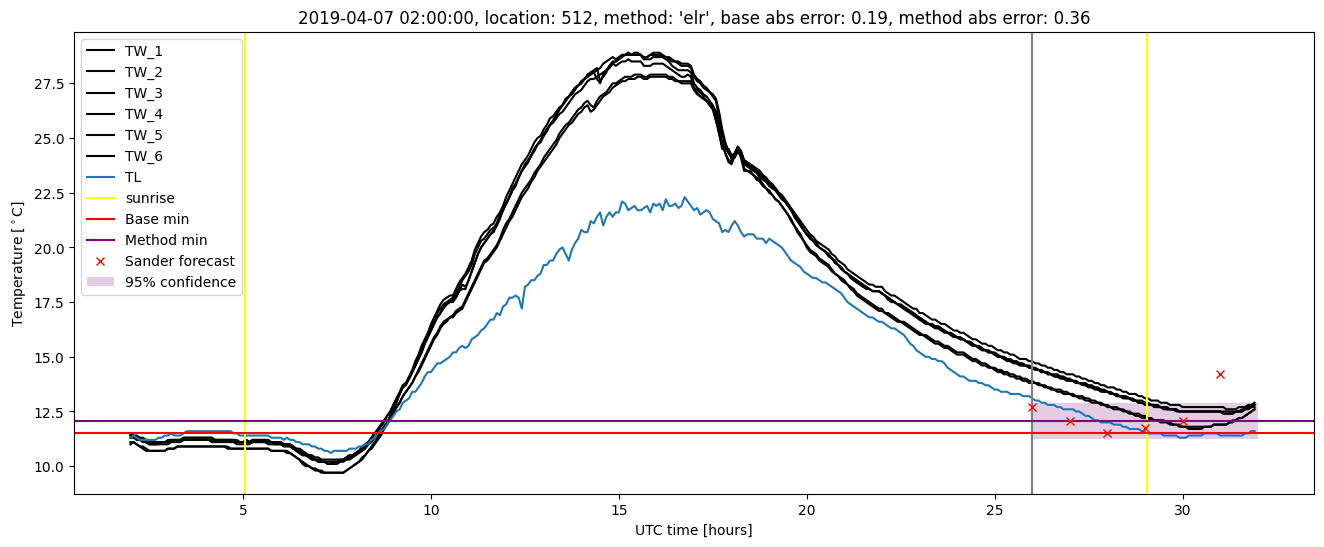
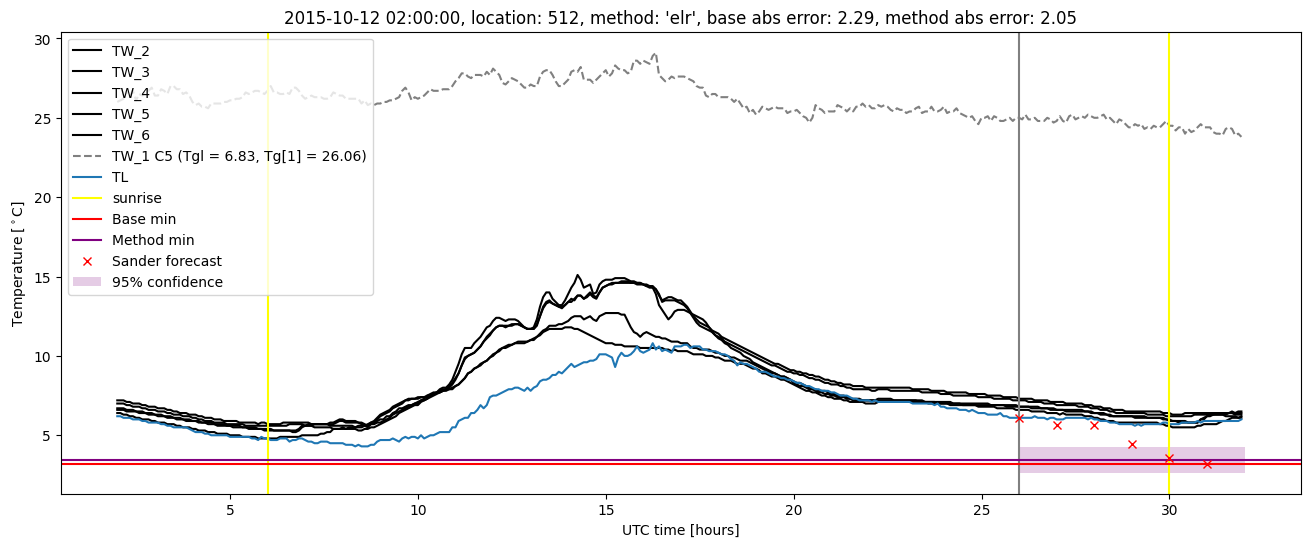
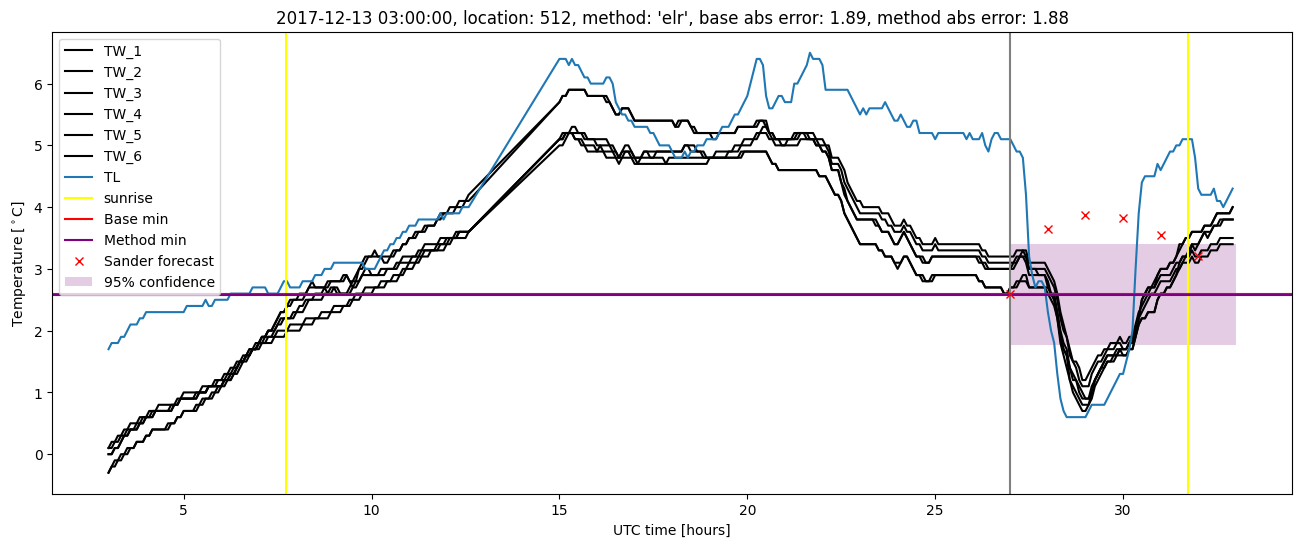
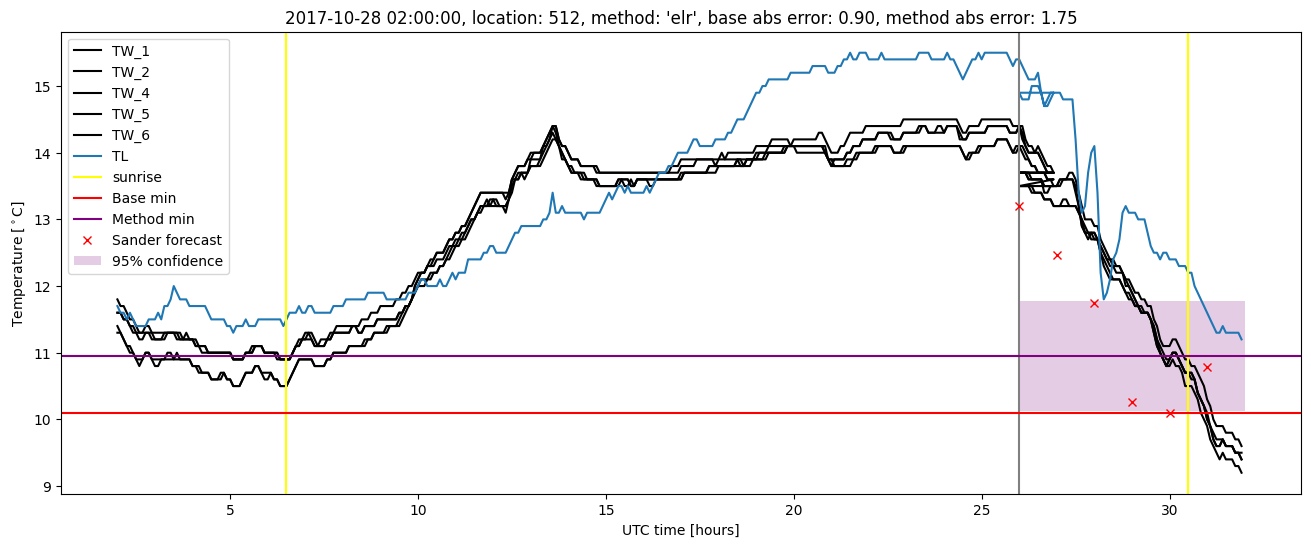
Extended logistic regression plots