GMS location: 511
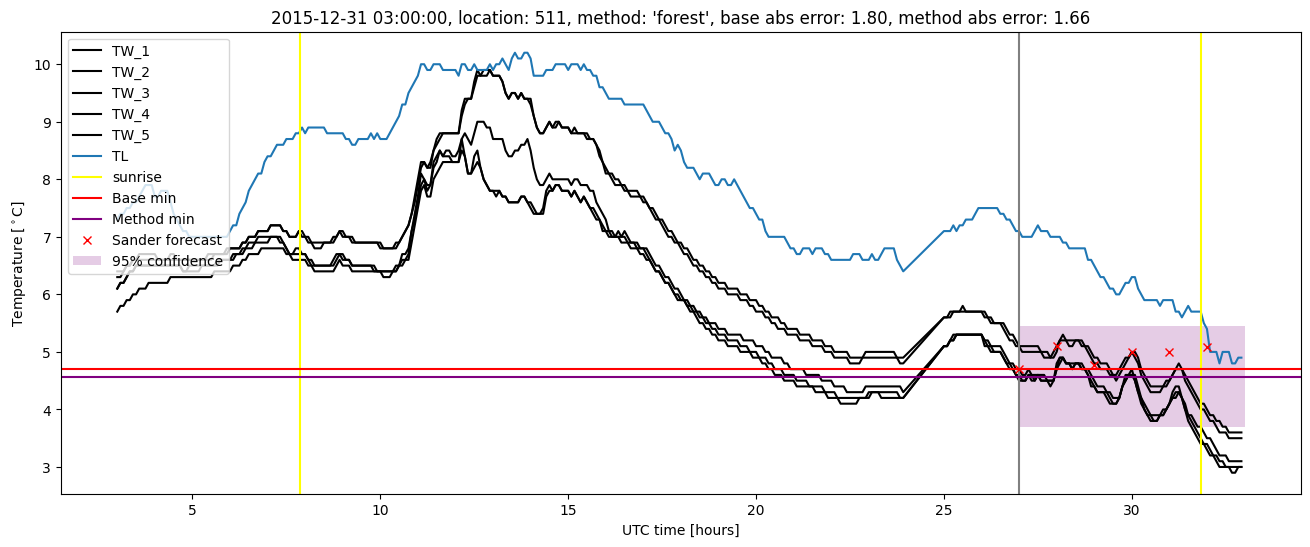
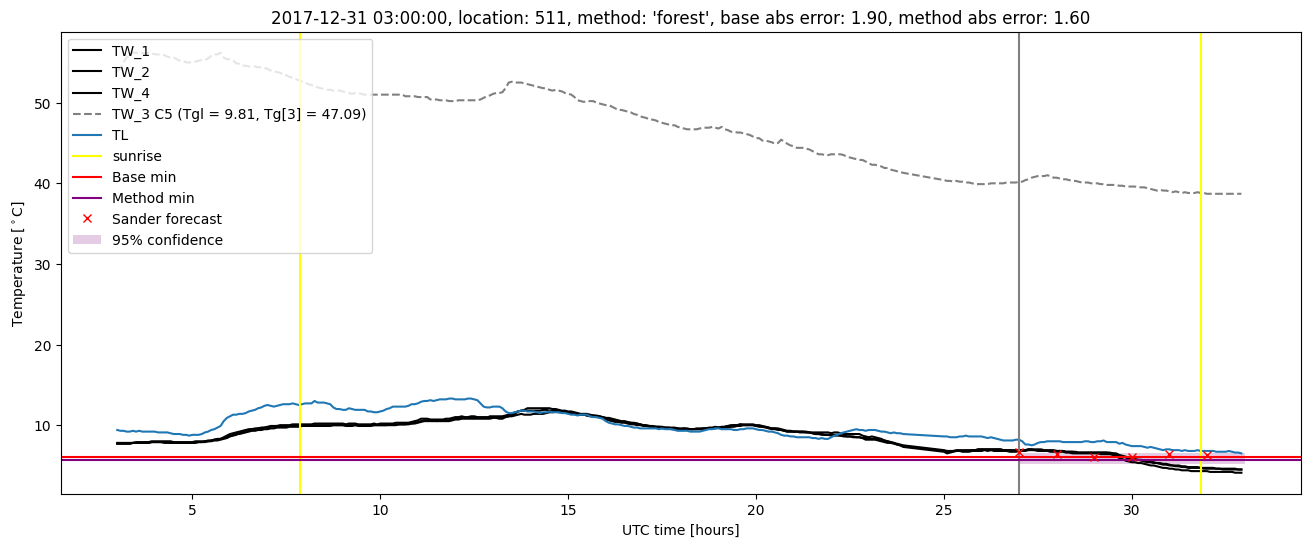
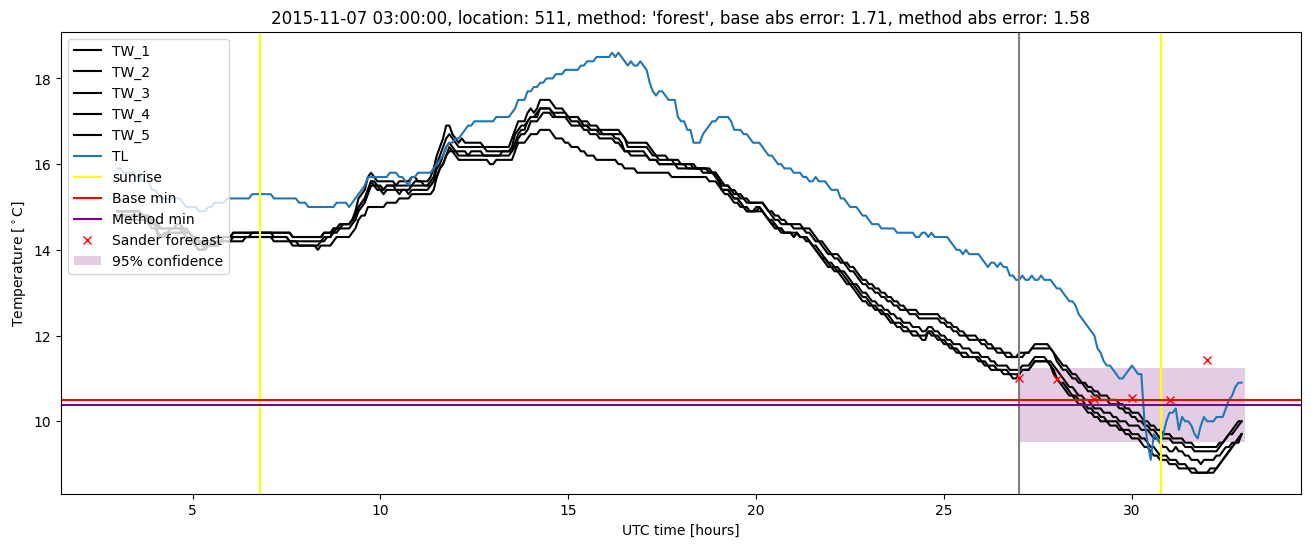
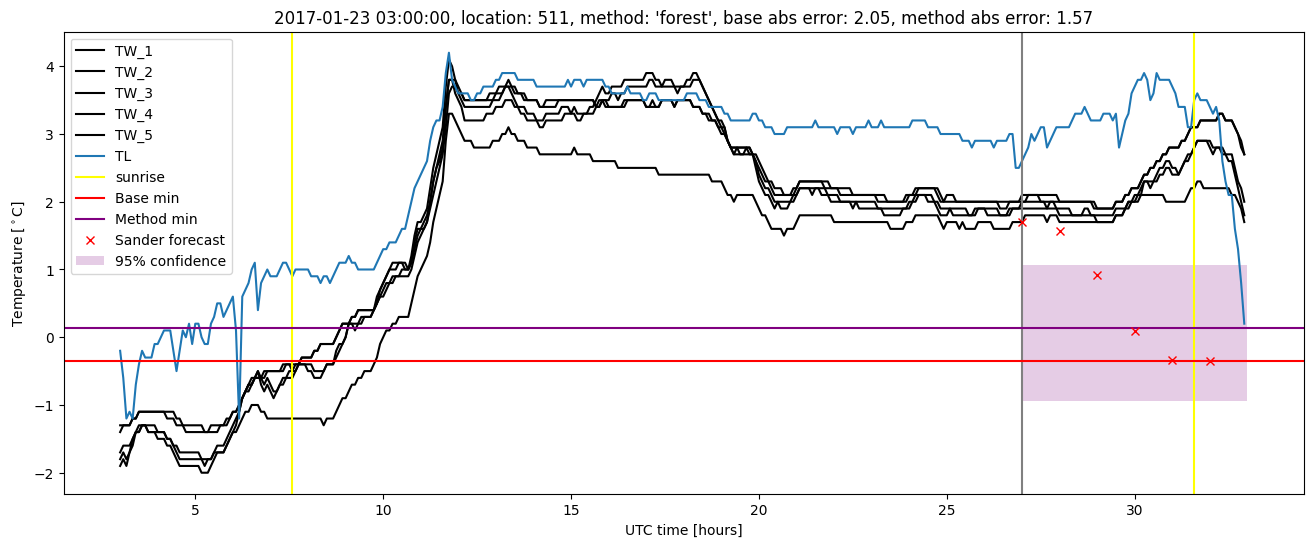
Random forest results
| names |
period |
power |
significance |
meanSquareError |
absError |
maxError |
CRPS |
IGN |
| baseline |
winter 2016 |
0.983 |
0.048 |
0.324 |
0.449 |
1.801 |
NaN |
NaN |
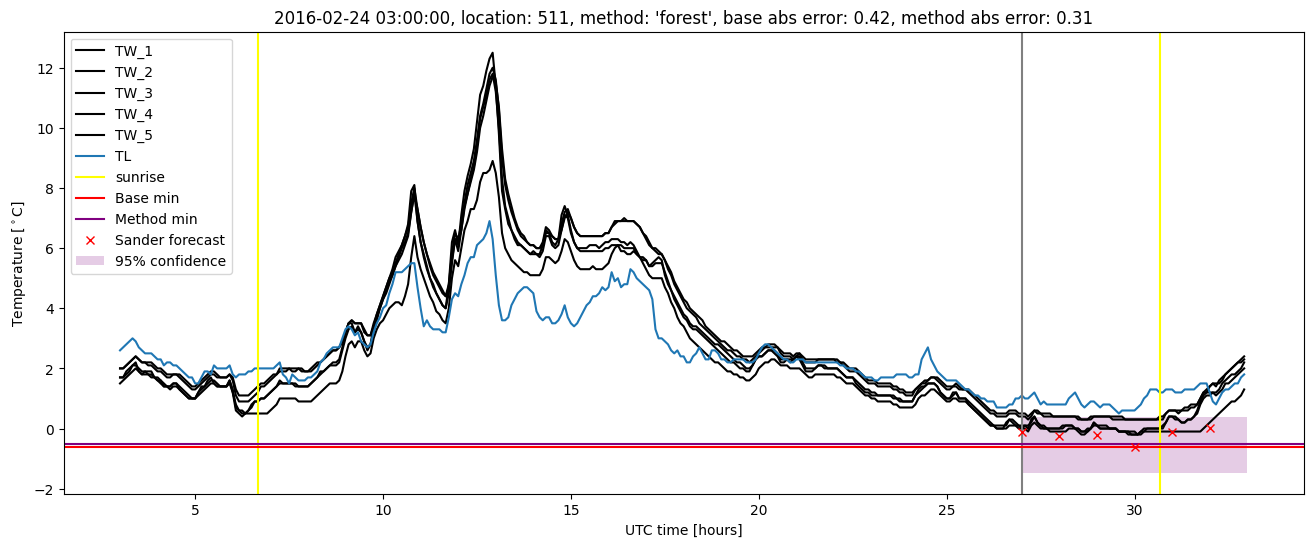
| forest |
winter 2016 |
0.994 |
0.095 |
0.257 |
0.385 |
1.665 |
0.445 |
3.325 |
| baseline |
winter 2017 |
0.941 |
0.065 |
0.401 |
0.490 |
2.050 |
NaN |
NaN |
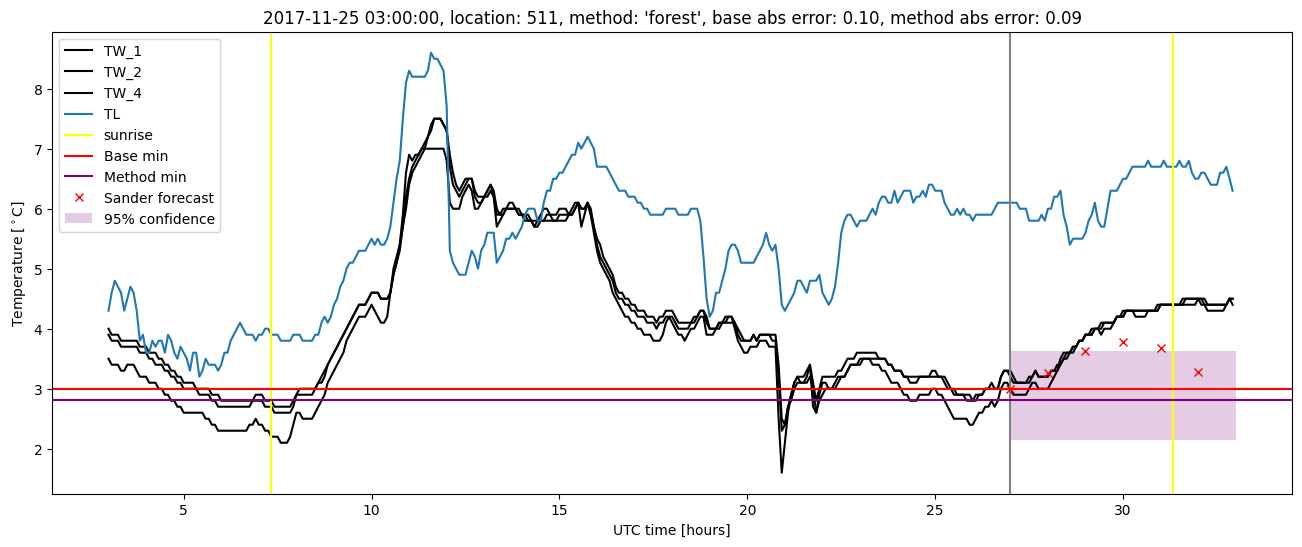
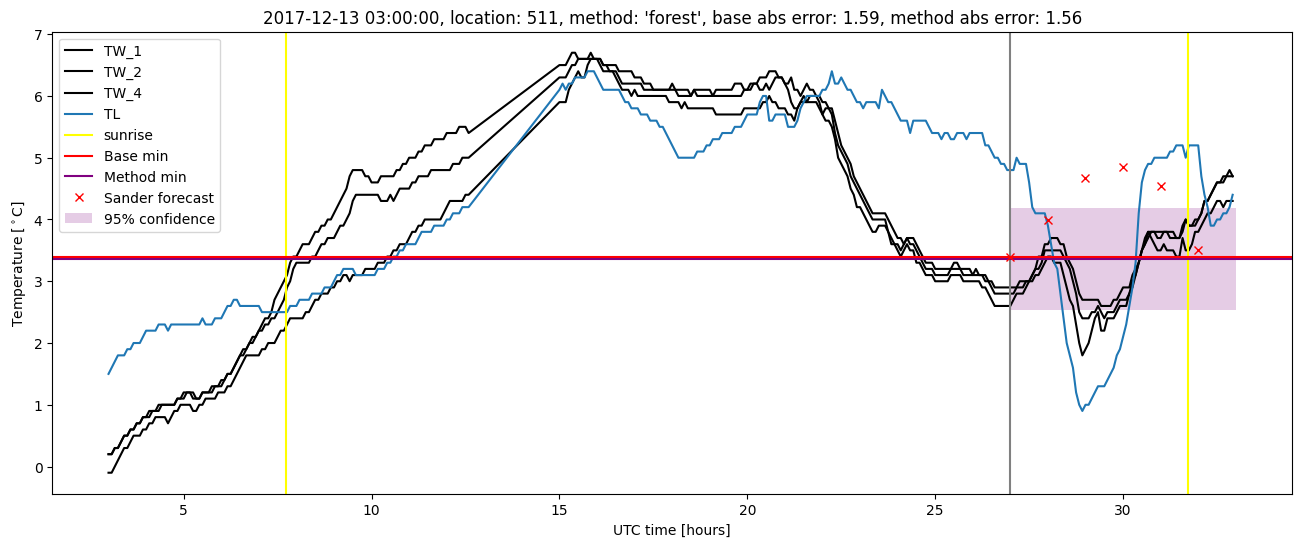
| forest |
winter 2017 |
0.992 |
0.065 |
0.276 |
0.401 |
1.569 |
0.463 |
4.075 |
| baseline |
winter 2018 |
1.000 |
0.083 |
0.367 |
0.445 |
2.280 |
NaN |
NaN |
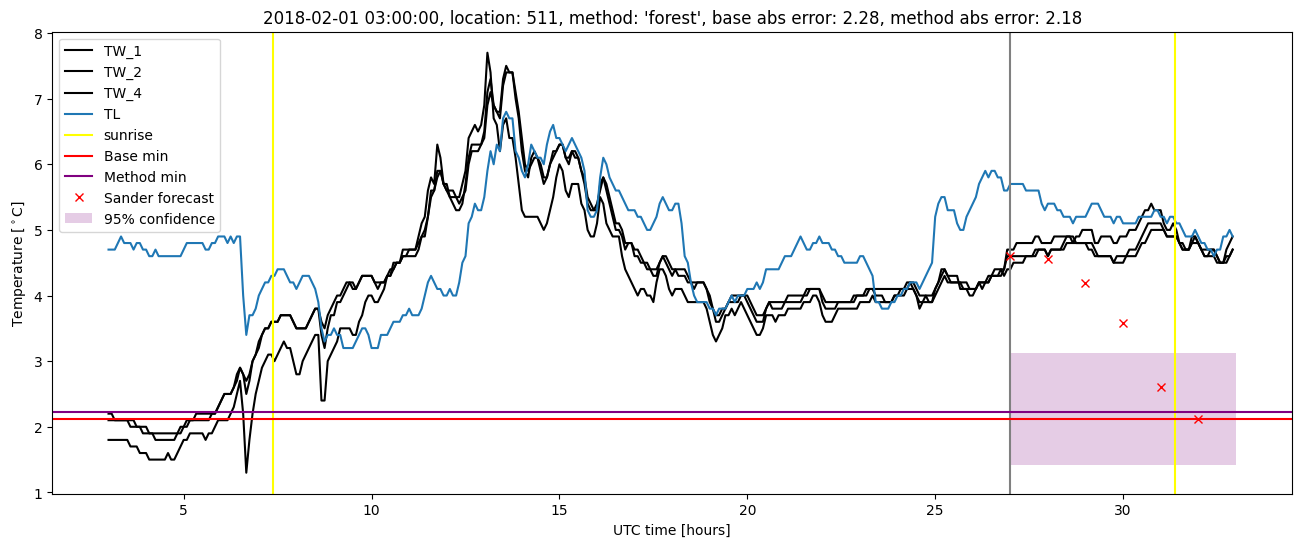
| forest |
winter 2018 |
1.000 |
0.167 |
0.308 |
0.403 |
2.182 |
0.465 |
2.999 |
| baseline |
winter 2019 |
0.986 |
0.000e+00 |
0.293 |
0.412 |
1.472 |
NaN |
NaN |
| forest |
winter 2019 |
0.993 |
0.091 |
0.214 |
0.351 |
1.458 |
0.461 |
2.951 |
| baseline |
all |
0.979 |
0.058 |
0.345 |
0.449 |
2.280 |
NaN |
NaN |
| forest |
all |
0.995 |
0.103 |
0.264 |
0.385 |
2.182 |
0.458 |
3.327 |
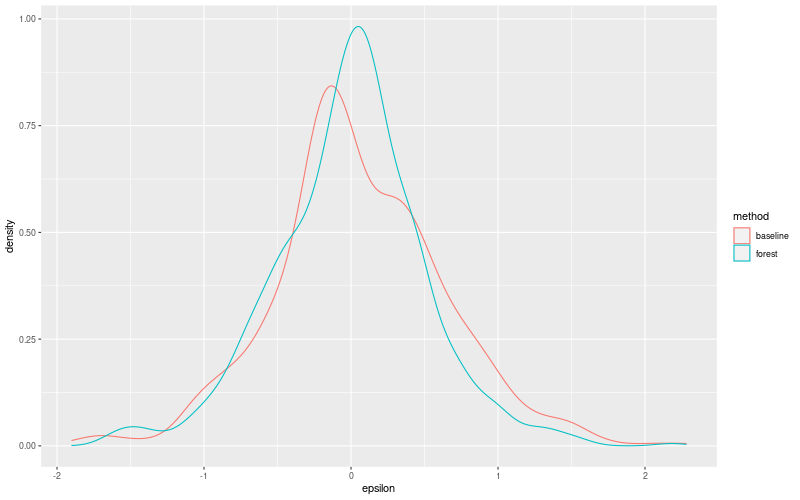
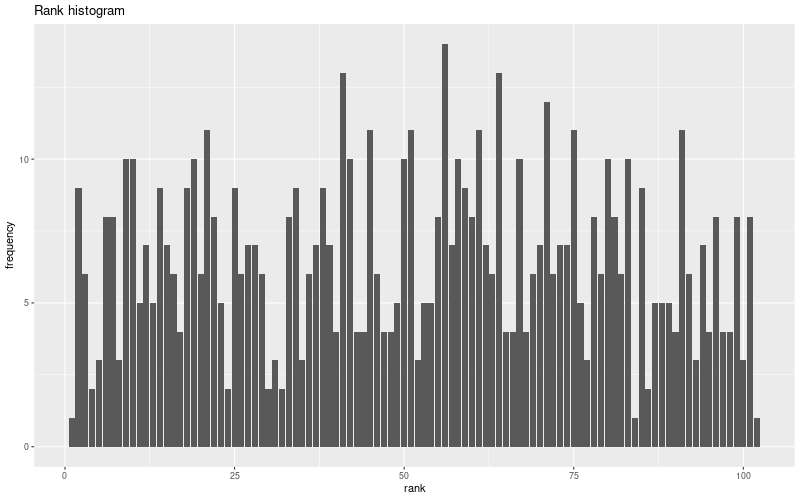
Random forest plots
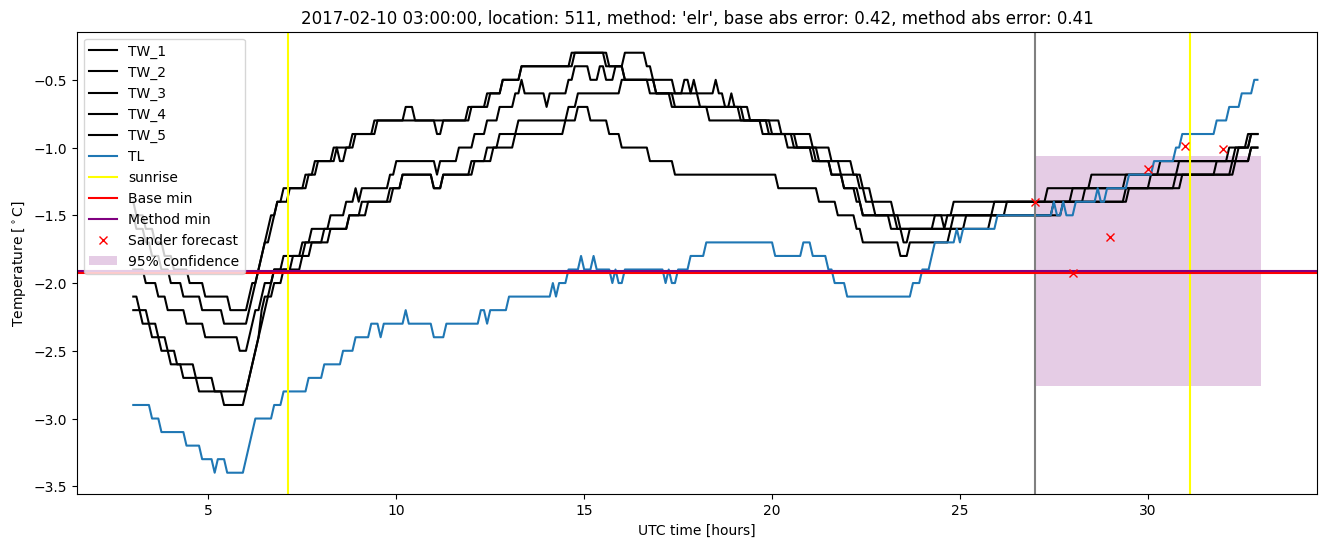
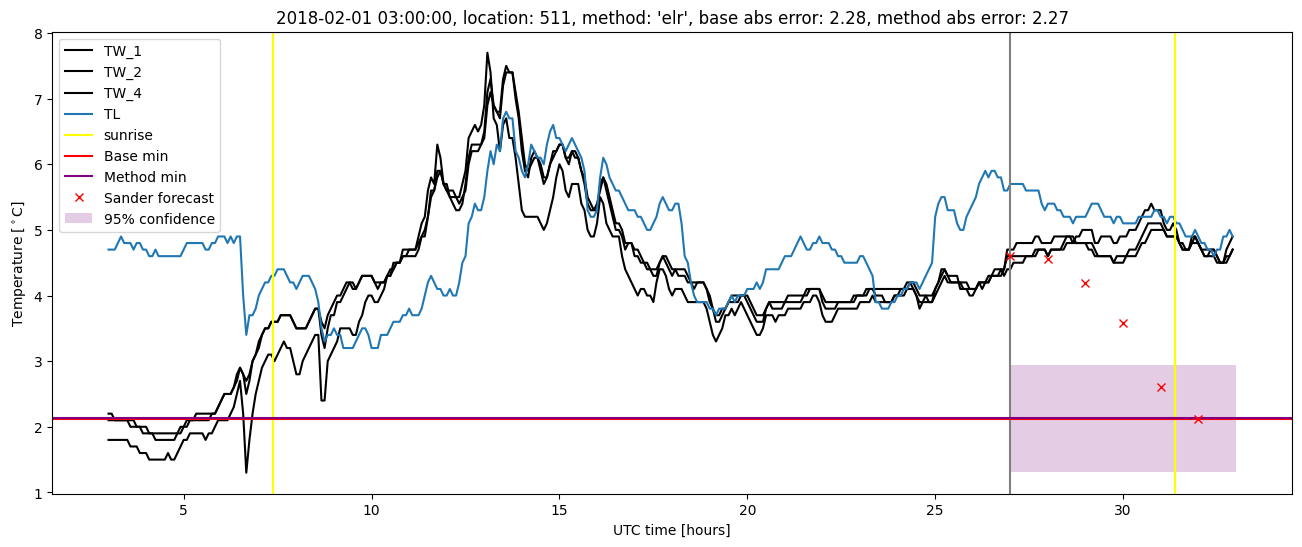
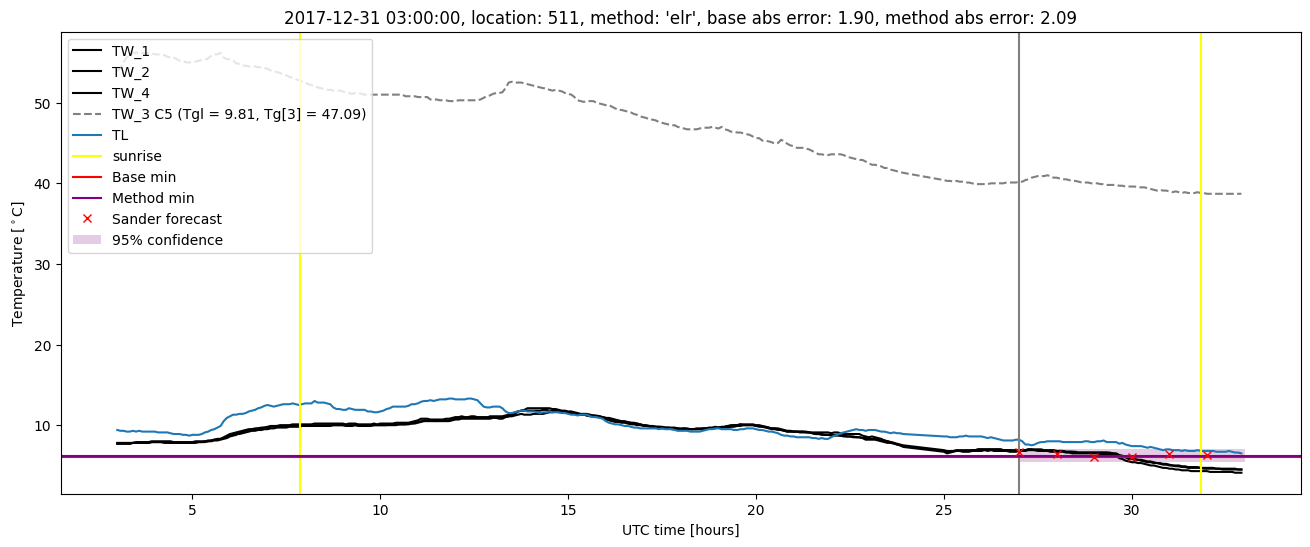
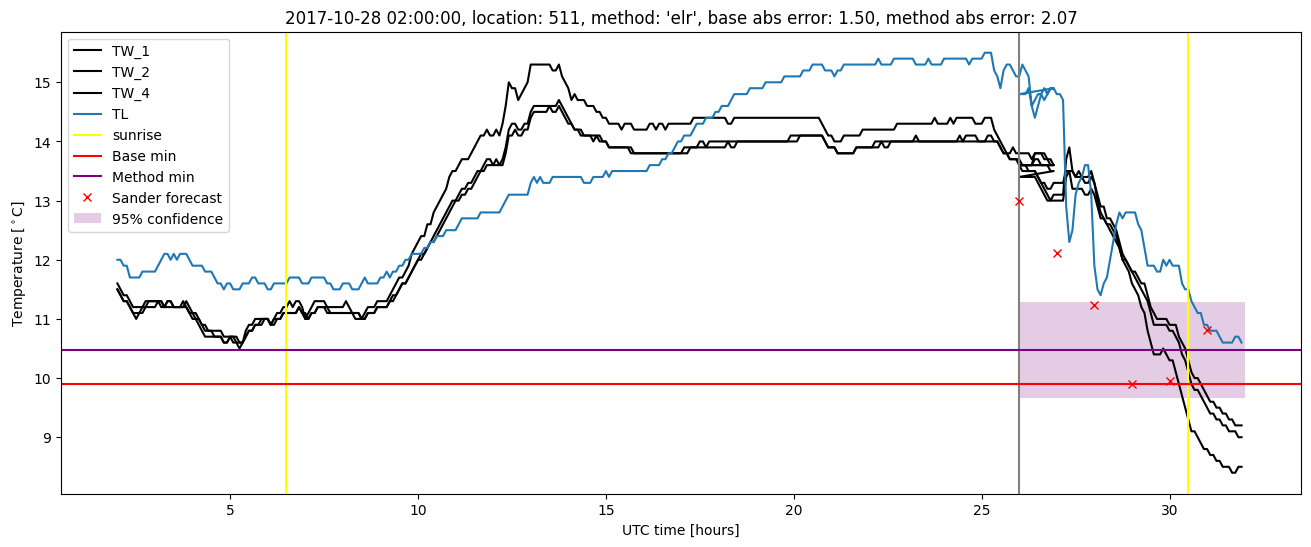
Extended logistic regression results
| names |
period |
power |
significance |
meanSquareError |
absError |
maxError |
CRPS |
IGN |
| baseline |
winter 2016 |
0.983 |
0.048 |
0.324 |
0.449 |
1.801 |
NaN |
NaN |
| elr |
winter 2016 |
0.989 |
0.048 |
0.310 |
0.431 |
2.033 |
0.521 |
4.099 |
| baseline |
winter 2017 |
0.941 |
0.065 |
0.401 |
0.490 |
2.050 |
NaN |
NaN |
| elr |
winter 2017 |
0.958 |
0.032 |
0.325 |
0.454 |
1.736 |
0.516 |
4.509 |
| baseline |
winter 2018 |
1.000 |
0.083 |
0.367 |
0.445 |
2.280 |
NaN |
NaN |
| elr |
winter 2018 |
0.993 |
0.167 |
0.339 |
0.410 |
2.273 |
0.508 |
5.108 |
| baseline |
winter 2019 |
0.986 |
0.000e+00 |
0.293 |
0.412 |
1.472 |
NaN |
NaN |
| elr |
winter 2019 |
0.993 |
0.091 |
0.259 |
0.390 |
1.588 |
0.516 |
4.139 |
| baseline |
all |
0.979 |
0.058 |
0.345 |
0.449 |
2.280 |
NaN |
NaN |
| elr |
all |
0.985 |
0.081 |
0.309 |
0.422 |
2.273 |
0.516 |
4.451 |
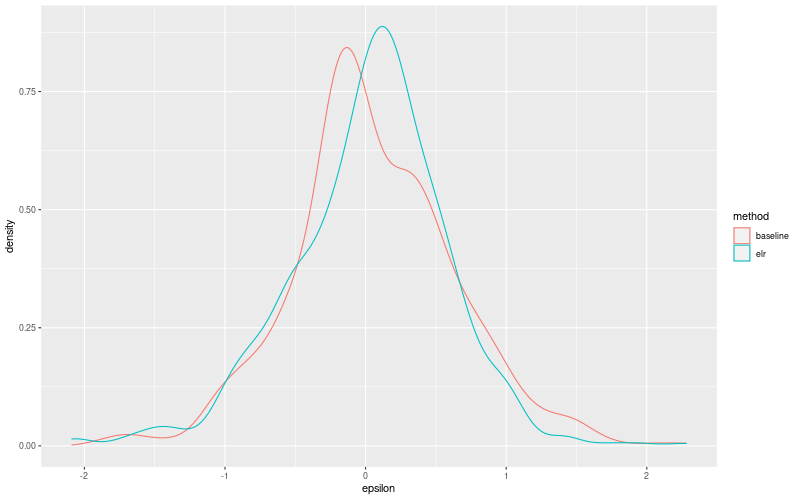
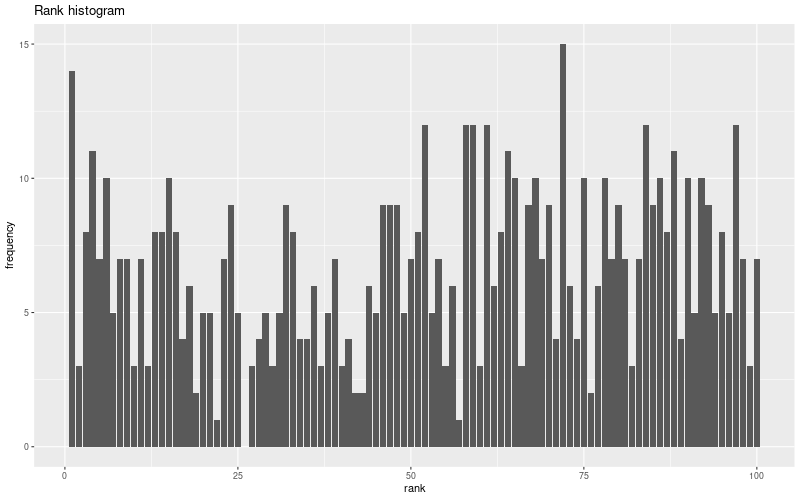
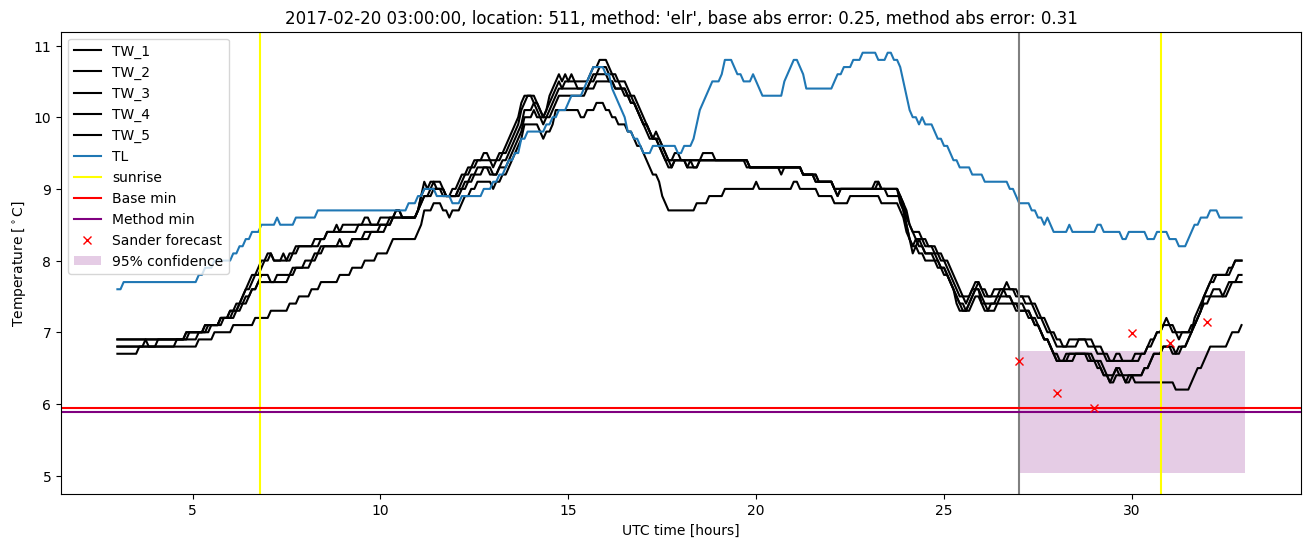
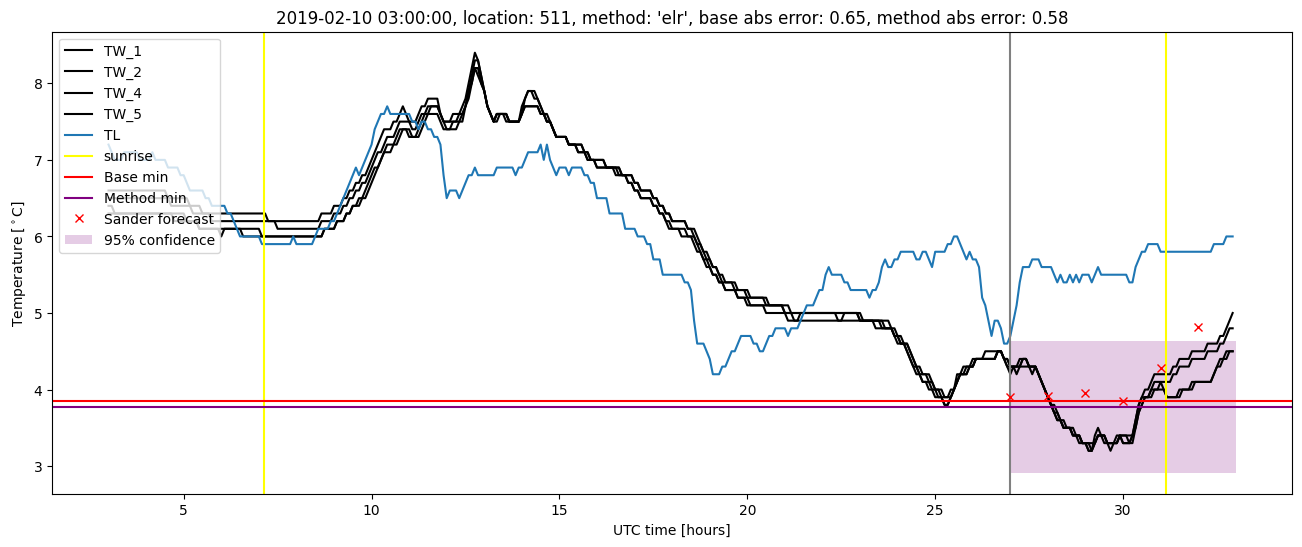
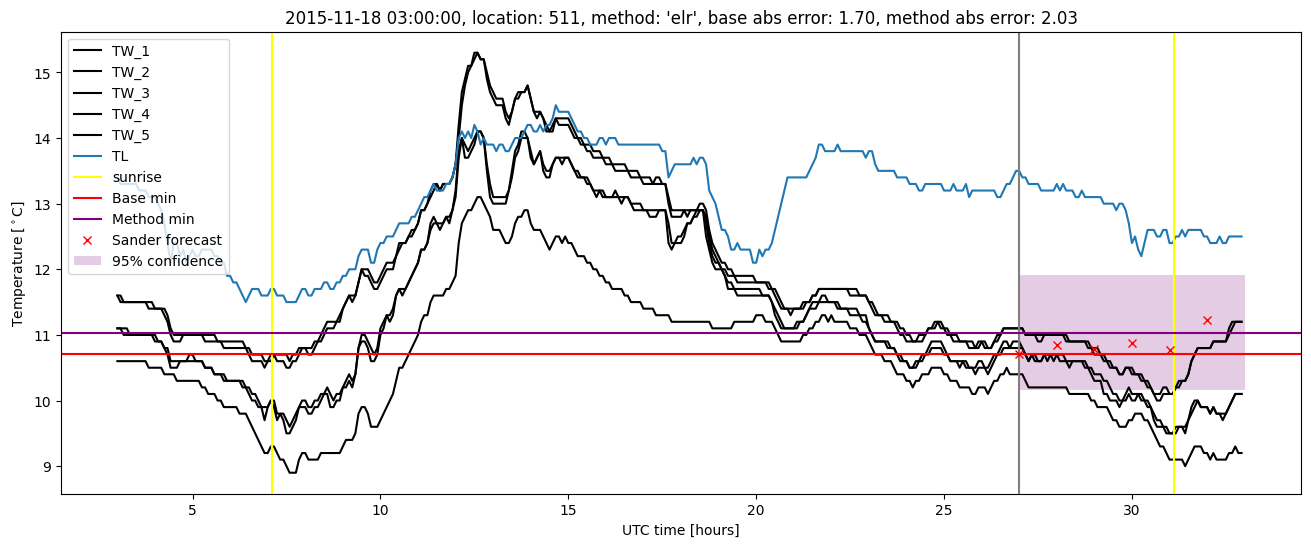
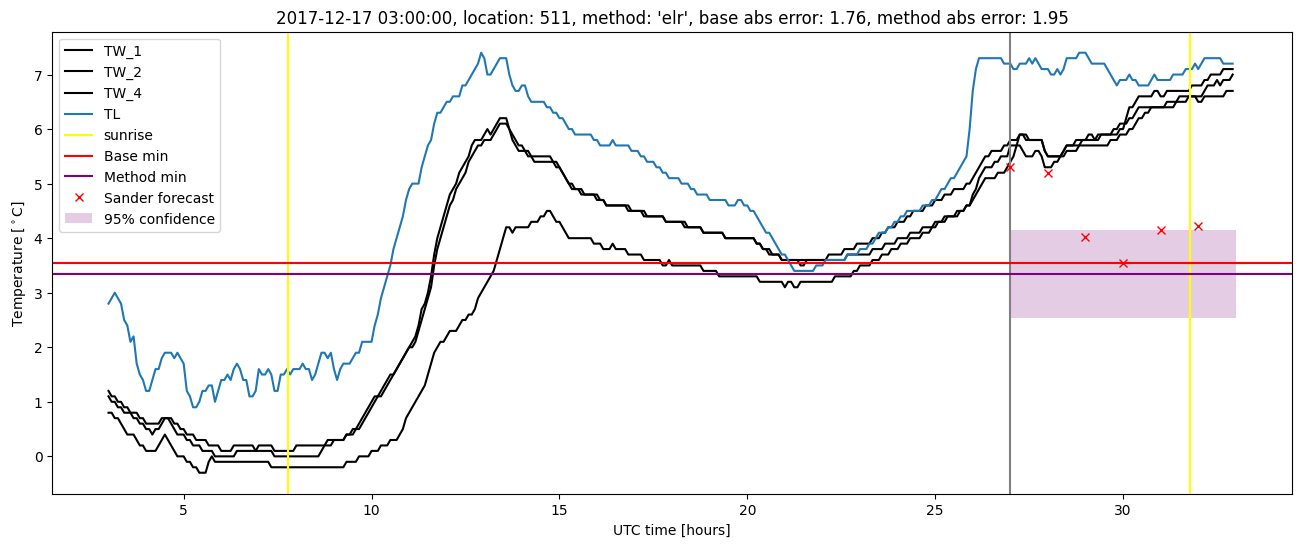
Extended logistic regression plots