GMS location: 510
Random forest results
| names |
period |
power |
significance |
meanSquareError |
absError |
maxError |
CRPS |
IGN |
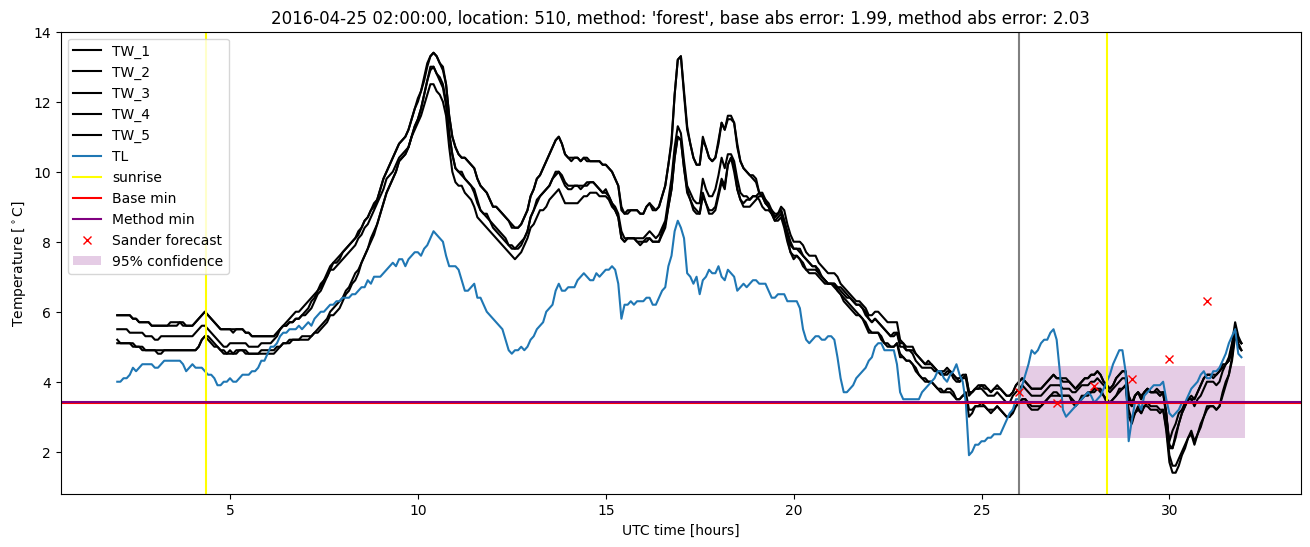
| baseline |
winter 2016 |
0.984 |
0.056 |
0.298 |
0.407 |
2.301 |
NaN |
NaN |
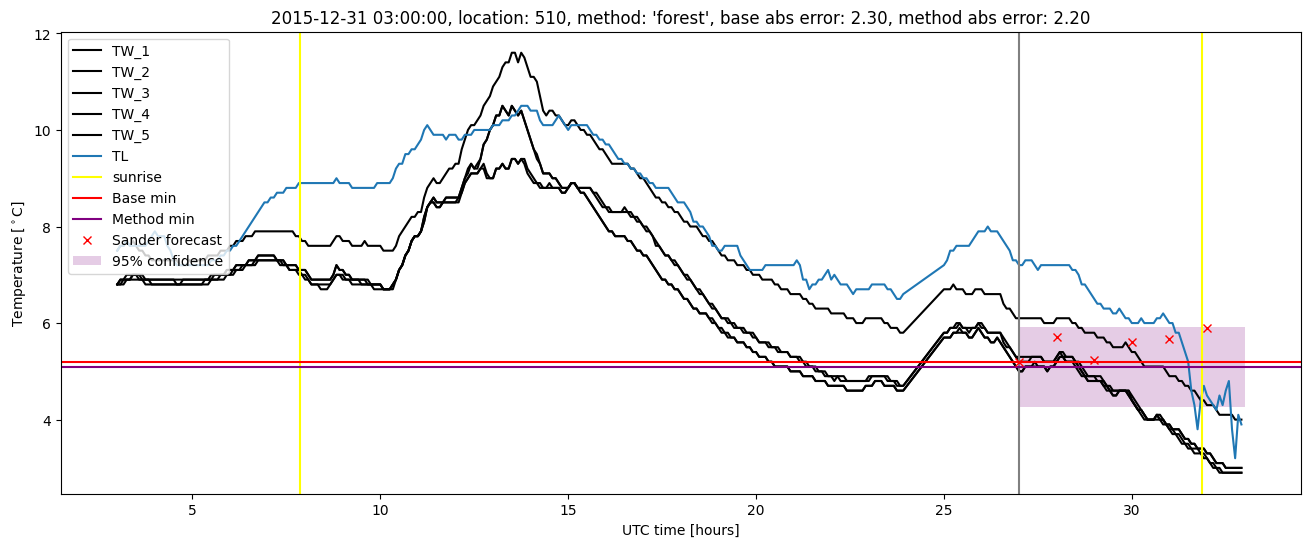
| forest |
winter 2016 |
1.000 |
0.000e+00 |
0.266 |
0.382 |
2.197 |
0.498 |
4.233 |
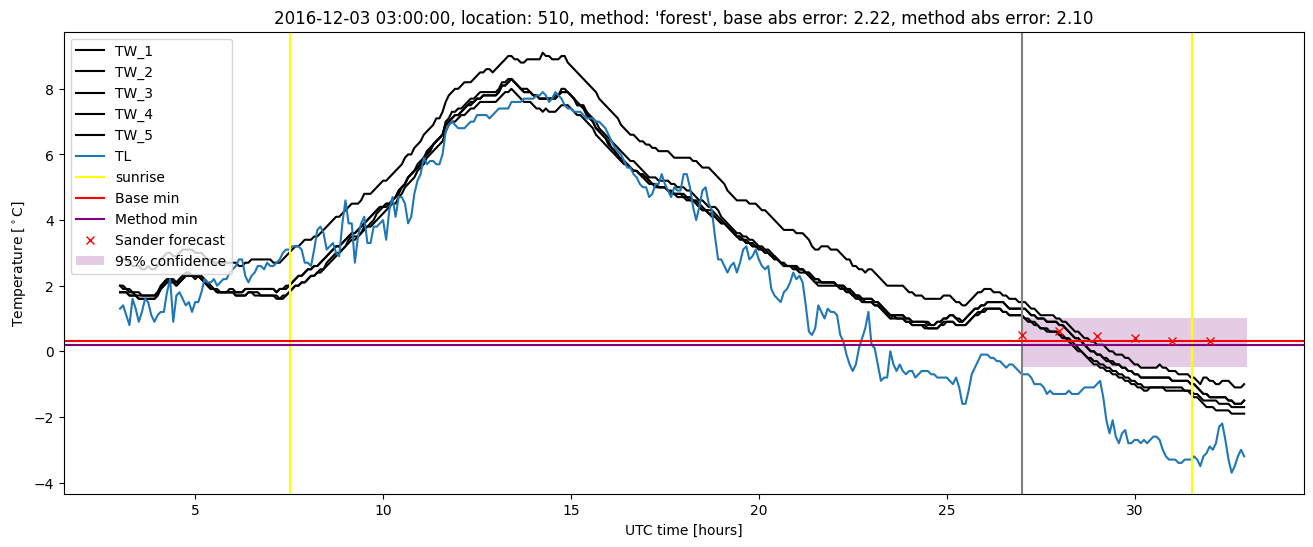
| baseline |
winter 2017 |
0.975 |
0.043 |
0.349 |
0.446 |
2.222 |
NaN |
NaN |
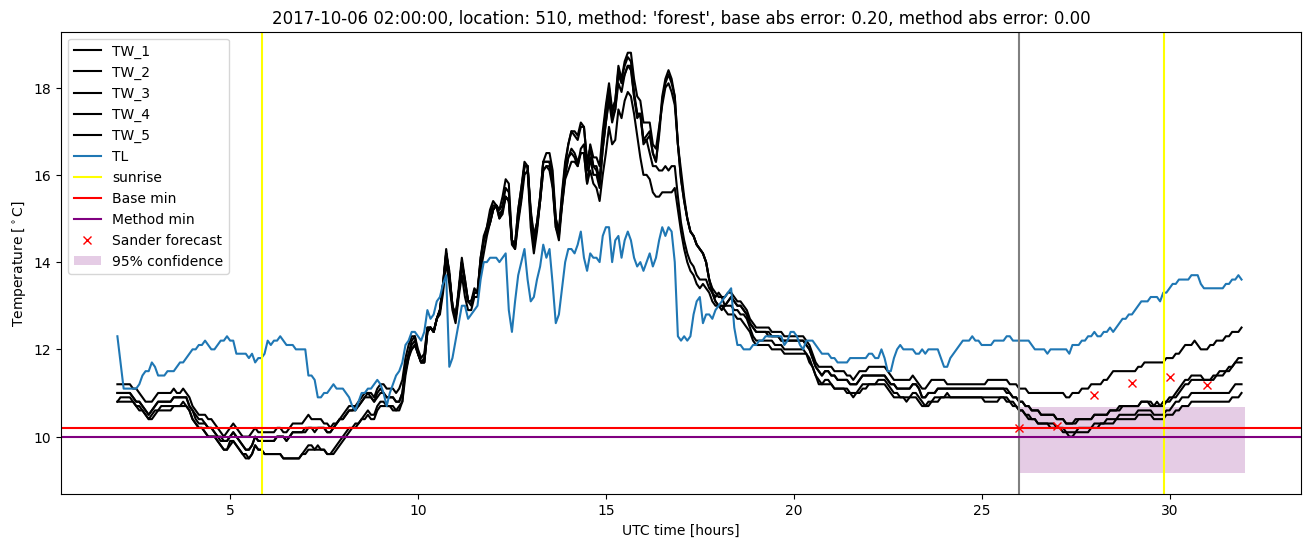
| forest |
winter 2017 |
0.983 |
0.043 |
0.273 |
0.376 |
2.101 |
0.512 |
4.779 |
| baseline |
winter 2018 |
0.993 |
0.080 |
0.329 |
0.420 |
2.005 |
NaN |
NaN |
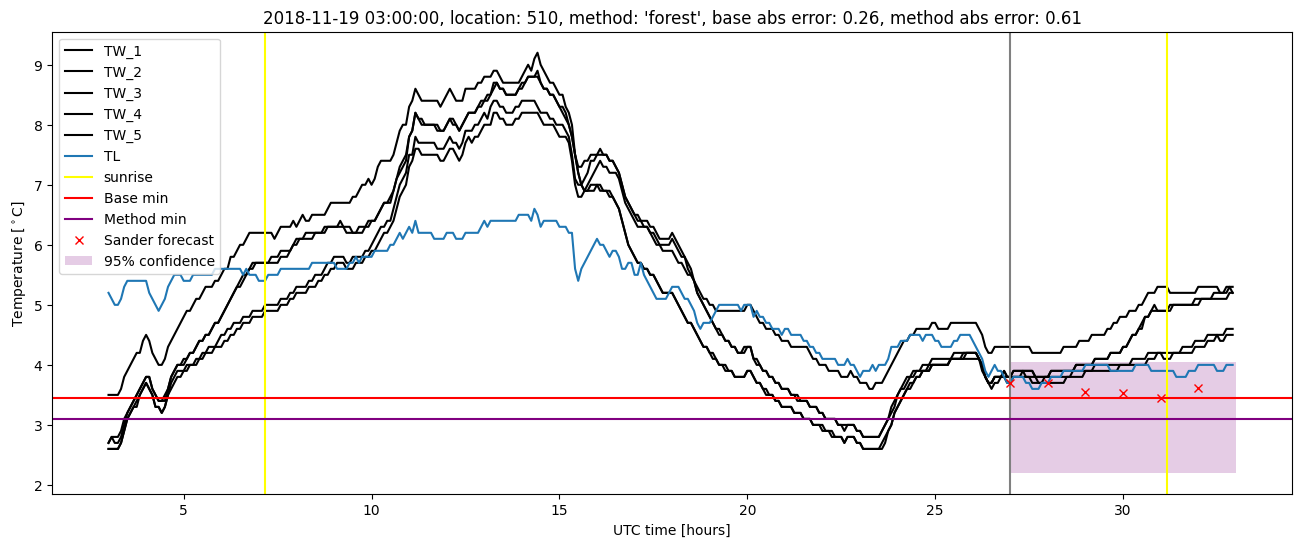
| forest |
winter 2018 |
0.986 |
0.160 |
0.299 |
0.408 |
1.851 |
0.517 |
4.527 |
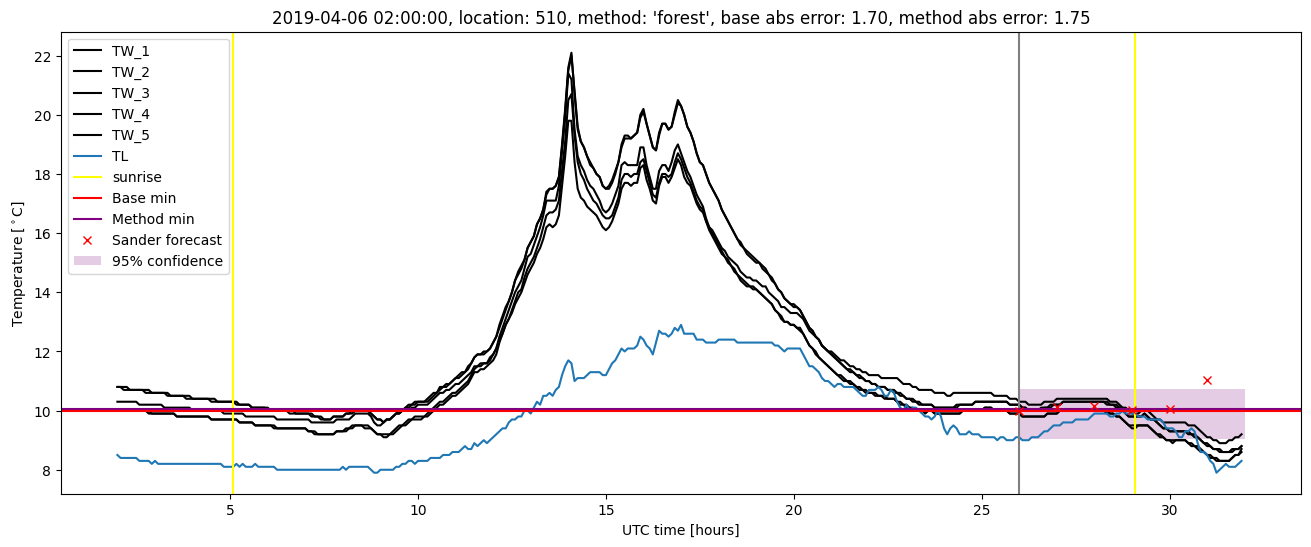
| baseline |
winter 2019 |
0.979 |
0.000e+00 |
0.227 |
0.368 |
1.699 |
NaN |
NaN |
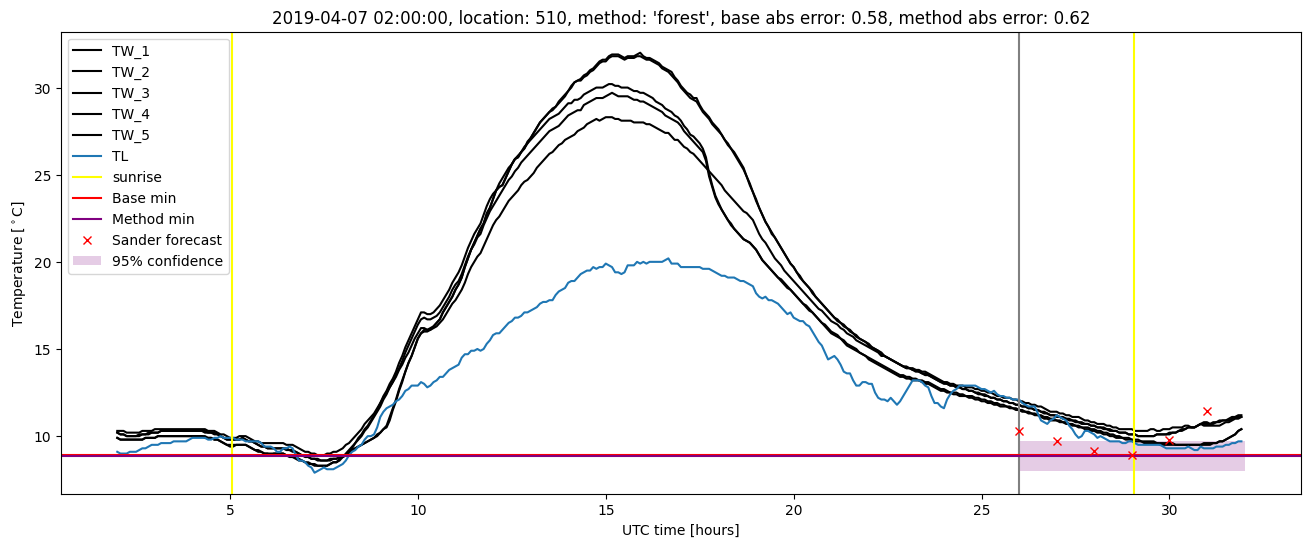
| forest |
winter 2019 |
0.986 |
0.000e+00 |
0.197 |
0.335 |
1.747 |
0.505 |
3.674 |
| baseline |
all |
0.983 |
0.053 |
0.300 |
0.409 |
2.301 |
NaN |
NaN |
| forest |
all |
0.990 |
0.066 |
0.259 |
0.376 |
2.197 |
0.507 |
4.291 |
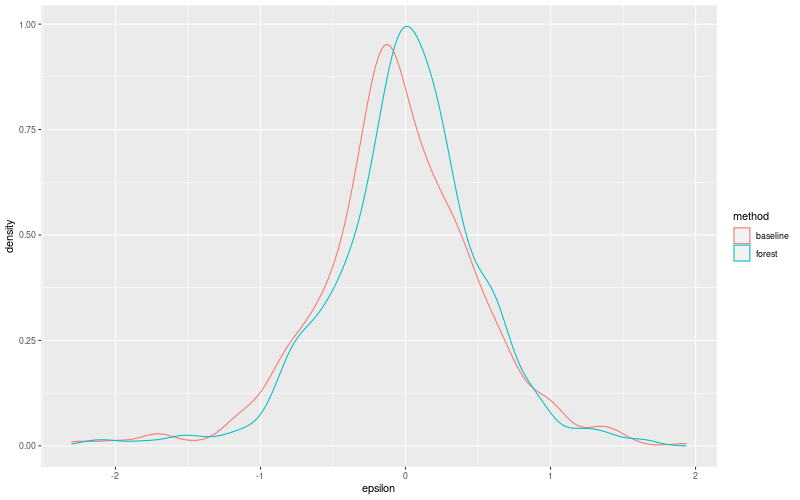
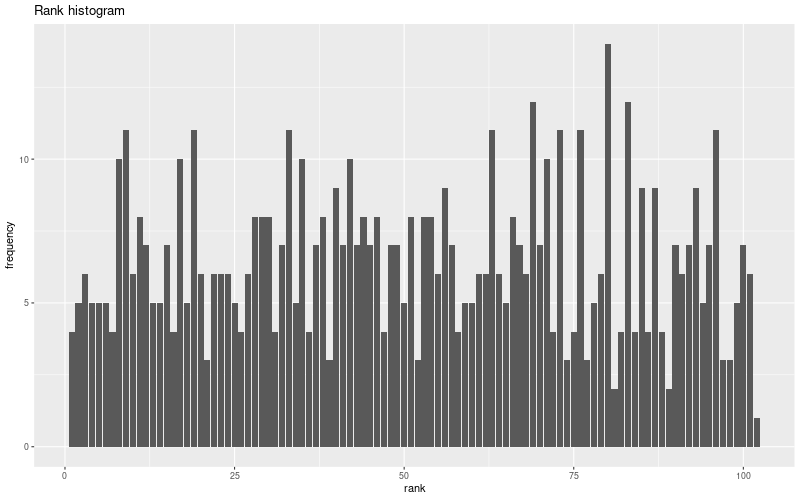
Random forest plots

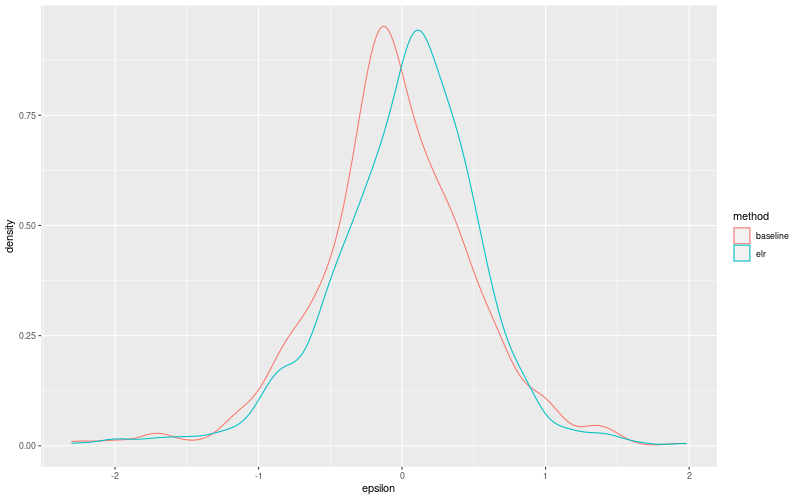
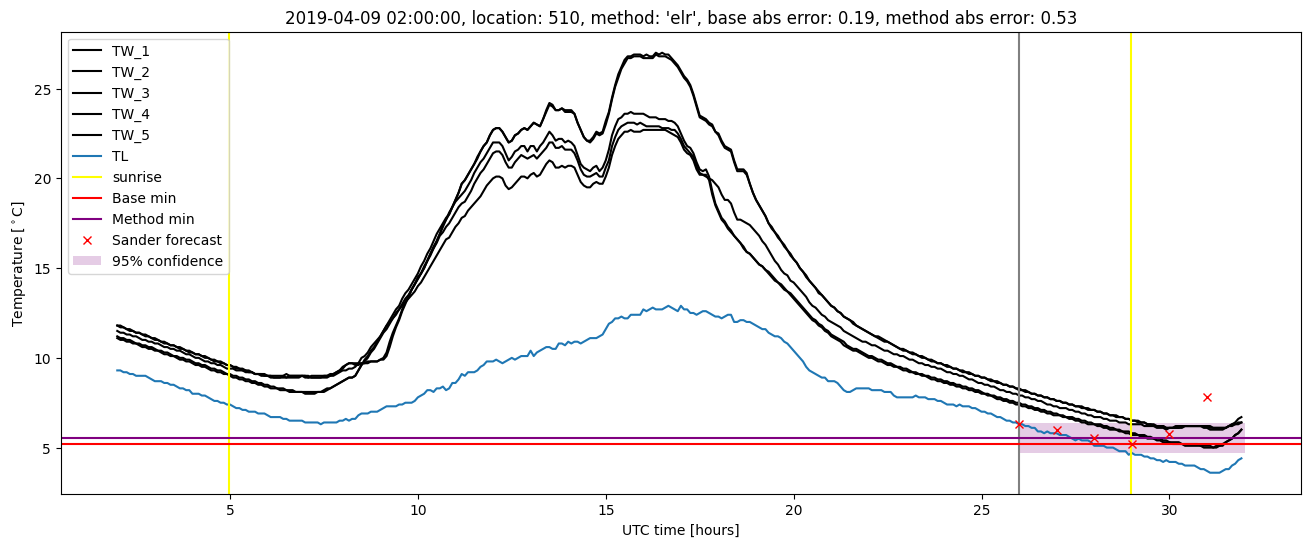
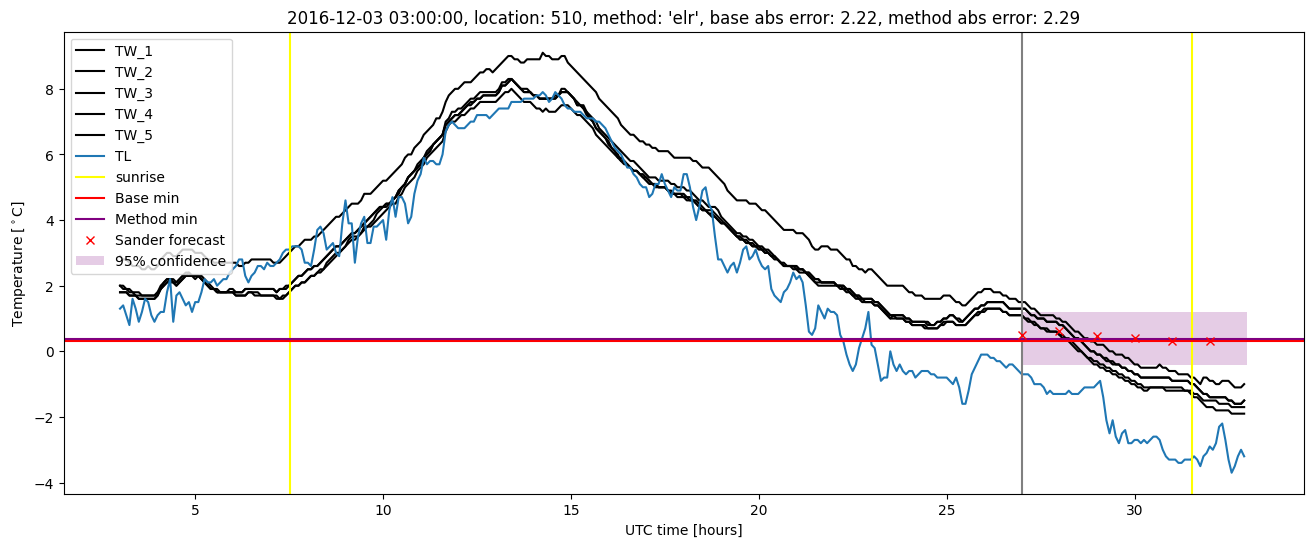
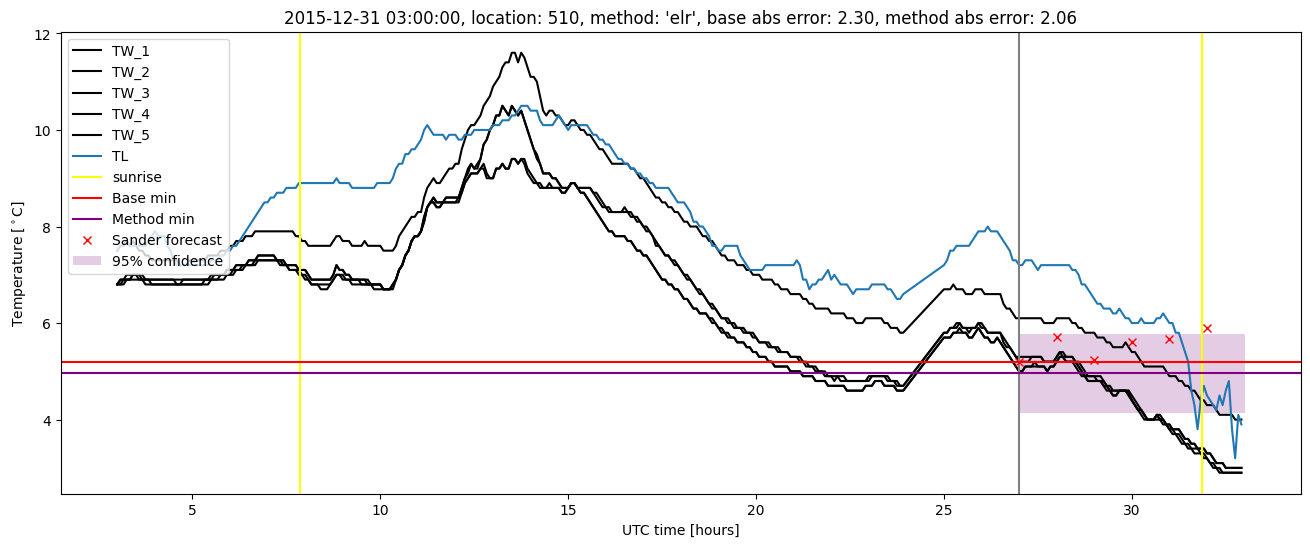
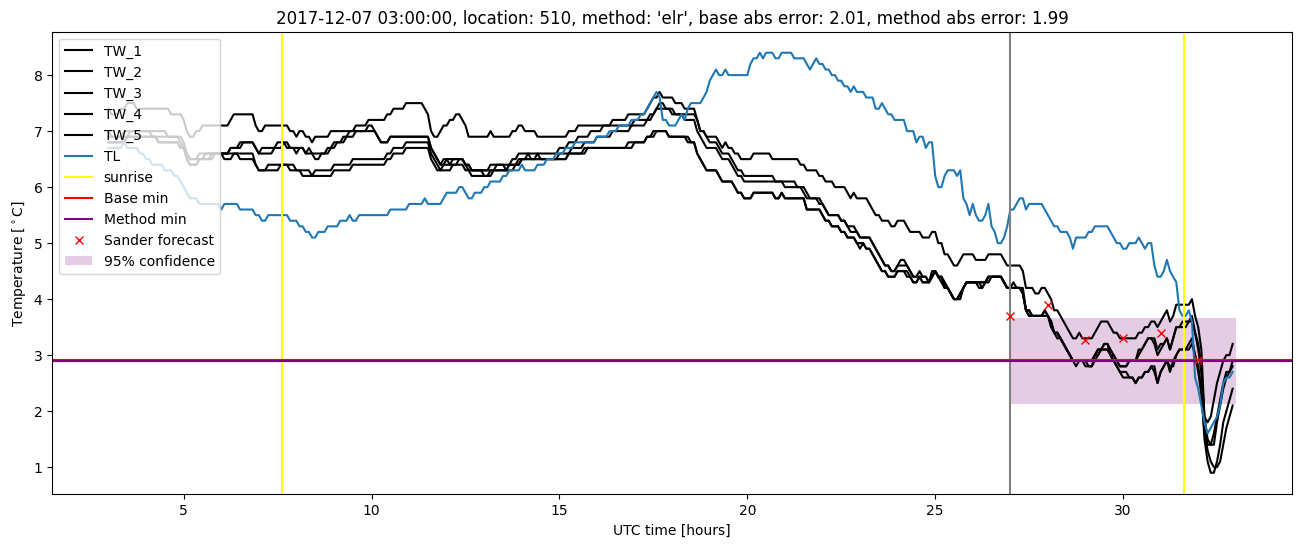
Extended logistic regression results
| names |
period |
power |
significance |
meanSquareError |
absError |
maxError |
CRPS |
IGN |
| baseline |
winter 2016 |
0.984 |
0.056 |
0.298 |
0.407 |
2.301 |
NaN |
NaN |
| elr |
winter 2016 |
0.989 |
0.000e+00 |
0.275 |
0.404 |
2.059 |
0.569 |
5.938 |
| baseline |
winter 2017 |
0.975 |
0.043 |
0.349 |
0.446 |
2.222 |
NaN |
NaN |
| elr |
winter 2017 |
0.975 |
0.043 |
0.297 |
0.403 |
2.287 |
0.532 |
5.715 |
| baseline |
winter 2018 |
0.993 |
0.080 |
0.329 |
0.420 |
2.005 |
NaN |
NaN |
| elr |
winter 2018 |
0.986 |
0.080 |
0.310 |
0.411 |
1.994 |
0.576 |
7.980 |
| baseline |
winter 2019 |
0.979 |
0.000e+00 |
0.227 |
0.368 |
1.699 |
NaN |
NaN |
| elr |
winter 2019 |
0.986 |
0.000e+00 |
0.194 |
0.337 |
1.435 |
0.542 |
4.804 |
| baseline |
all |
0.983 |
0.053 |
0.300 |
0.409 |
2.301 |
NaN |
NaN |
| elr |
all |
0.985 |
0.040 |
0.269 |
0.390 |
2.287 |
0.556 |
6.131 |
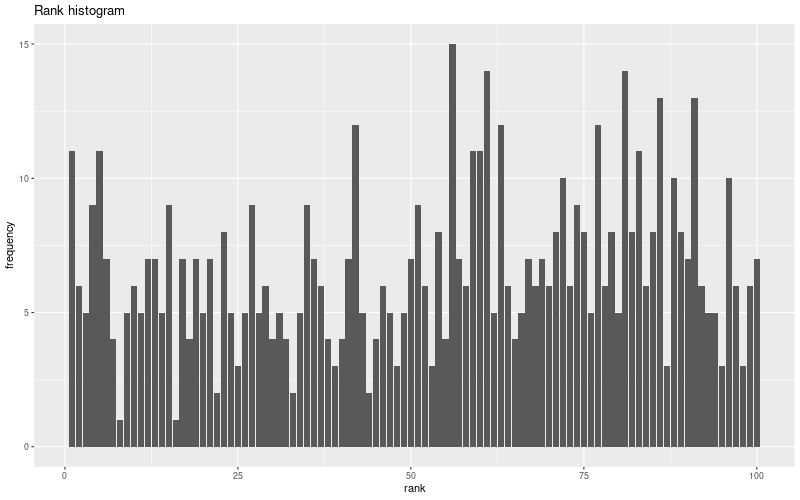
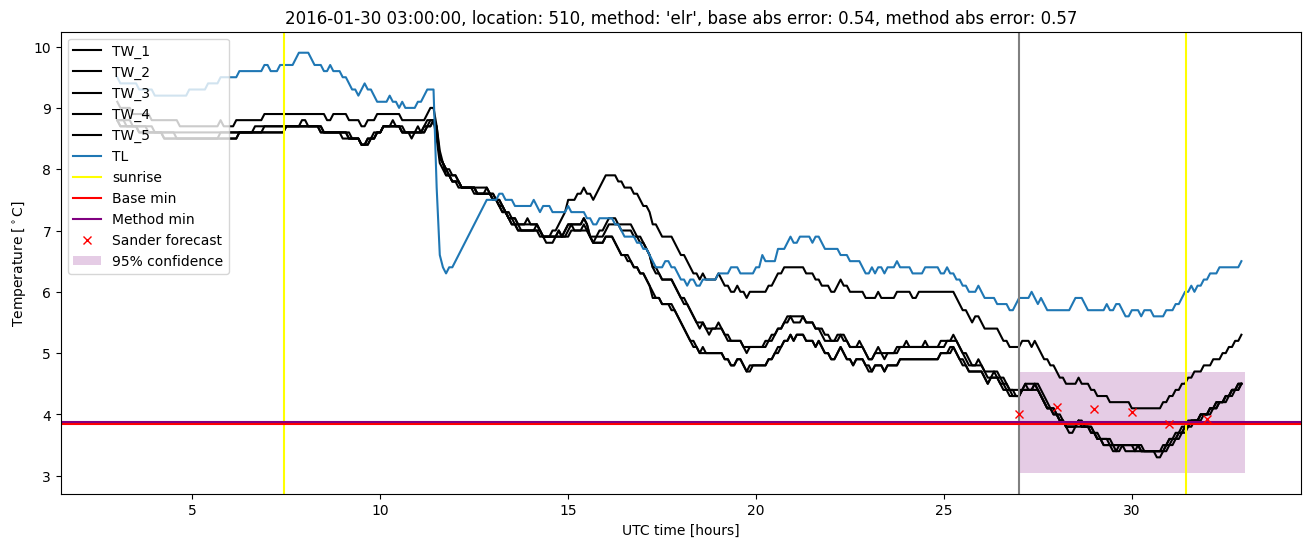
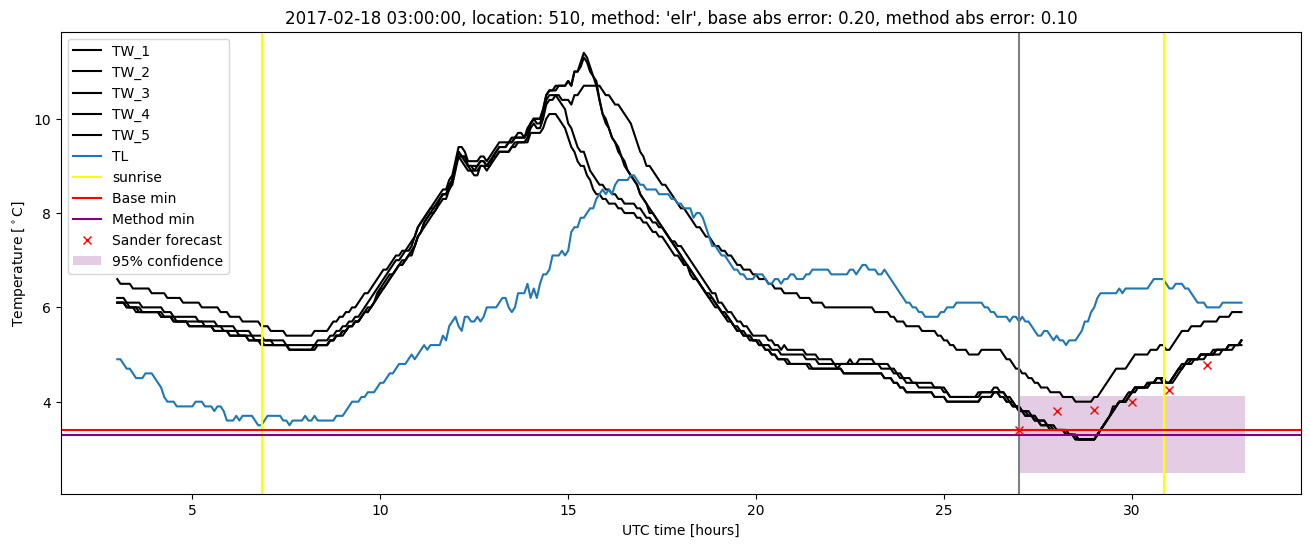
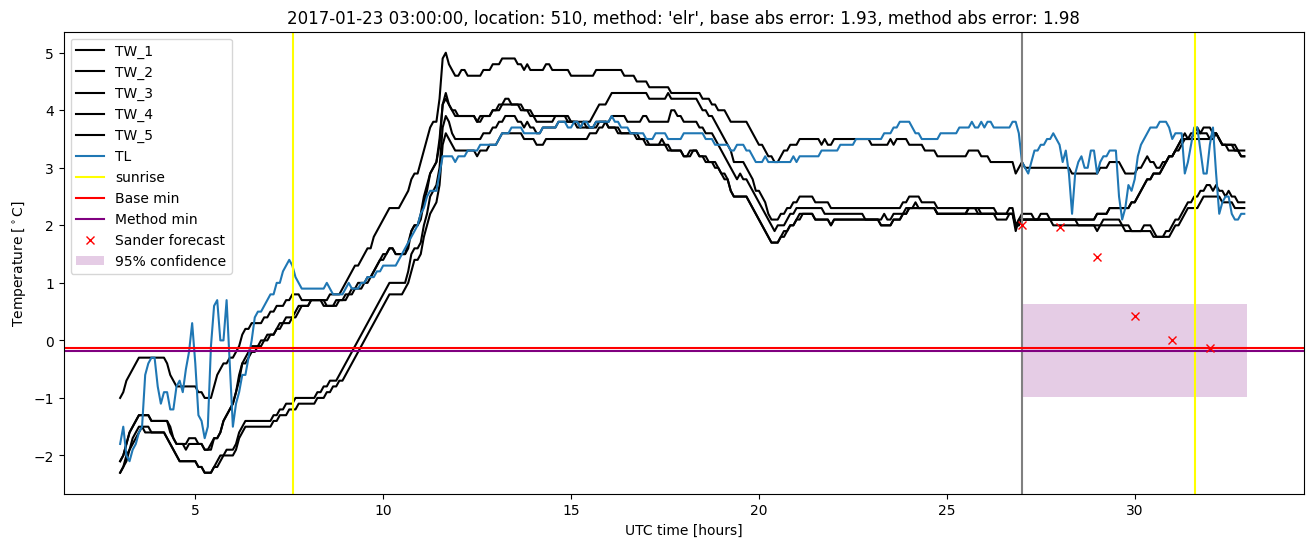
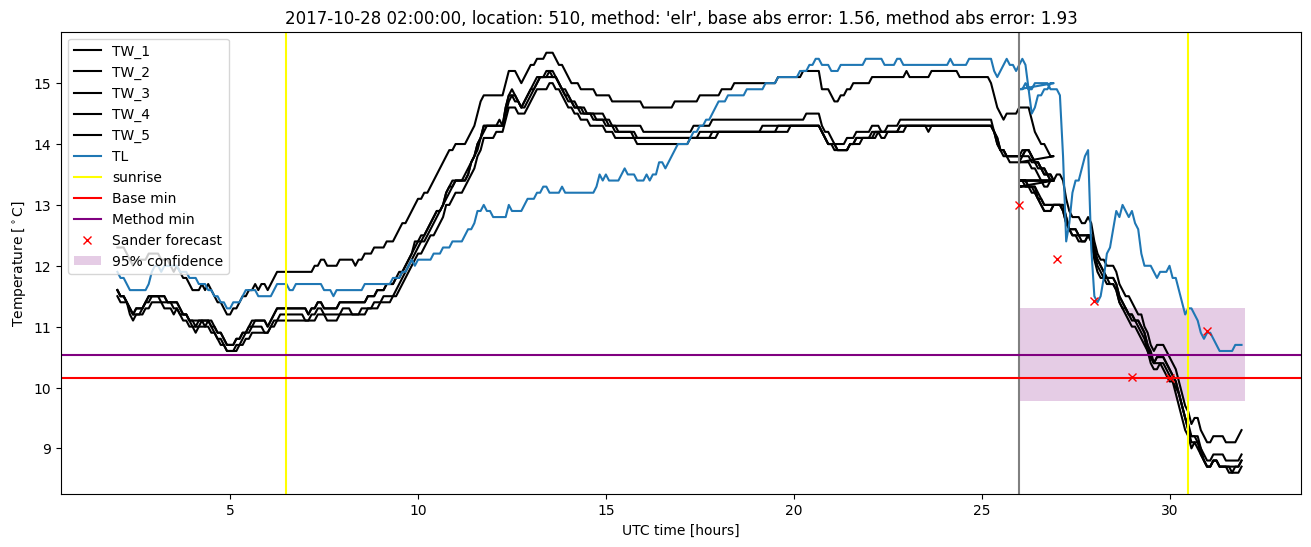
Extended logistic regression plots