GMS location: 509
Random forest results
| names |
period |
power |
significance |
meanSquareError |
absError |
maxError |
CRPS |
IGN |
| baseline |
winter 2016 |
0.994 |
0.105 |
0.407 |
0.460 |
3.154 |
NaN |
NaN |
| forest |
winter 2016 |
0.994 |
0.105 |
0.370 |
0.437 |
3.031 |
0.468 |
1.957 |
| baseline |
winter 2017 |
0.956 |
0.000e+00 |
0.811 |
0.606 |
3.994 |
NaN |
NaN |
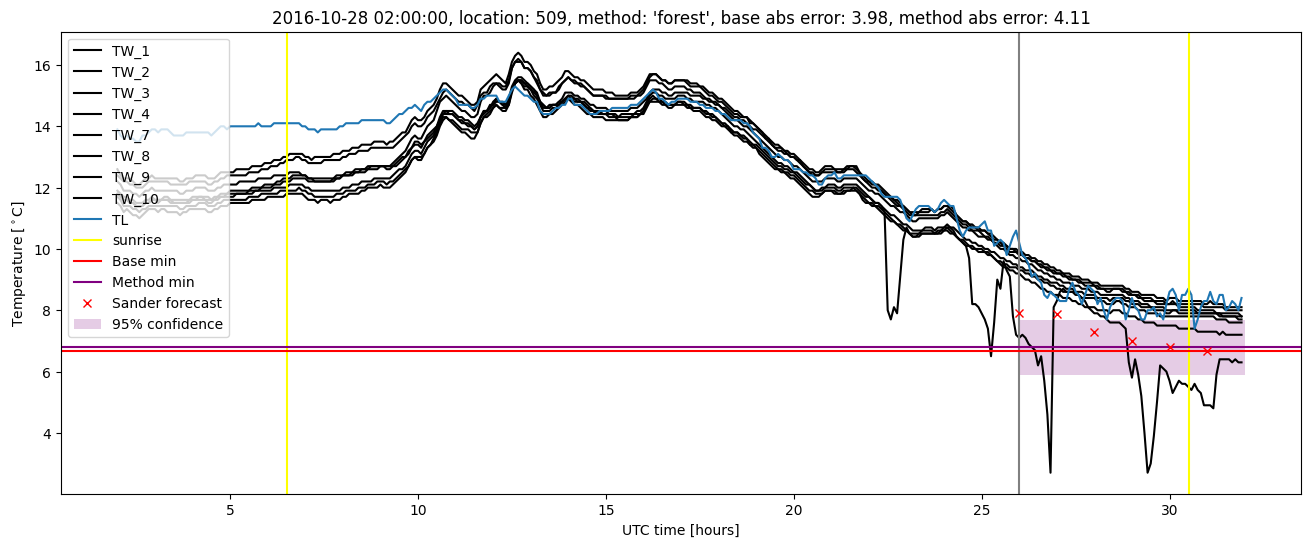
| forest |
winter 2017 |
0.965 |
0.000e+00 |
0.730 |
0.558 |
4.114 |
0.441 |
1.878 |
| baseline |
winter 2018 |
0.986 |
0.062 |
0.633 |
0.547 |
3.005 |
NaN |
NaN |
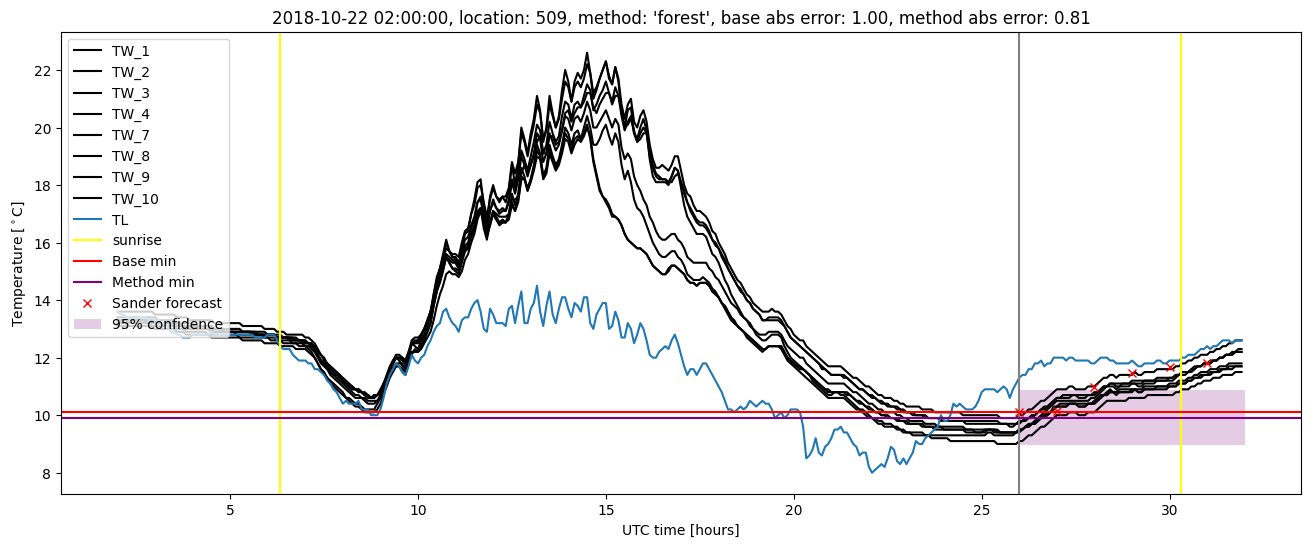
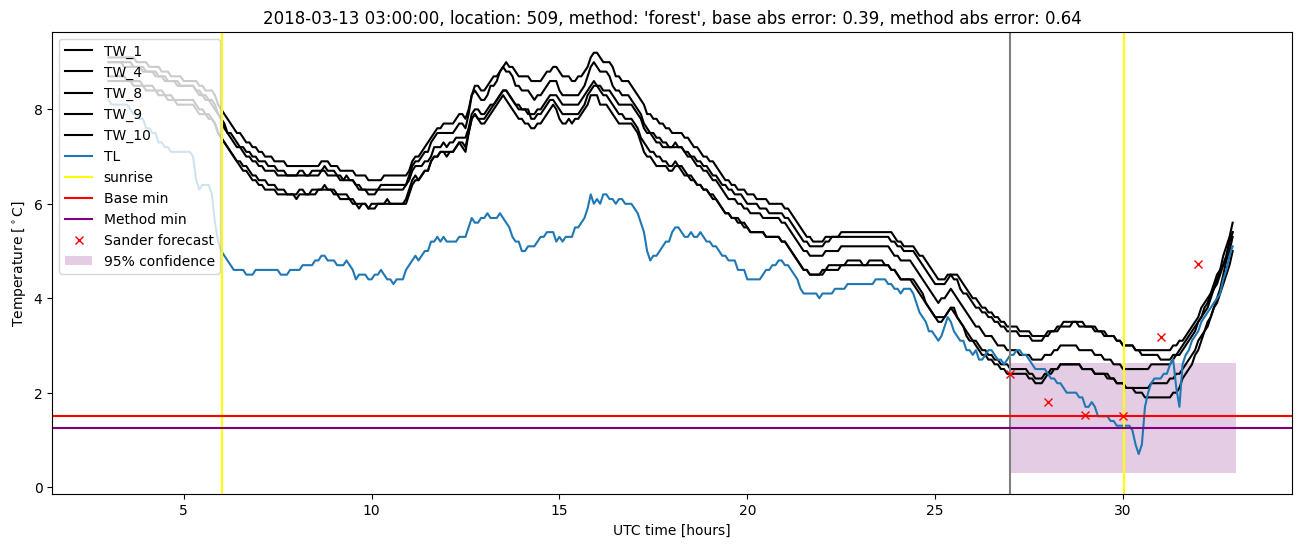
| forest |
winter 2018 |
0.979 |
0.062 |
0.659 |
0.545 |
2.936 |
0.498 |
3.229 |
| baseline |
winter 2019 |
0.993 |
0.000e+00 |
0.217 |
0.360 |
1.700 |
NaN |
NaN |
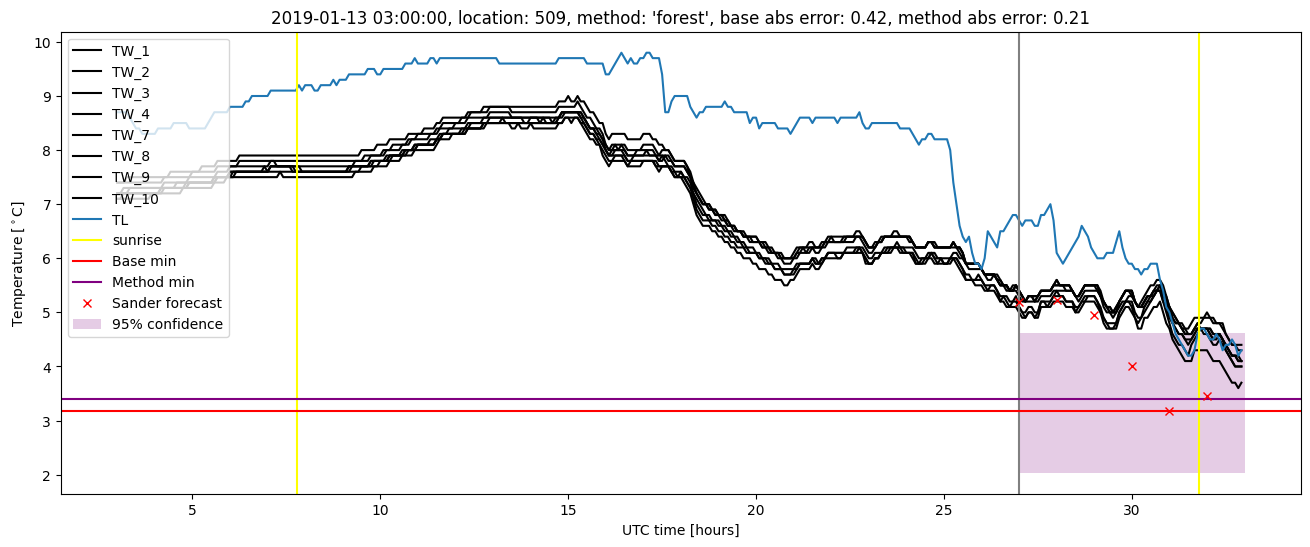
| forest |
winter 2019 |
0.993 |
0.000e+00 |
0.249 |
0.372 |
1.598 |
0.460 |
1.887 |
| baseline |
all |
0.984 |
0.039 |
0.518 |
0.495 |
3.994 |
NaN |
NaN |
| forest |
all |
0.984 |
0.039 |
0.502 |
0.479 |
4.114 |
0.468 |
2.255 |
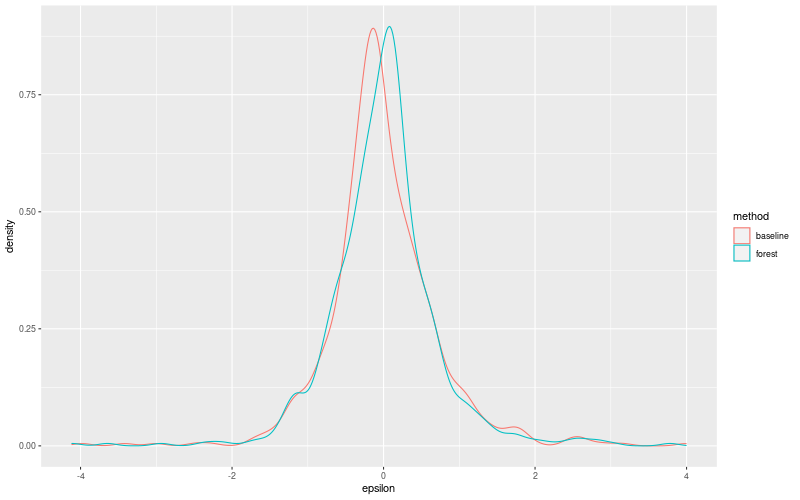
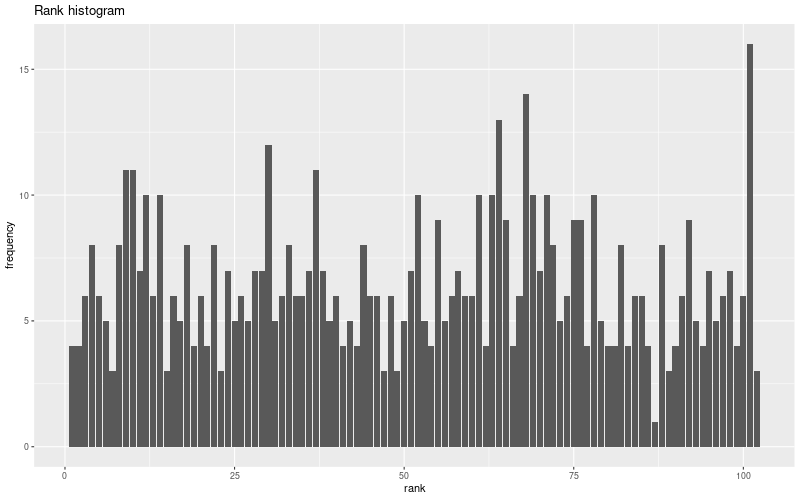
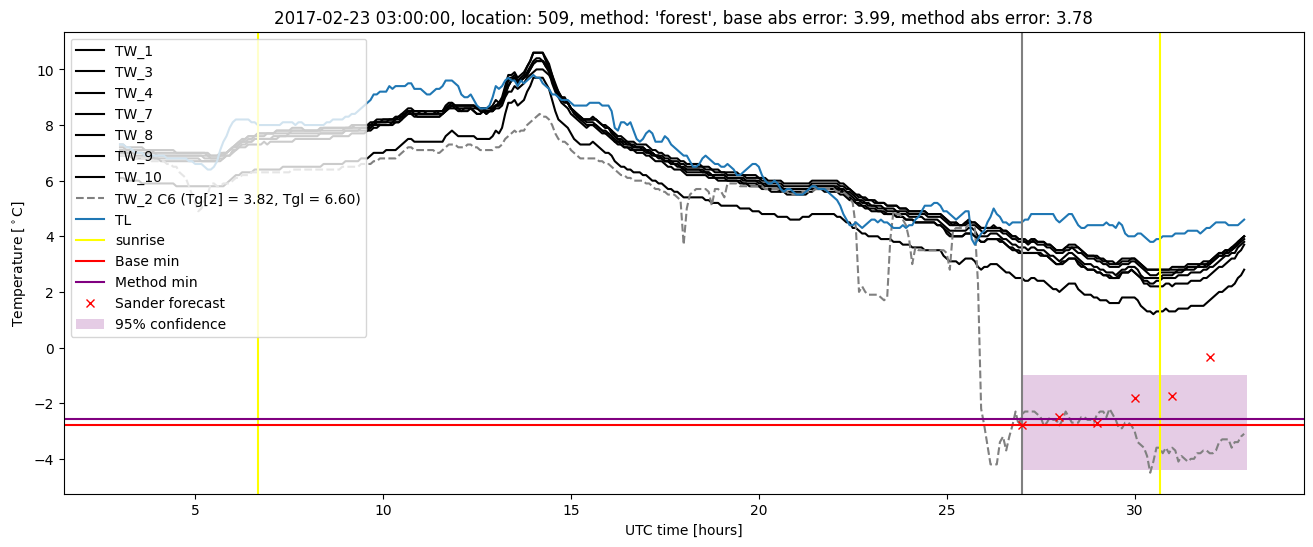
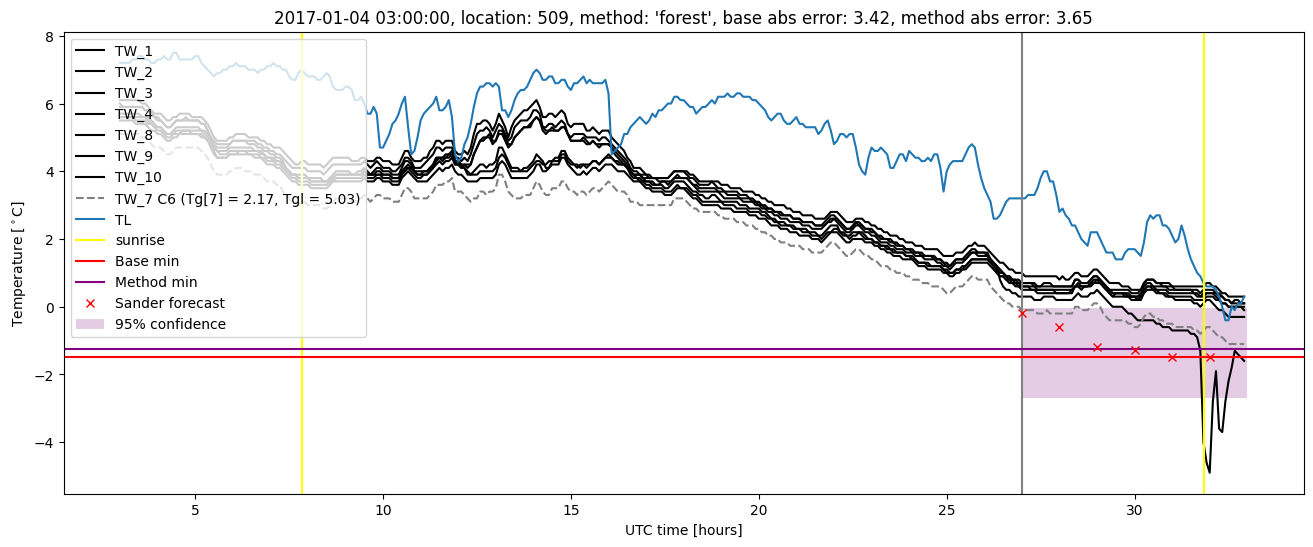
Random forest plots


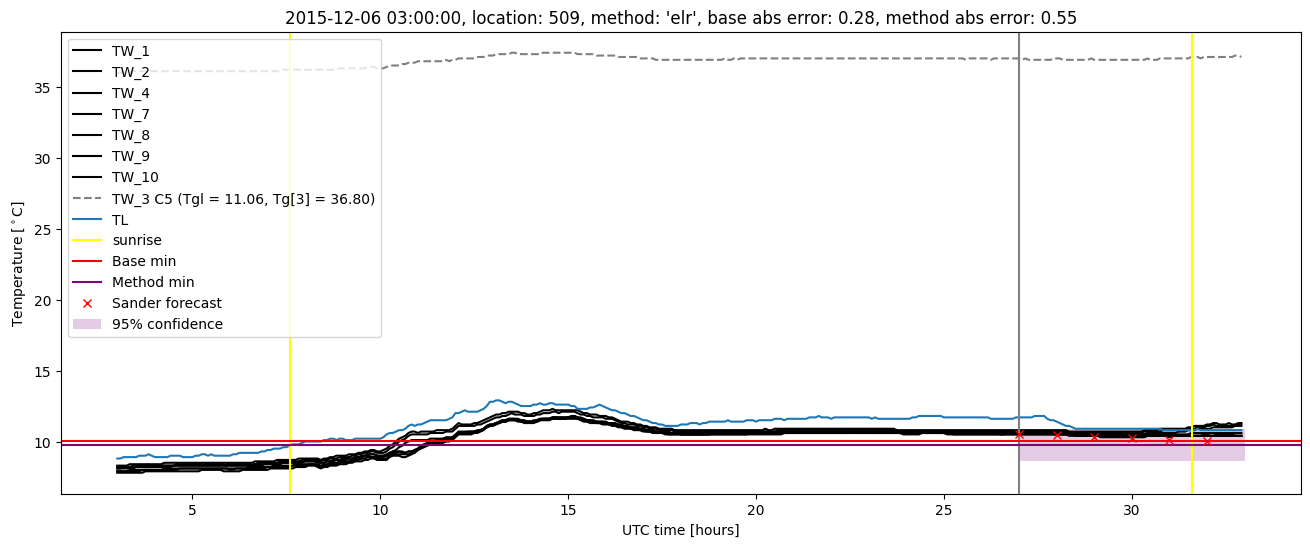
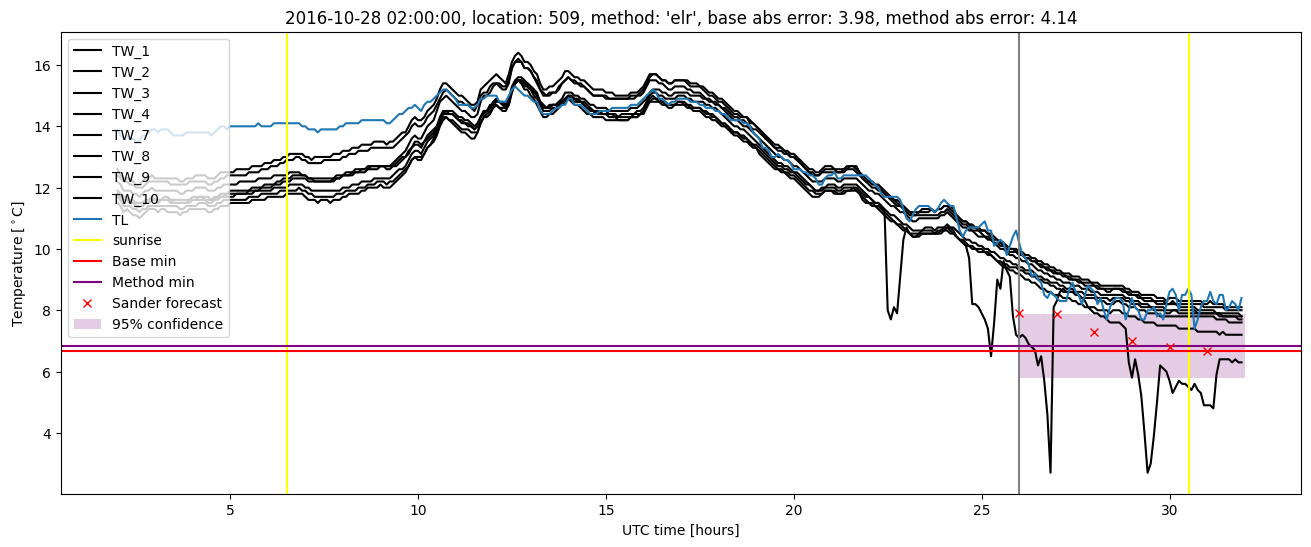
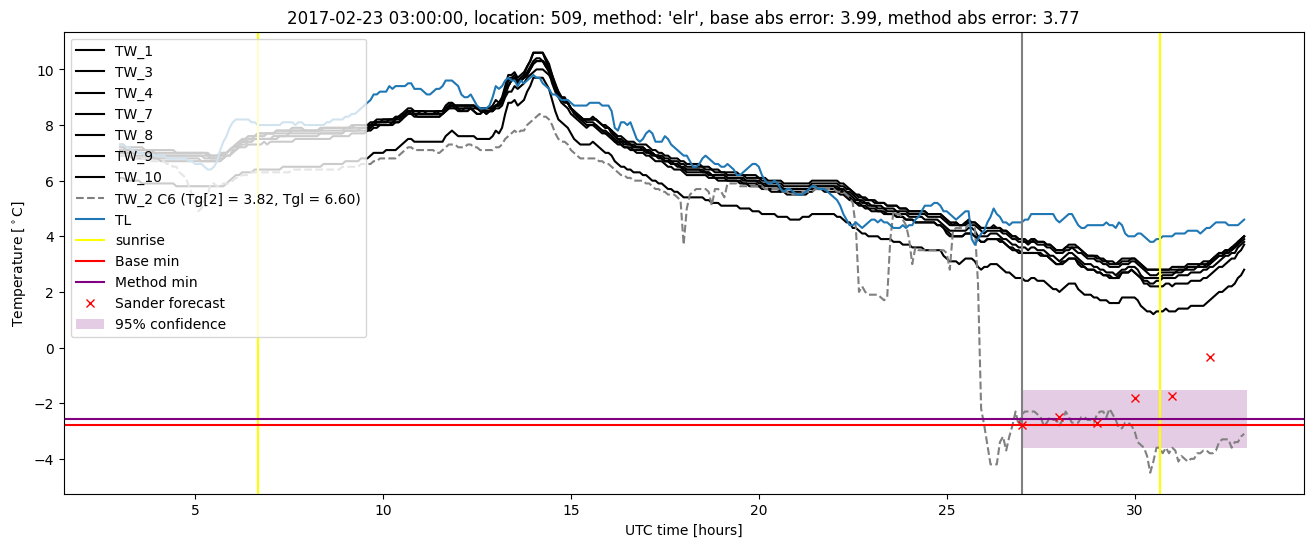
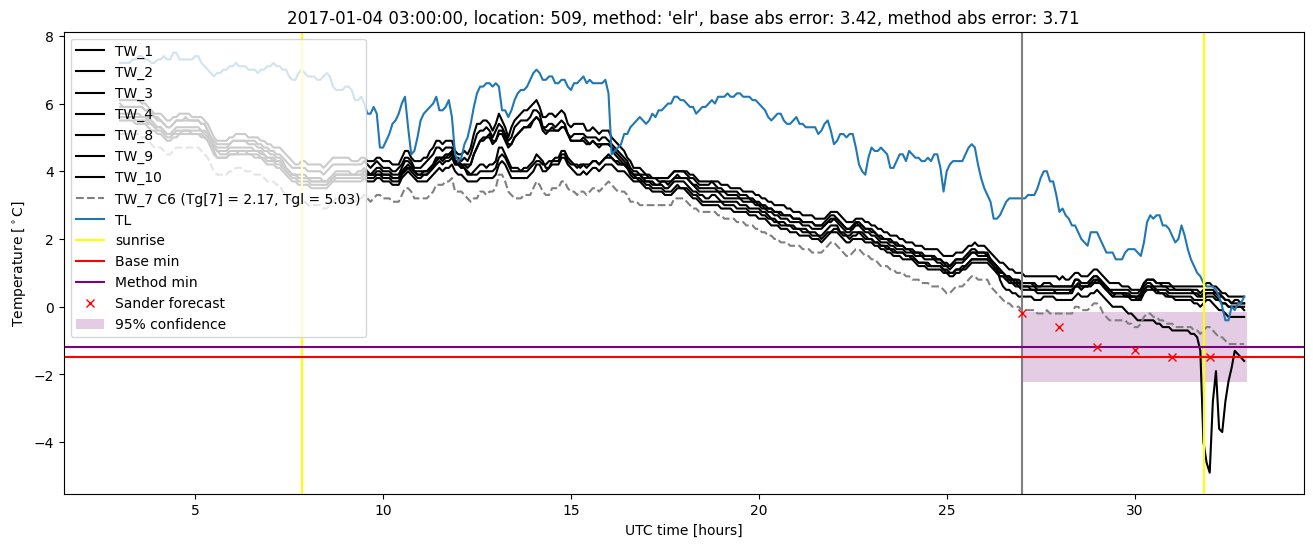
Extended logistic regression results
| names |
period |
power |
significance |
meanSquareError |
absError |
maxError |
CRPS |
IGN |
| baseline |
winter 2016 |
0.994 |
0.105 |
0.407 |
0.460 |
3.154 |
NaN |
NaN |
| elr |
winter 2016 |
0.988 |
0.053 |
0.397 |
0.463 |
2.986 |
0.539 |
2.022 |
| baseline |
winter 2017 |
0.956 |
0.000e+00 |
0.811 |
0.606 |
3.994 |
NaN |
NaN |
| elr |
winter 2017 |
0.965 |
0.000e+00 |
0.796 |
0.570 |
4.139 |
0.480 |
2.072 |
| baseline |
winter 2018 |
0.986 |
0.062 |
0.633 |
0.547 |
3.005 |
NaN |
NaN |
| elr |
winter 2018 |
0.979 |
0.125 |
0.673 |
0.558 |
3.030 |
0.538 |
2.512 |
| baseline |
winter 2019 |
0.993 |
0.000e+00 |
0.217 |
0.360 |
1.700 |
NaN |
NaN |
| elr |
winter 2019 |
0.993 |
0.000e+00 |
0.206 |
0.348 |
1.262 |
0.487 |
1.560 |
| baseline |
all |
0.984 |
0.039 |
0.518 |
0.495 |
3.994 |
NaN |
NaN |
| elr |
all |
0.982 |
0.049 |
0.520 |
0.487 |
4.139 |
0.514 |
2.061 |
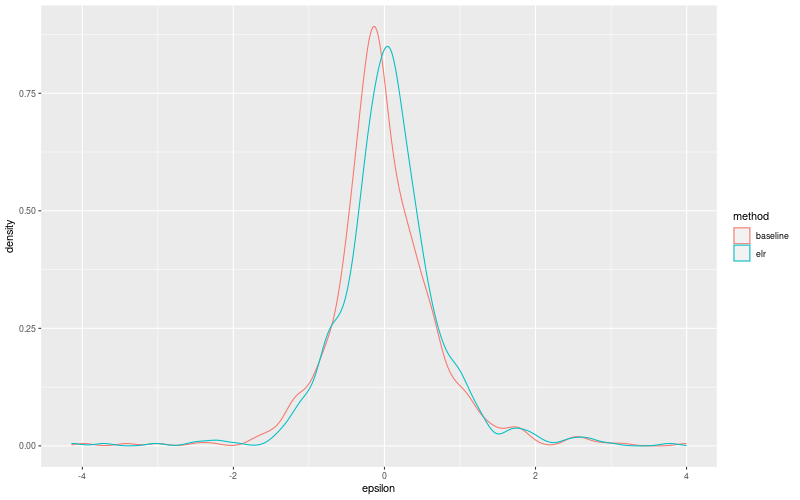
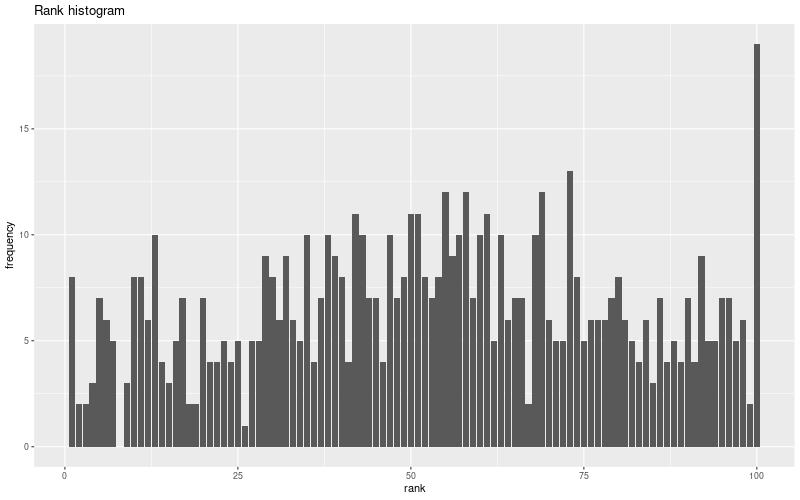
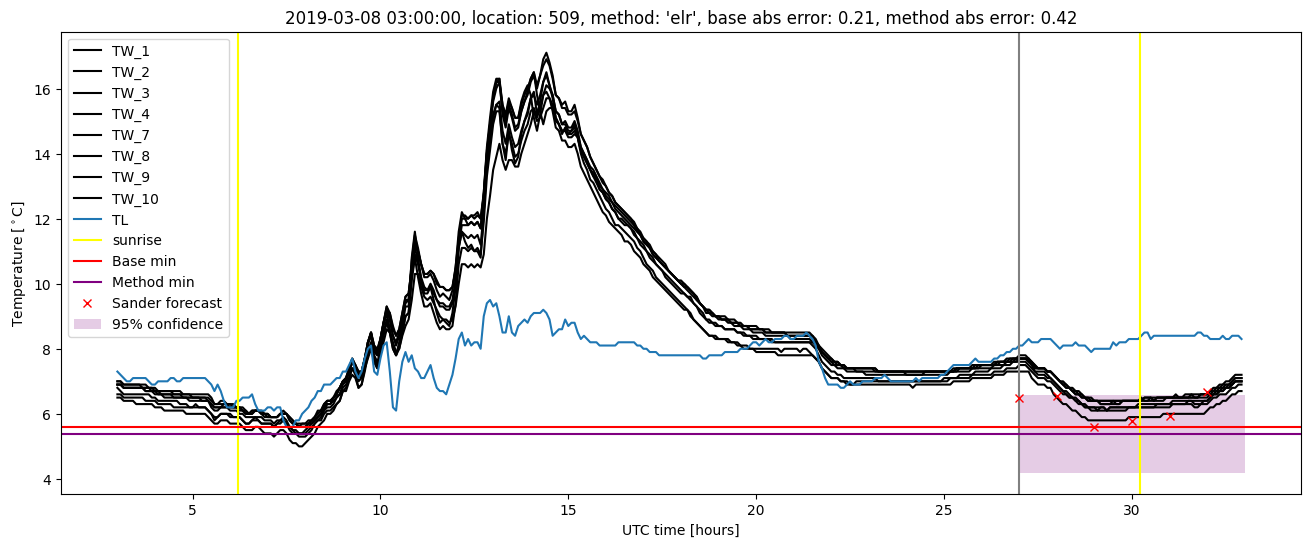
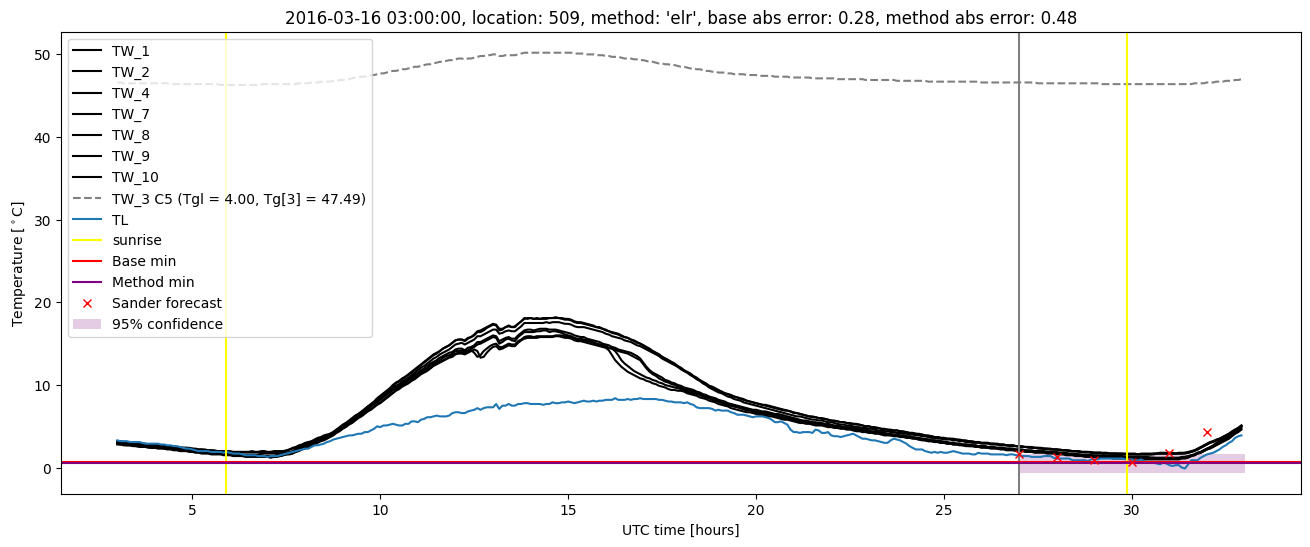
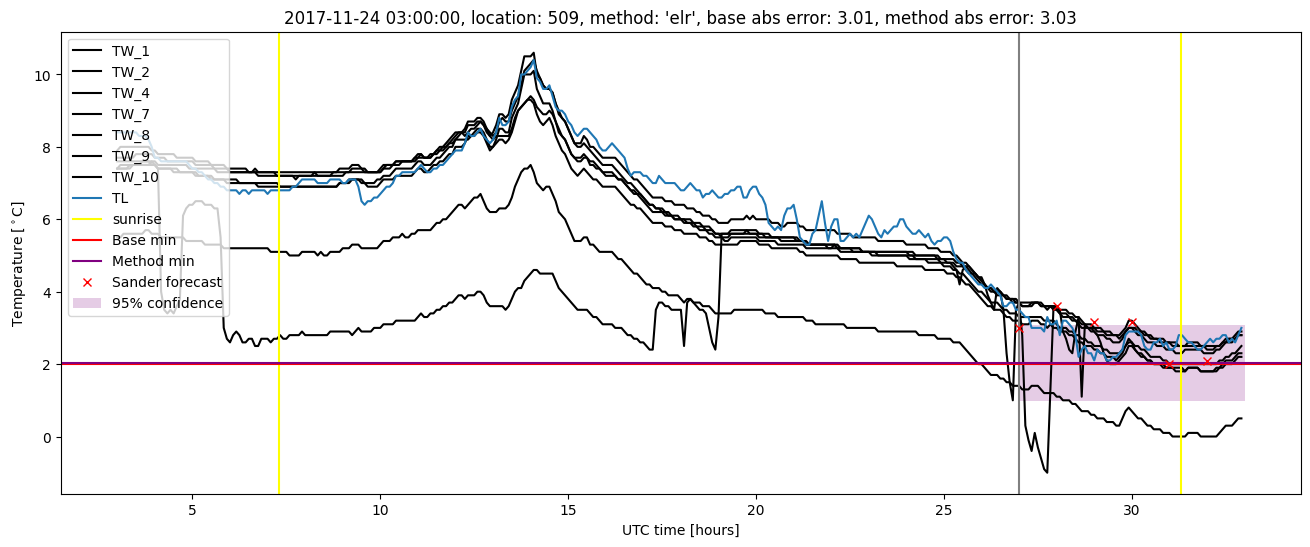
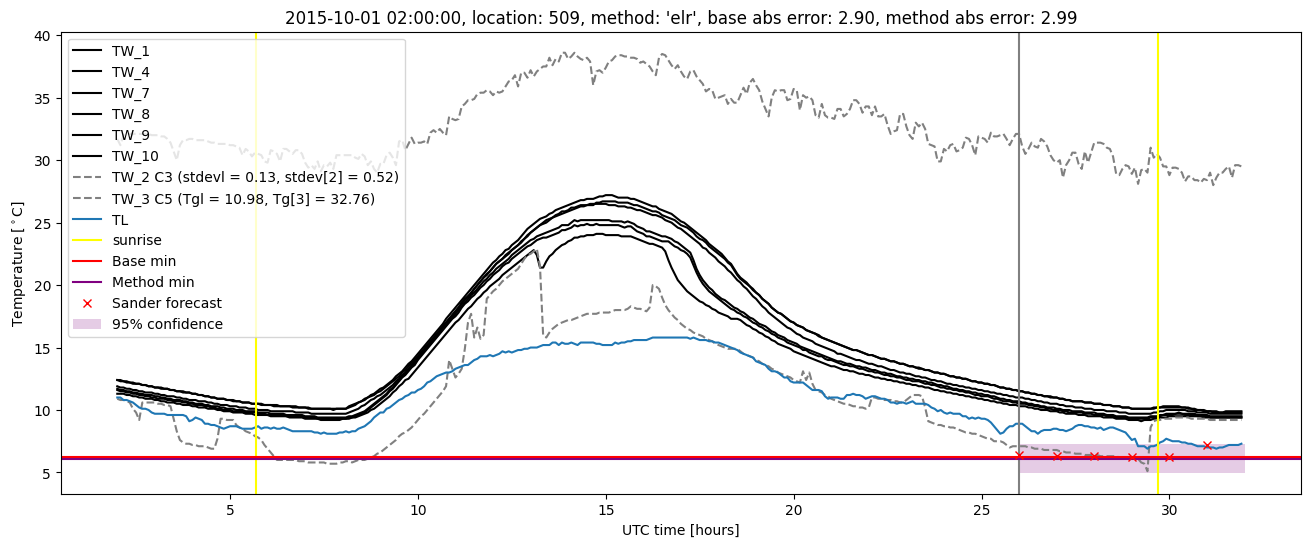
Extended logistic regression plots