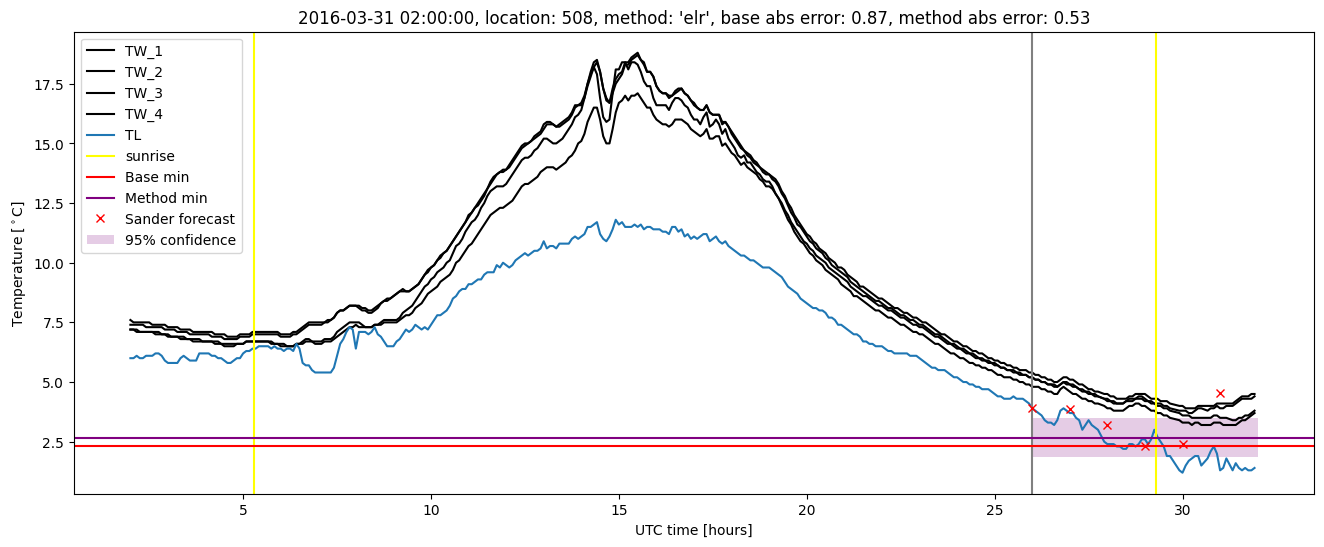
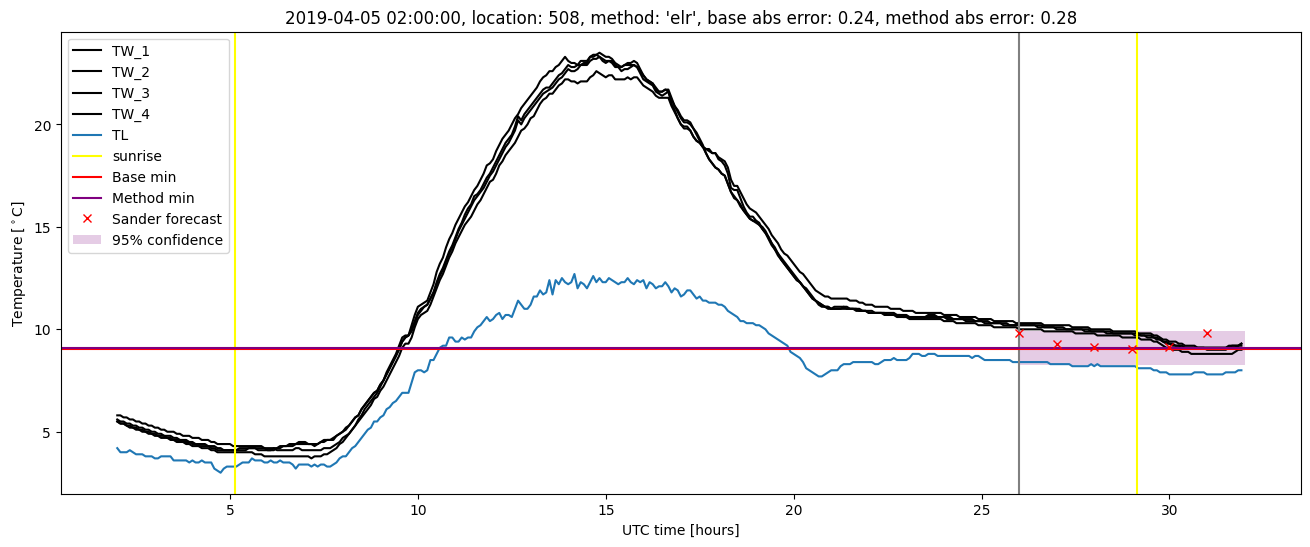
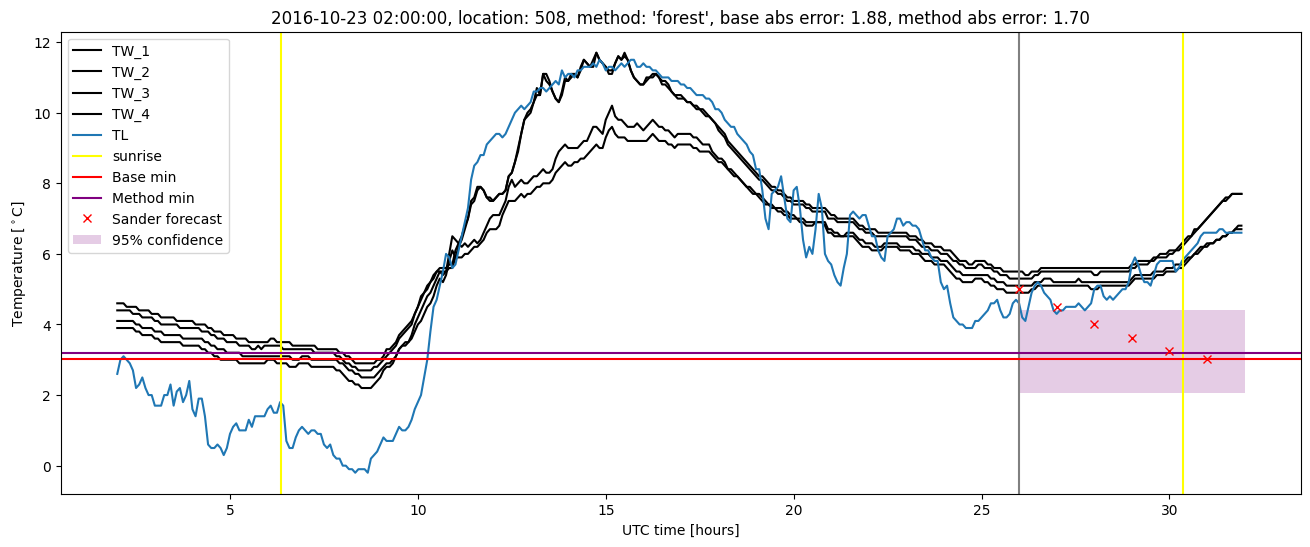
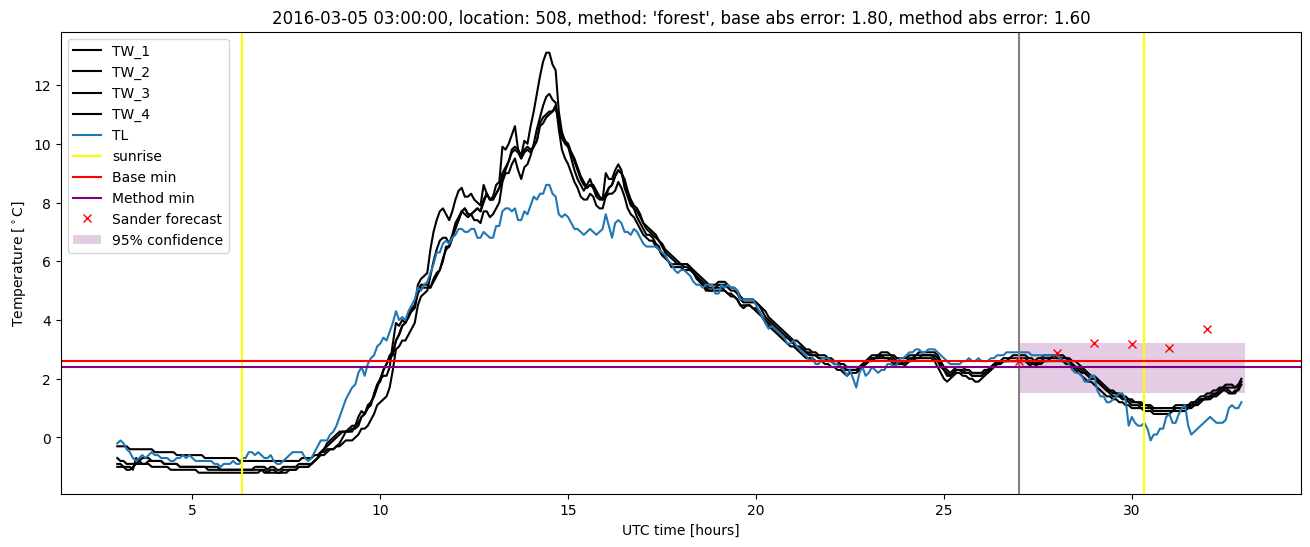
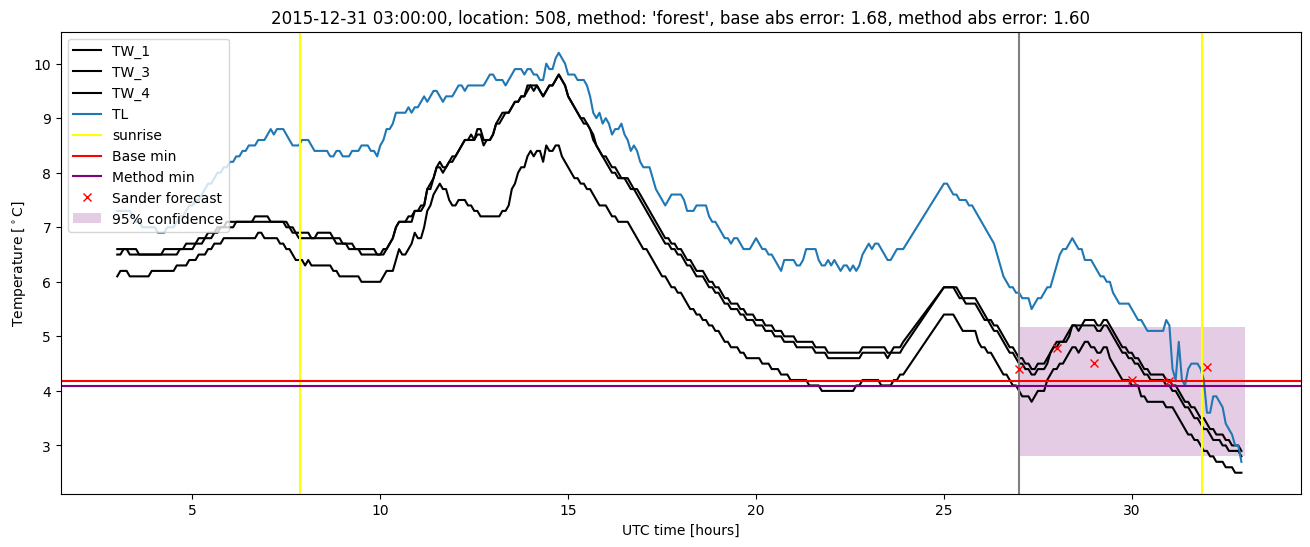
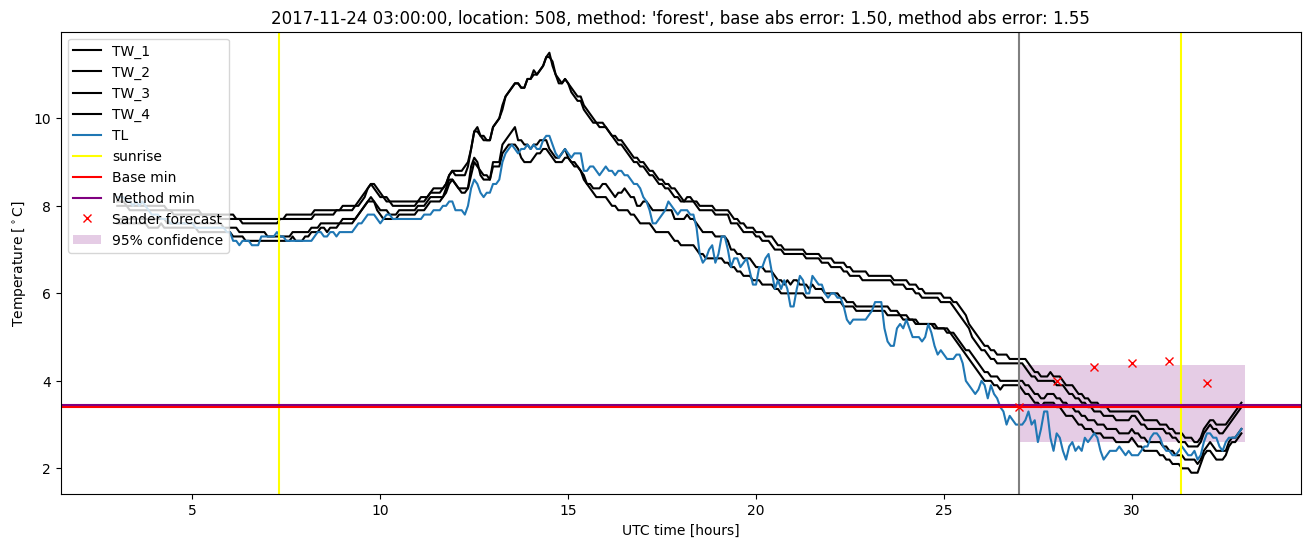
GMS location: 508
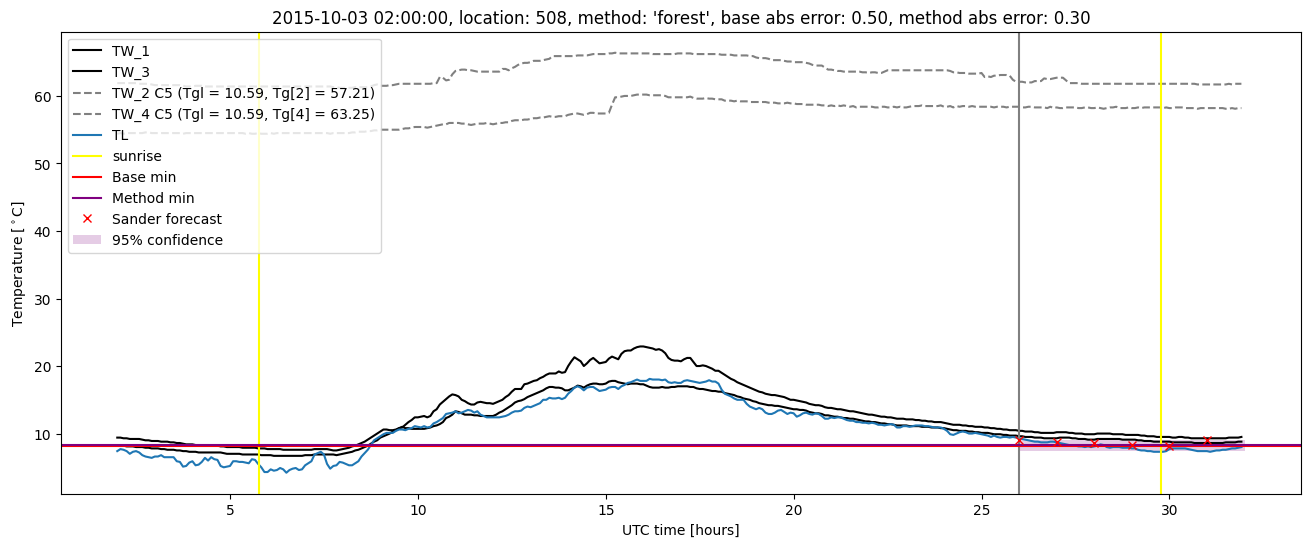
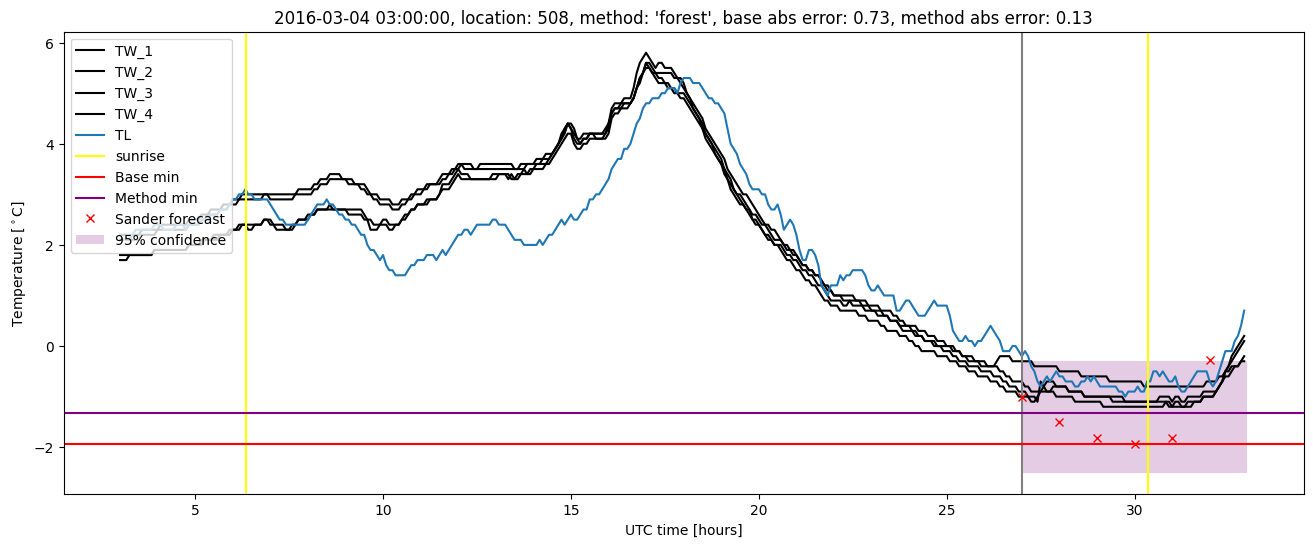
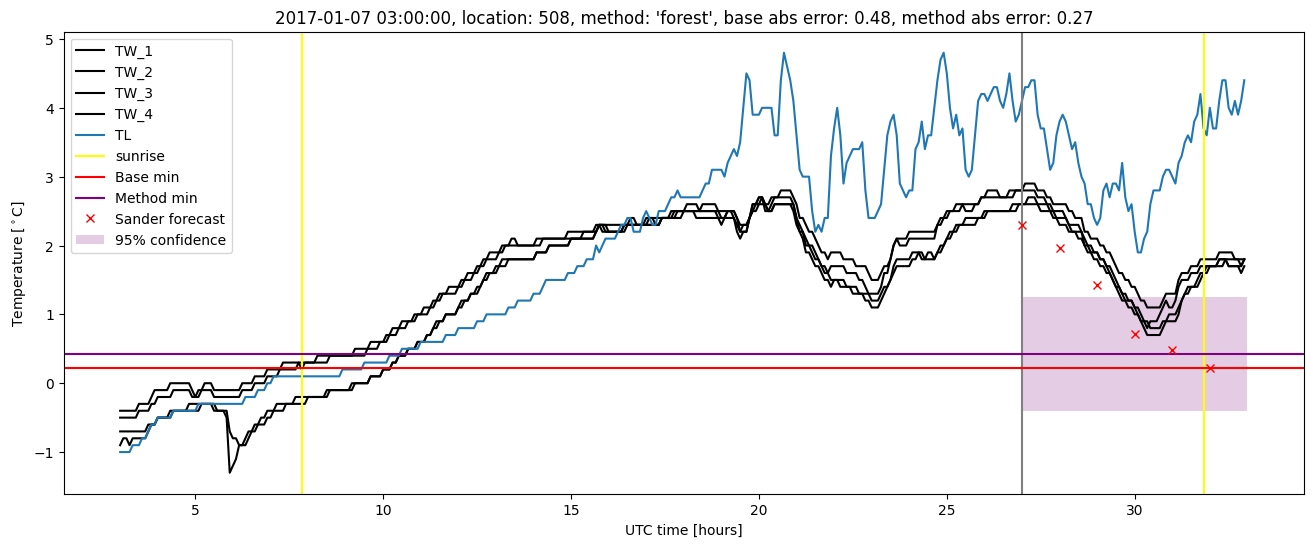
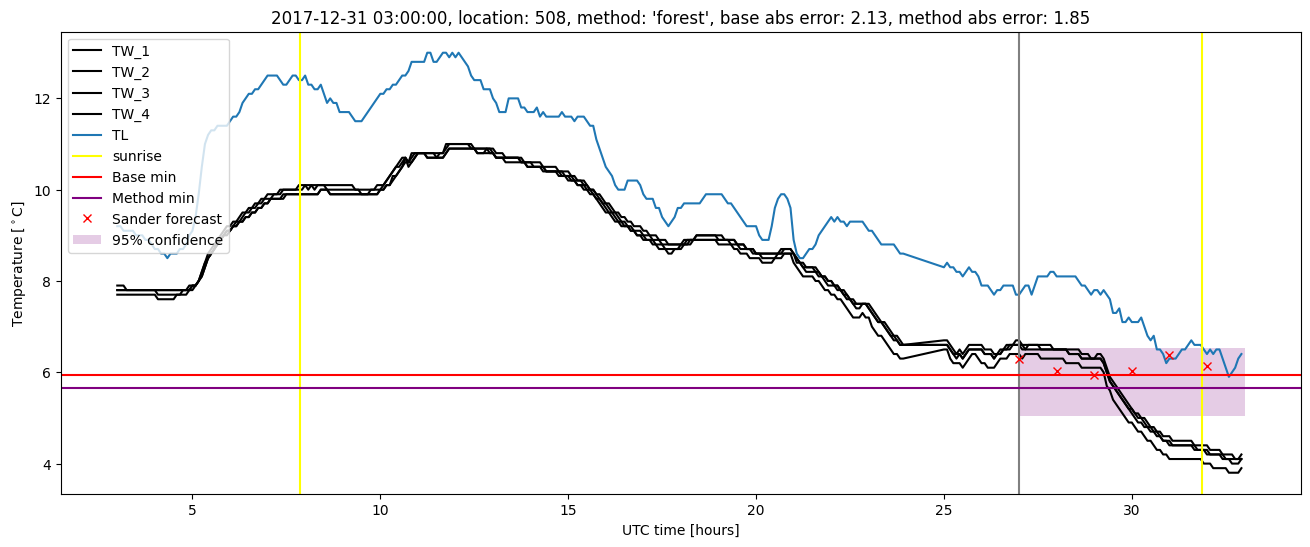
Random forest results
| names |
period |
power |
significance |
meanSquareError |
absError |
maxError |
CRPS |
IGN |
| baseline |
winter 2016 |
0.989 |
0.056 |
0.359 |
0.470 |
1.799 |
NaN |
NaN |
| forest |
winter 2016 |
0.989 |
0.056 |
0.274 |
0.400 |
1.599 |
0.480 |
4.015 |
| baseline |
winter 2017 |
0.968 |
0.000e+00 |
0.395 |
0.480 |
2.054 |
NaN |
NaN |
| forest |
winter 2017 |
0.952 |
0.000e+00 |
0.282 |
0.404 |
1.697 |
0.484 |
3.735 |
| baseline |
winter 2018 |
1.000 |
0.207 |
0.332 |
0.440 |
2.131 |
NaN |
NaN |
| forest |
winter 2018 |
1.000 |
0.207 |
0.269 |
0.396 |
1.852 |
0.495 |
3.275 |
| baseline |
winter 2019 |
0.993 |
0.091 |
0.247 |
0.364 |
1.974 |
NaN |
NaN |
| forest |
winter 2019 |
0.993 |
0.091 |
0.210 |
0.353 |
1.228 |
0.476 |
2.953 |
| baseline |
all |
0.989 |
0.093 |
0.334 |
0.440 |
2.131 |
NaN |
NaN |
| forest |
all |
0.985 |
0.093 |
0.260 |
0.389 |
1.852 |
0.484 |
3.520 |
Random forest plots
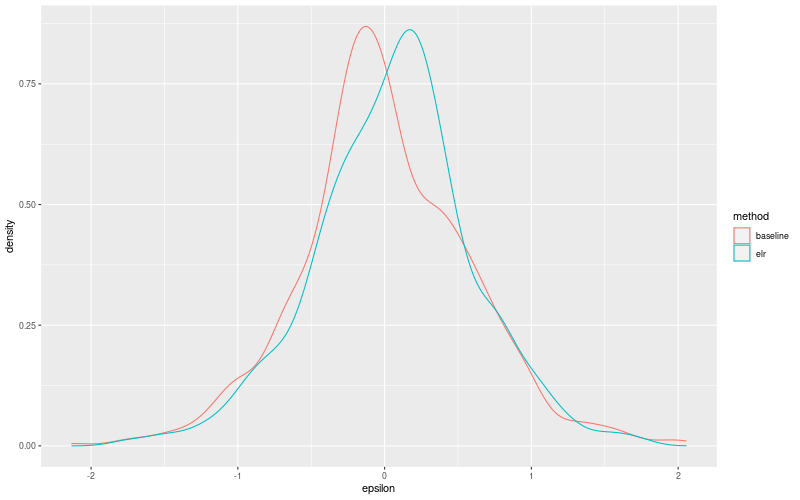
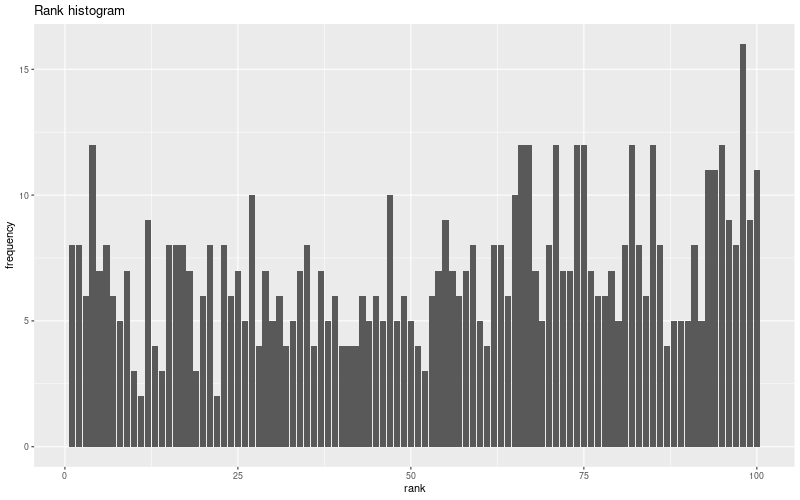
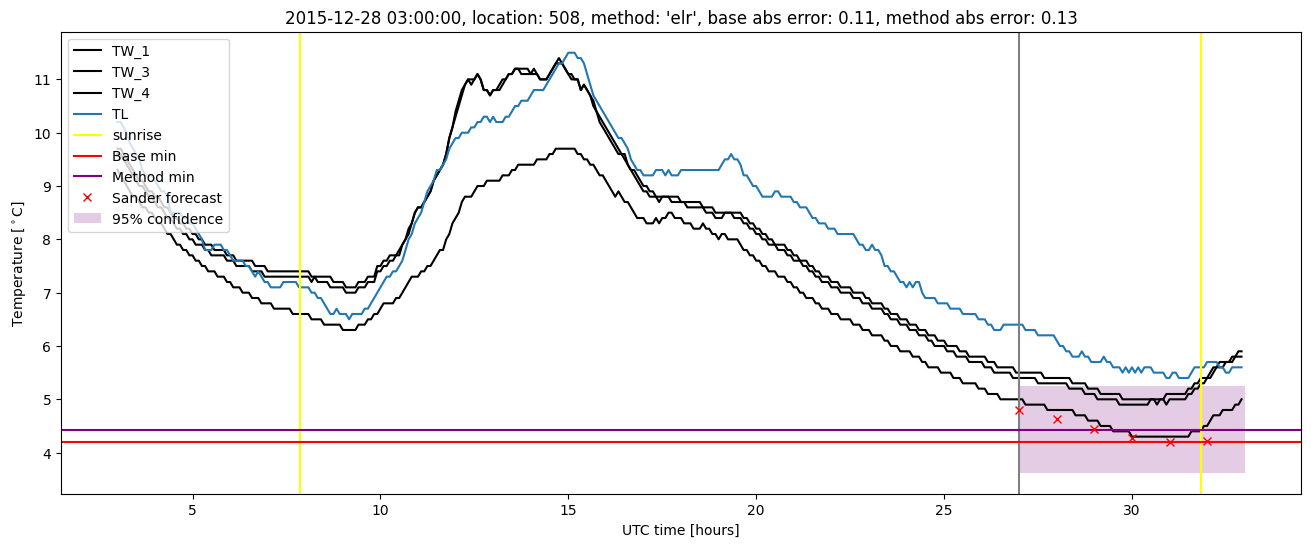
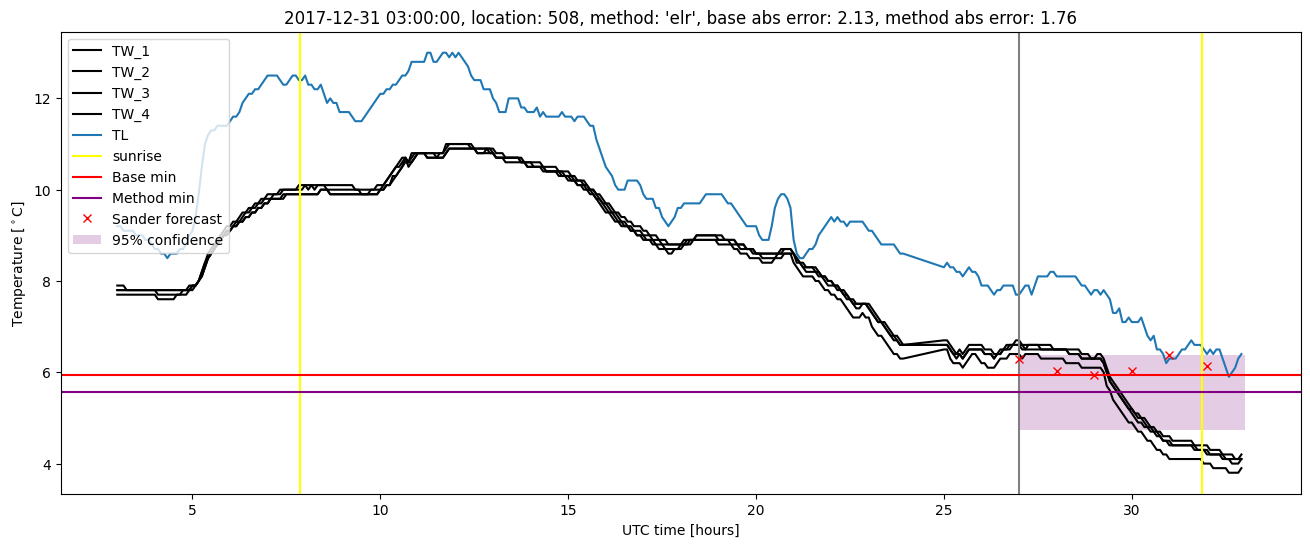
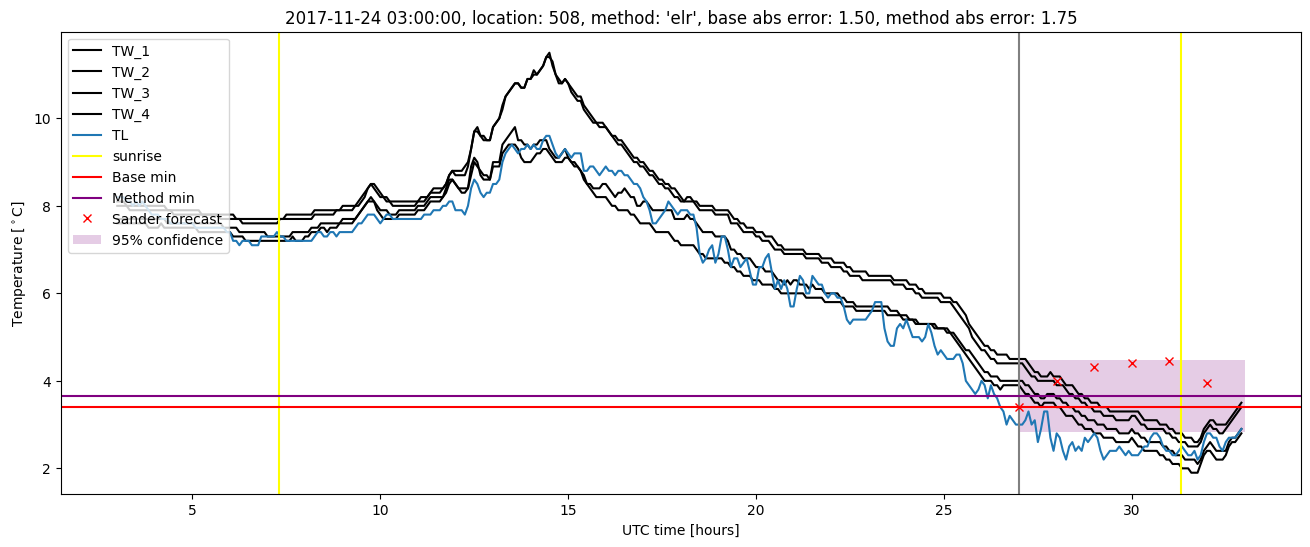
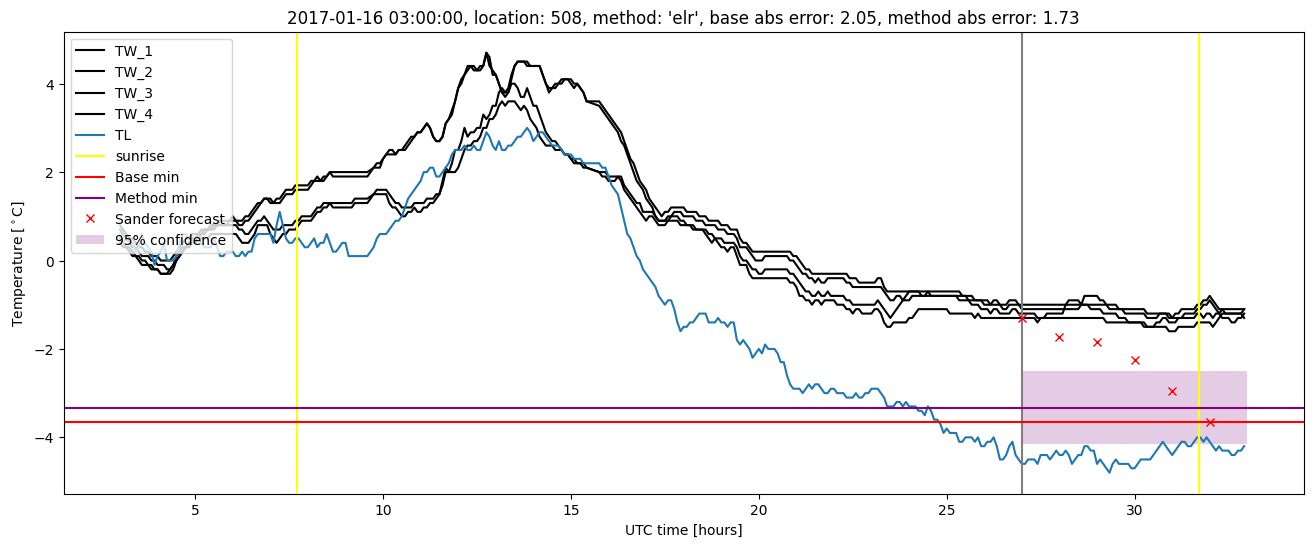
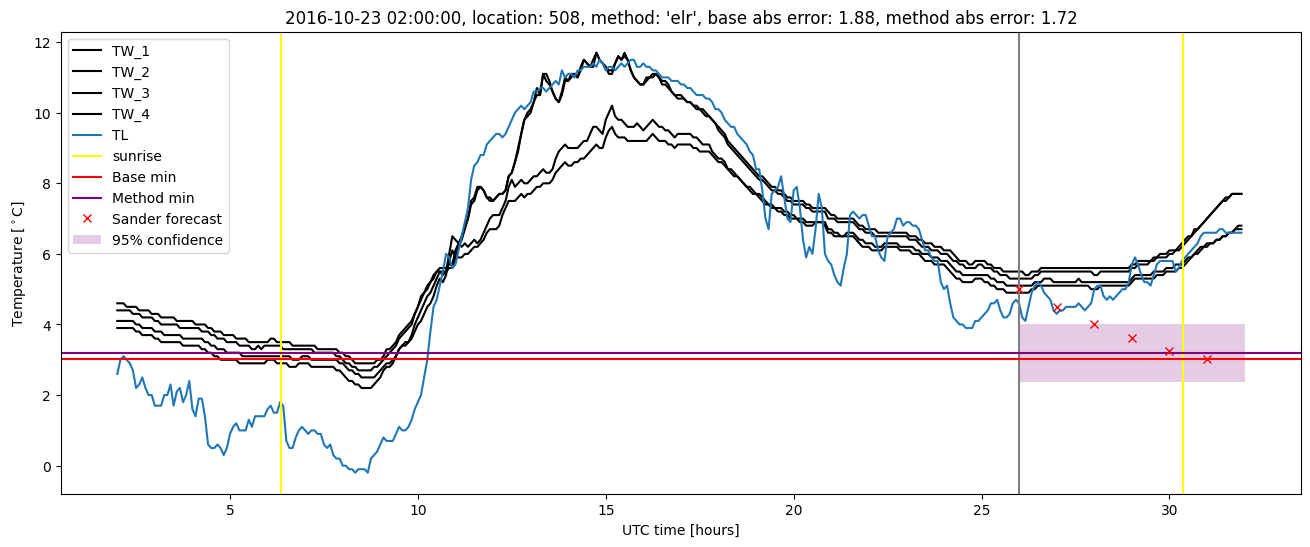
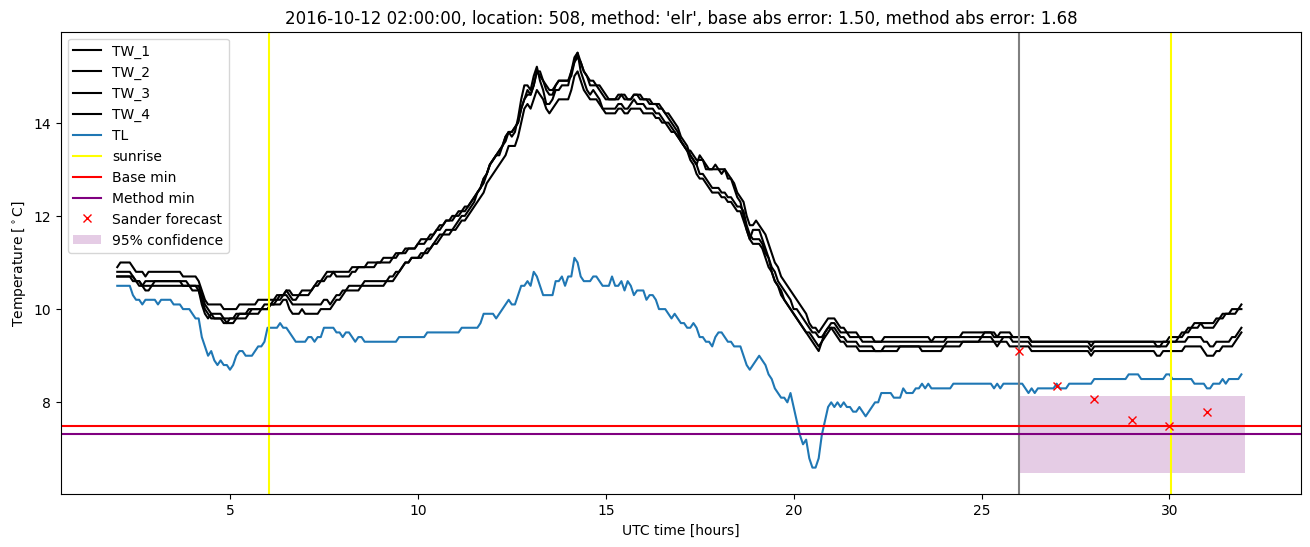
Extended logistic regression results
| names |
period |
power |
significance |
meanSquareError |
absError |
maxError |
CRPS |
IGN |
| baseline |
winter 2016 |
0.989 |
0.056 |
0.359 |
0.470 |
1.799 |
NaN |
NaN |
| elr |
winter 2016 |
0.989 |
0.056 |
0.302 |
0.423 |
1.595 |
0.573 |
6.378 |
| baseline |
winter 2017 |
0.968 |
0.000e+00 |
0.395 |
0.480 |
2.054 |
NaN |
NaN |
| elr |
winter 2017 |
0.960 |
0.000e+00 |
0.343 |
0.449 |
1.732 |
0.528 |
5.267 |
| baseline |
winter 2018 |
1.000 |
0.207 |
0.332 |
0.440 |
2.131 |
NaN |
NaN |
| elr |
winter 2018 |
1.000 |
0.172 |
0.275 |
0.401 |
1.764 |
0.576 |
6.152 |
| baseline |
winter 2019 |
0.993 |
0.091 |
0.247 |
0.364 |
1.974 |
NaN |
NaN |
| elr |
winter 2019 |
0.993 |
0.091 |
0.277 |
0.421 |
1.279 |
0.563 |
5.335 |
| baseline |
all |
0.989 |
0.093 |
0.334 |
0.440 |
2.131 |
NaN |
NaN |
| elr |
all |
0.987 |
0.081 |
0.298 |
0.422 |
1.764 |
0.562 |
5.839 |
Extended logistic regression plots