GMS location: 505
Random forest results
| names |
period |
power |
significance |
meanSquareError |
absError |
maxError |
CRPS |
IGN |
| baseline |
winter 2016 |
0.994 |
0.091 |
0.484 |
0.533 |
2.400 |
NaN |
NaN |
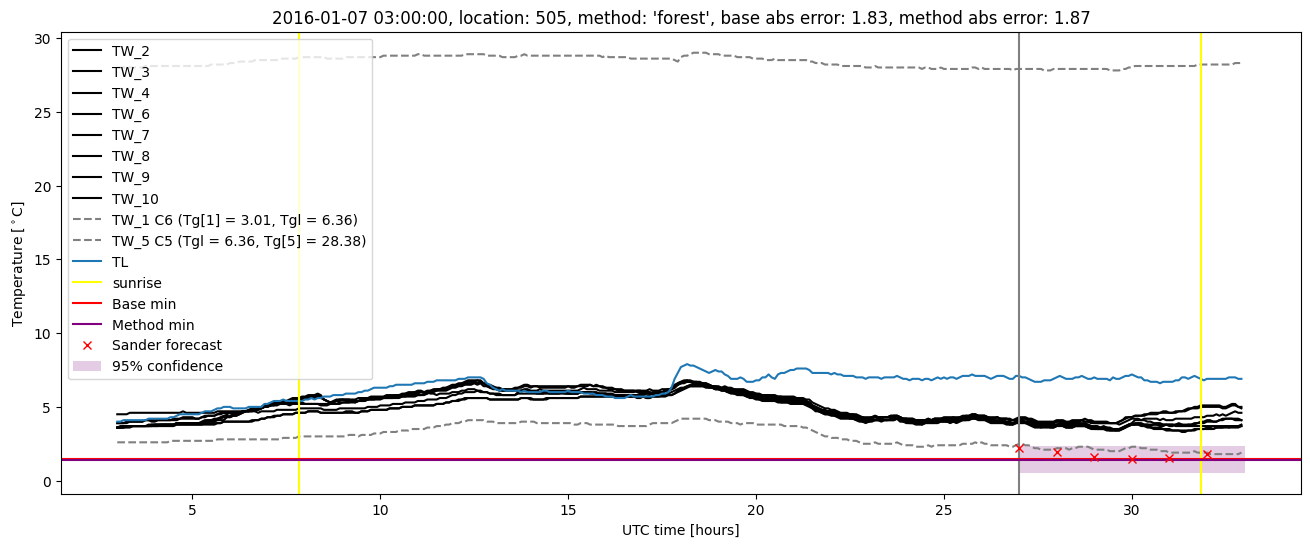
| forest |
winter 2016 |
0.994 |
0.136 |
0.383 |
0.459 |
2.281 |
0.470 |
4.382 |
| baseline |
winter 2017 |
0.942 |
0.035 |
0.402 |
0.465 |
2.288 |
NaN |
NaN |
| forest |
winter 2017 |
0.950 |
0.069 |
0.257 |
0.369 |
1.645 |
0.469 |
2.416 |
| baseline |
winter 2018 |
0.993 |
0.100 |
0.325 |
0.436 |
1.570 |
NaN |
NaN |
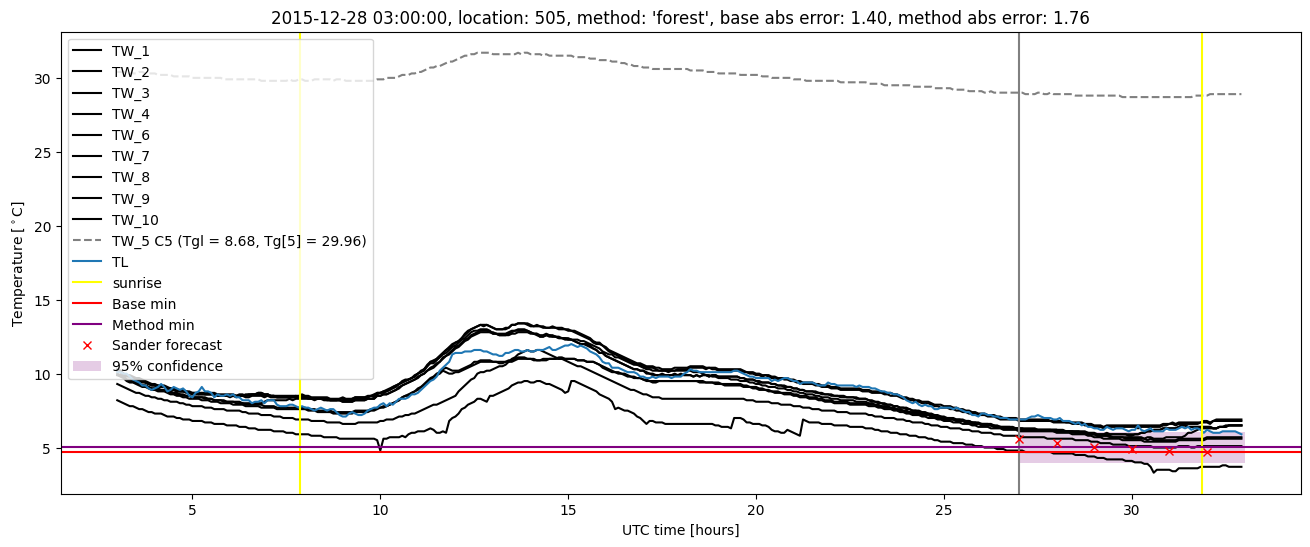
| forest |
winter 2018 |
0.971 |
0.133 |
0.246 |
0.378 |
1.564 |
0.463 |
2.259 |
| baseline |
winter 2019 |
0.993 |
0.000e+00 |
0.311 |
0.428 |
1.800 |
NaN |
NaN |
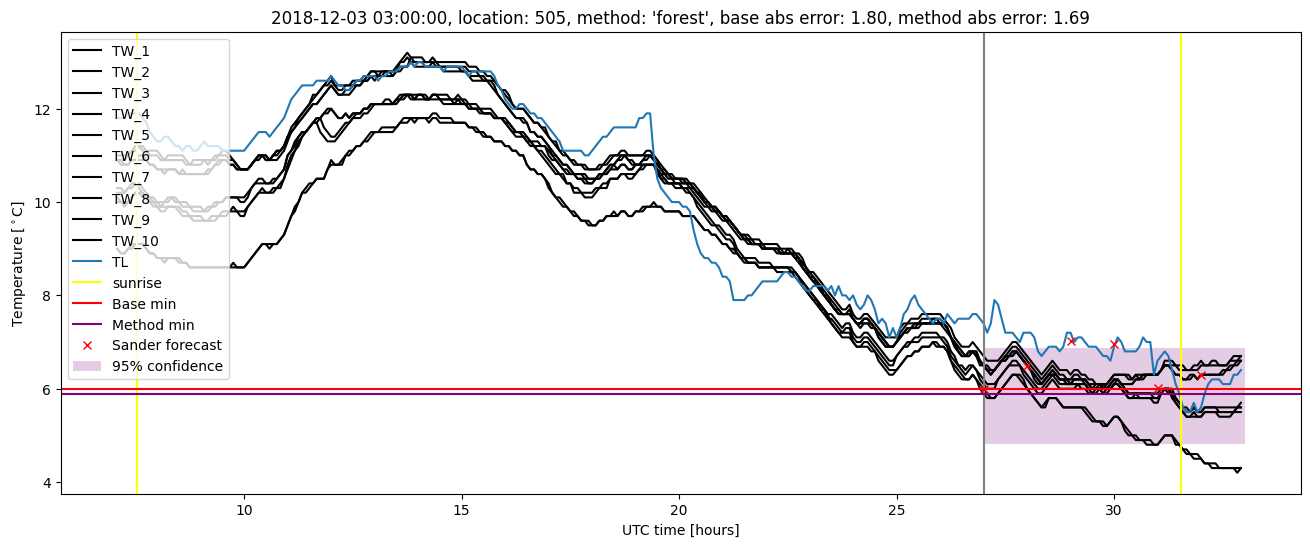
| forest |
winter 2019 |
0.993 |
0.077 |
0.222 |
0.360 |
1.685 |
0.455 |
2.595 |
| baseline |
all |
0.983 |
0.064 |
0.385 |
0.469 |
2.400 |
NaN |
NaN |
| forest |
all |
0.979 |
0.106 |
0.283 |
0.396 |
2.281 |
0.464 |
2.997 |
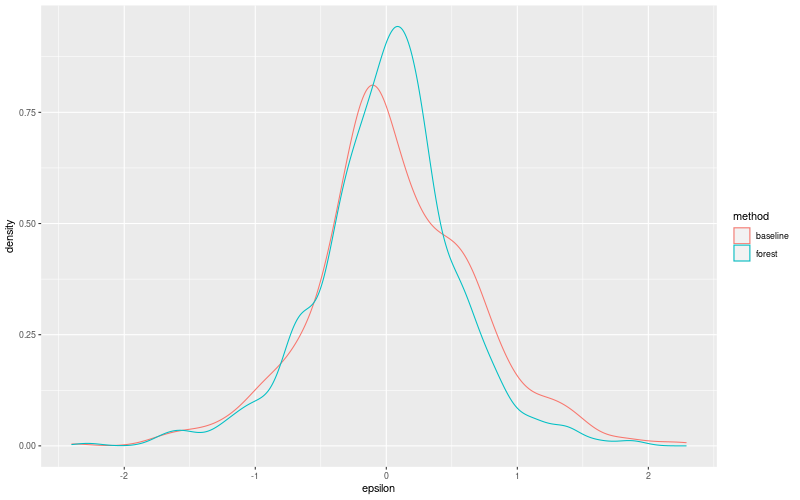
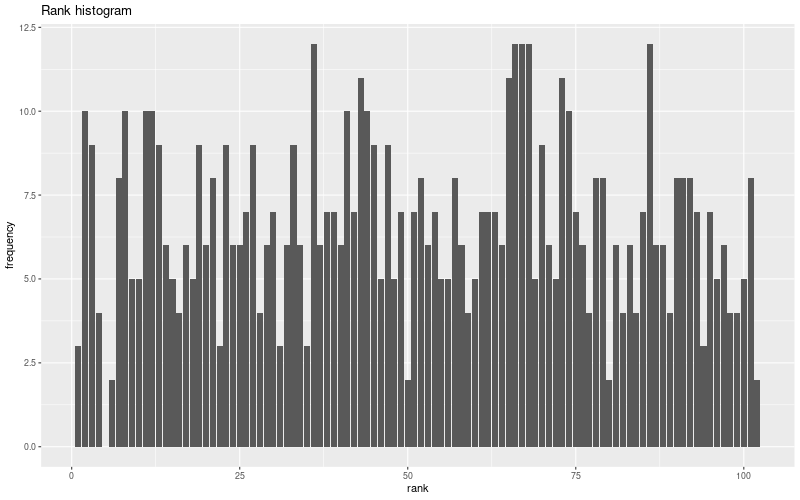
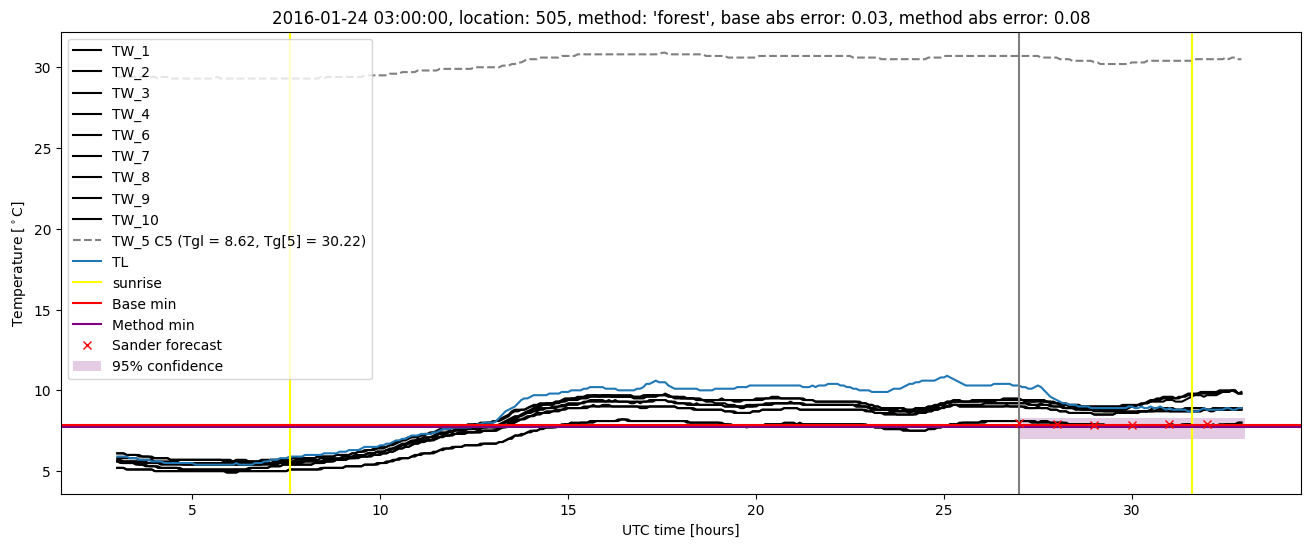
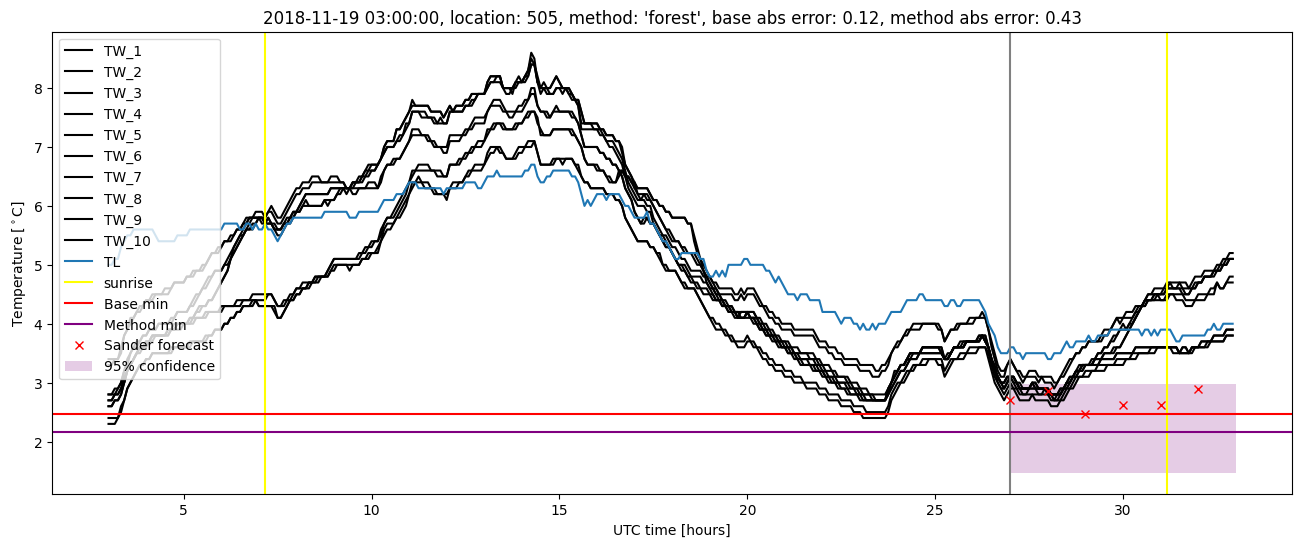
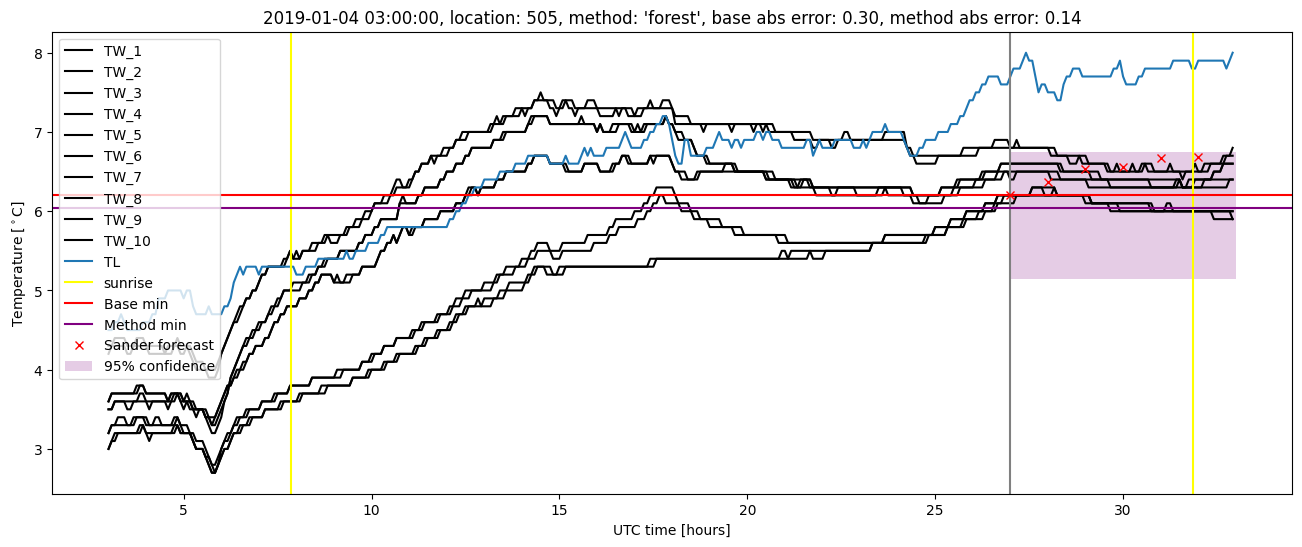
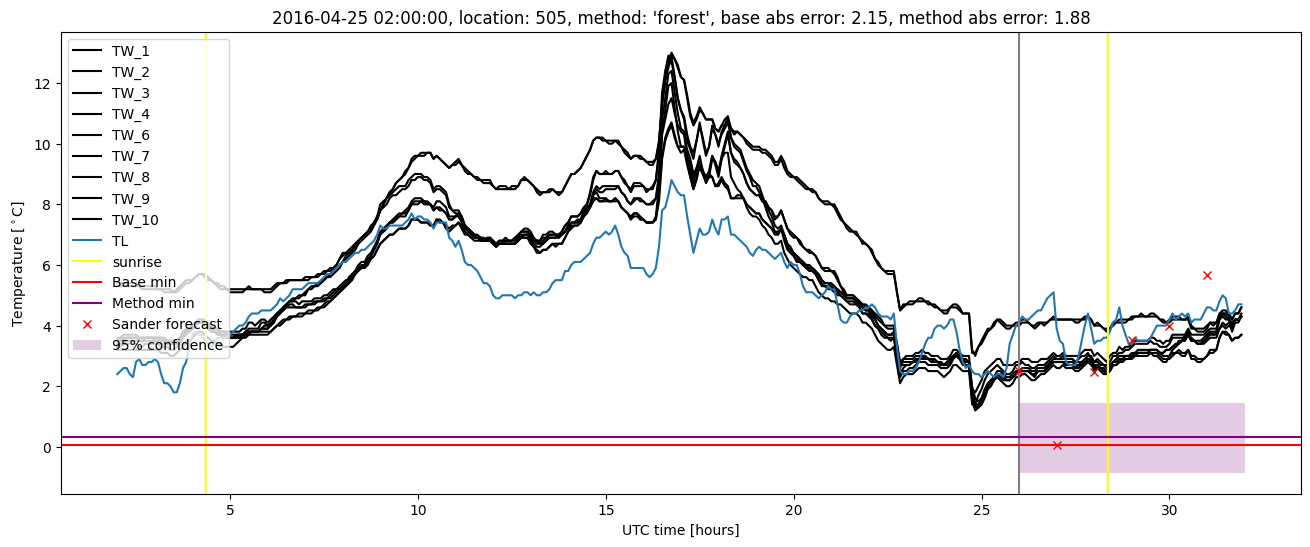
Random forest plots

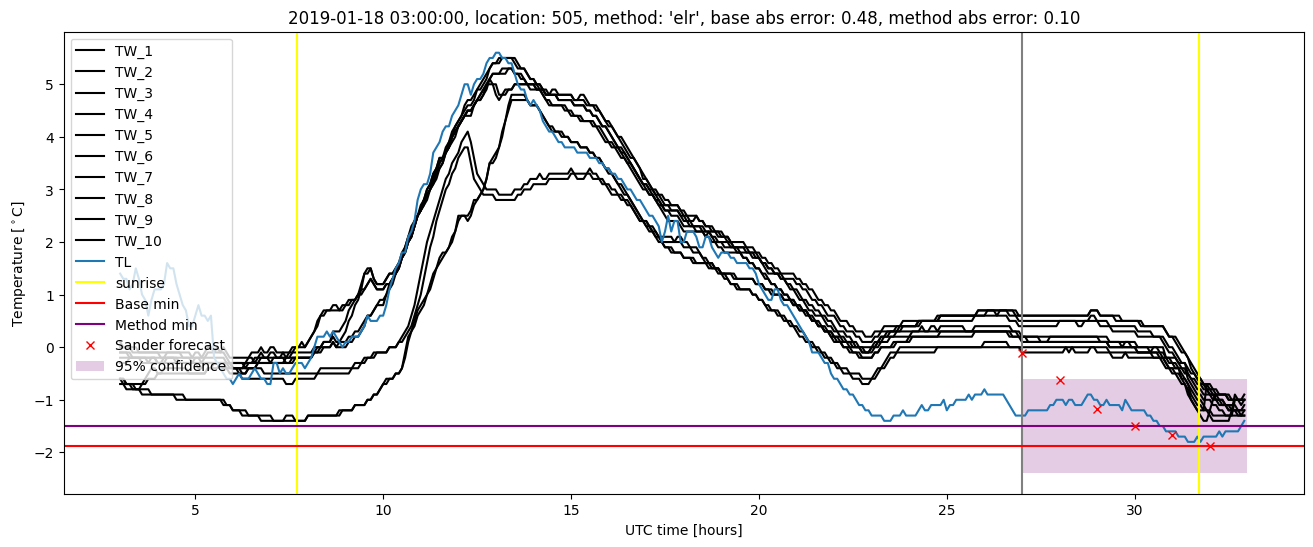
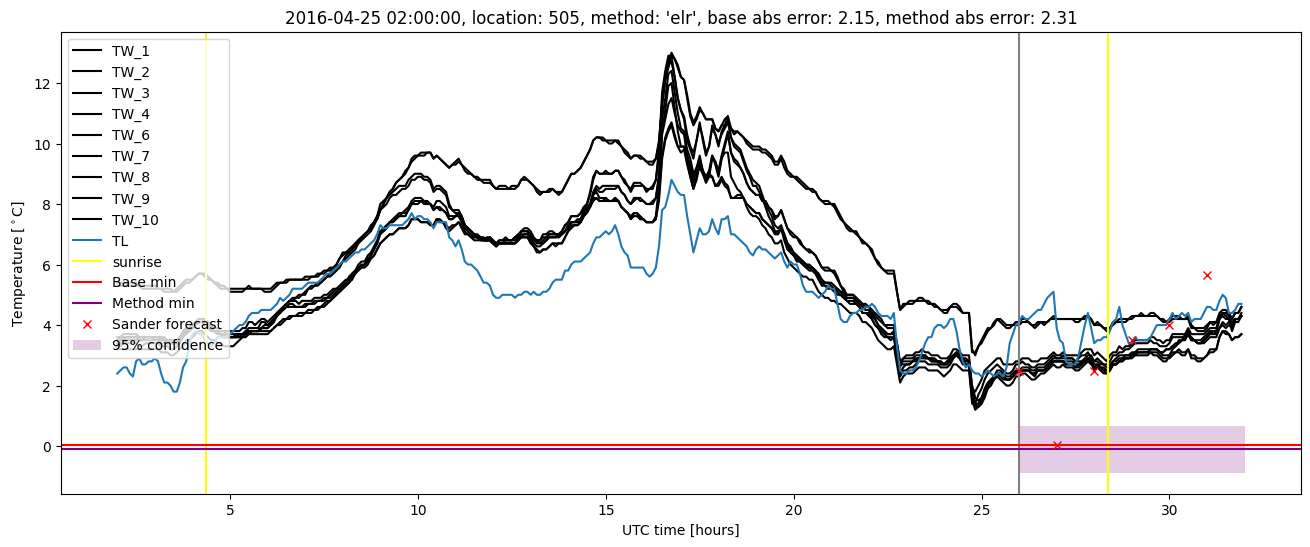
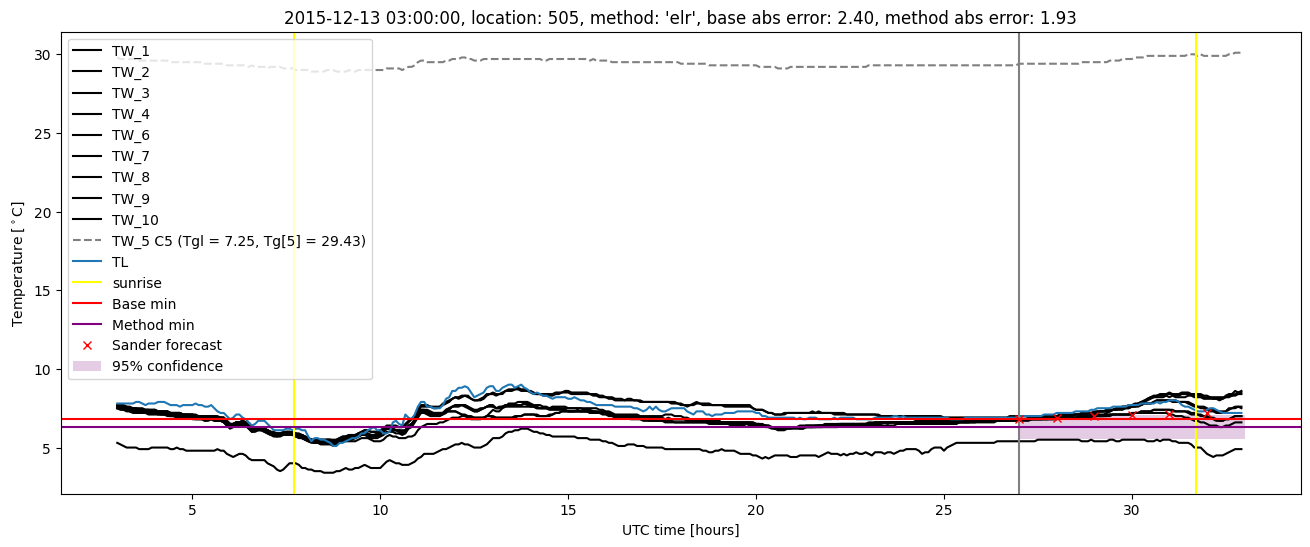
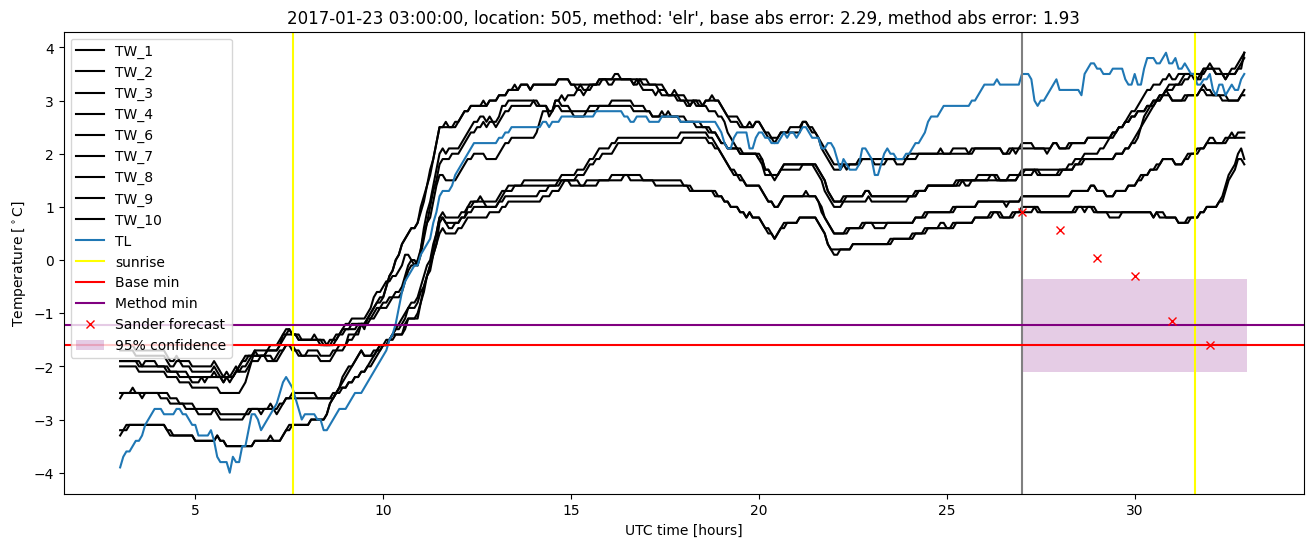
Extended logistic regression results
| names |
period |
power |
significance |
meanSquareError |
absError |
maxError |
CRPS |
IGN |
| baseline |
winter 2016 |
0.994 |
0.091 |
0.484 |
0.533 |
2.400 |
NaN |
NaN |
| elr |
winter 2016 |
0.983 |
0.091 |
0.423 |
0.508 |
2.310 |
0.541 |
6.951 |
| baseline |
winter 2017 |
0.942 |
0.035 |
0.402 |
0.465 |
2.288 |
NaN |
NaN |
| elr |
winter 2017 |
0.942 |
0.069 |
0.314 |
0.413 |
1.929 |
0.510 |
3.930 |
| baseline |
winter 2018 |
0.993 |
0.100 |
0.325 |
0.436 |
1.570 |
NaN |
NaN |
| elr |
winter 2018 |
0.979 |
0.133 |
0.296 |
0.420 |
1.608 |
0.523 |
4.214 |
| baseline |
winter 2019 |
0.993 |
0.000e+00 |
0.311 |
0.428 |
1.800 |
NaN |
NaN |
| elr |
winter 2019 |
0.993 |
0.077 |
0.269 |
0.400 |
1.669 |
0.499 |
3.515 |
| baseline |
all |
0.983 |
0.064 |
0.385 |
0.469 |
2.400 |
NaN |
NaN |
| elr |
all |
0.976 |
0.096 |
0.331 |
0.440 |
2.310 |
0.520 |
4.793 |
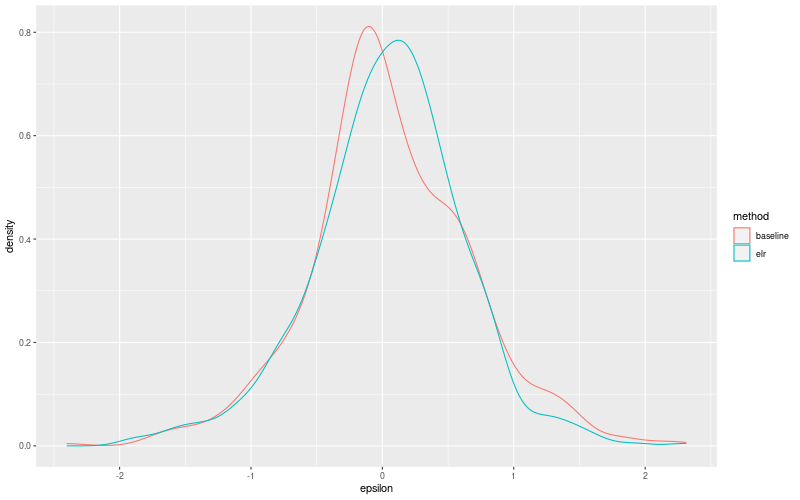
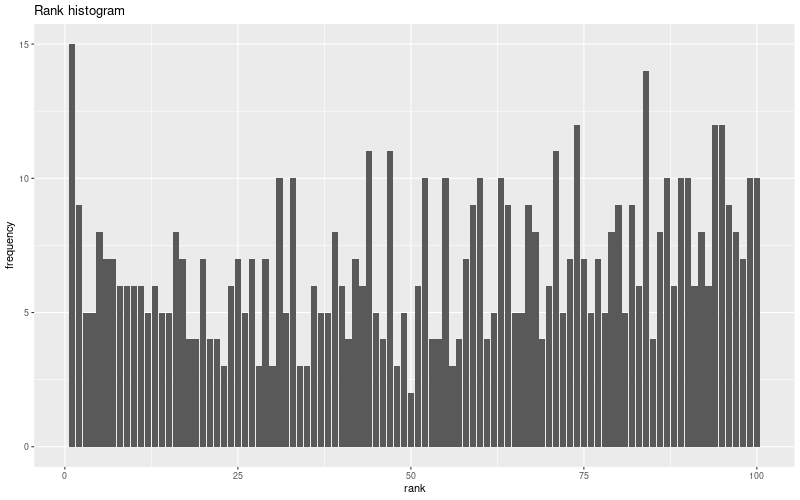
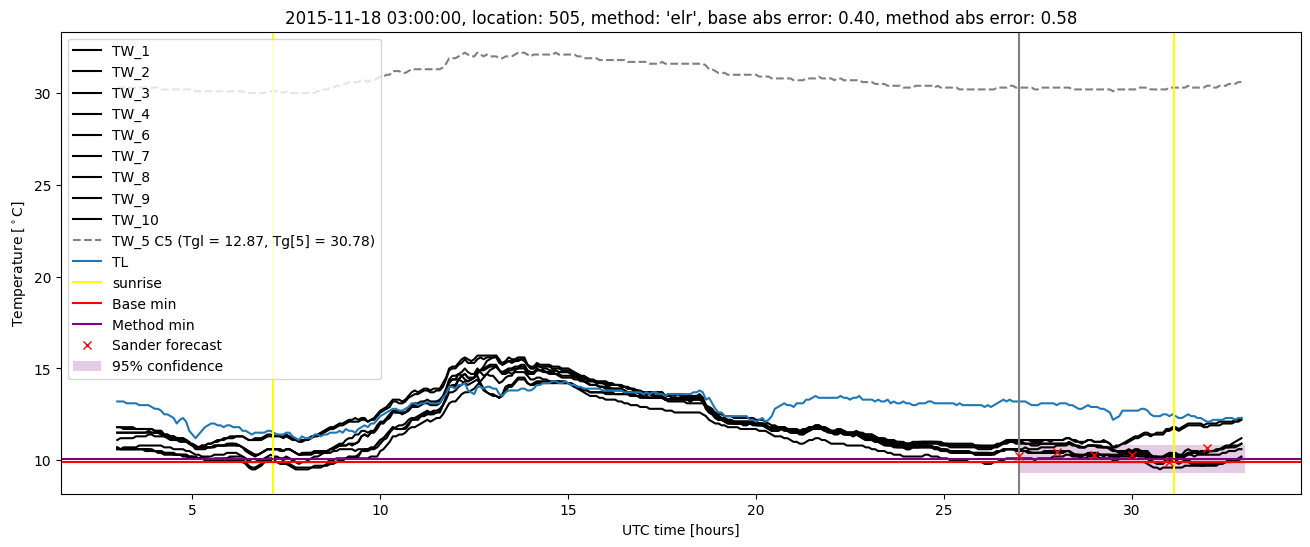
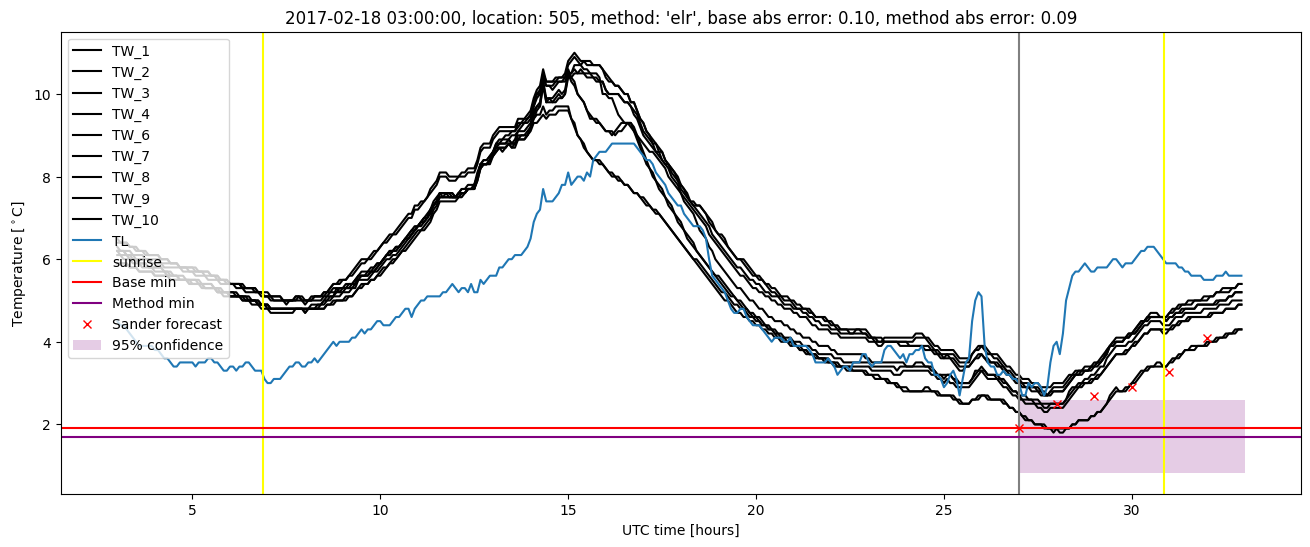
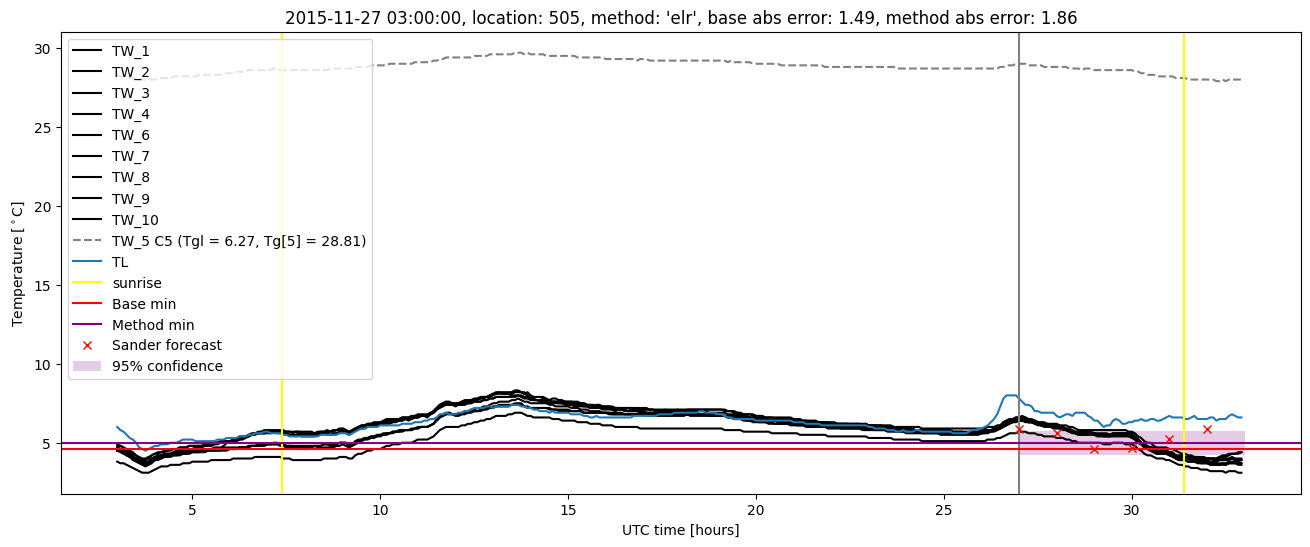
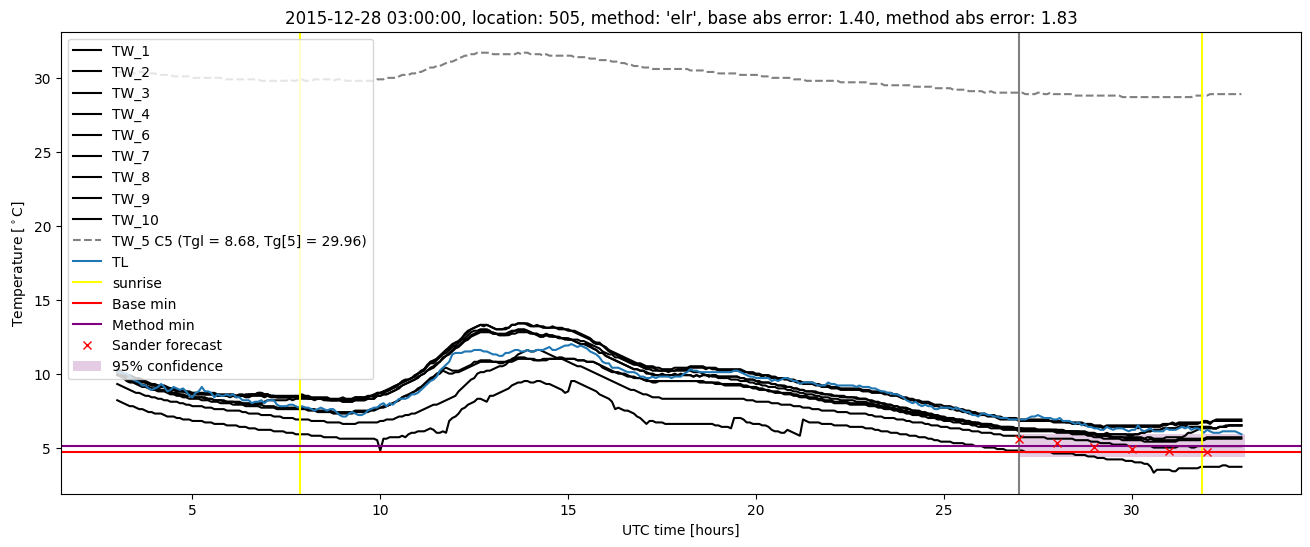
Extended logistic regression plots