GMS location: 502
Random forest results
| names |
period |
power |
significance |
meanSquareError |
absError |
maxError |
CRPS |
IGN |
| baseline |
winter 2016 |
0.984 |
0.053 |
0.333 |
0.442 |
2.018 |
NaN |
NaN |
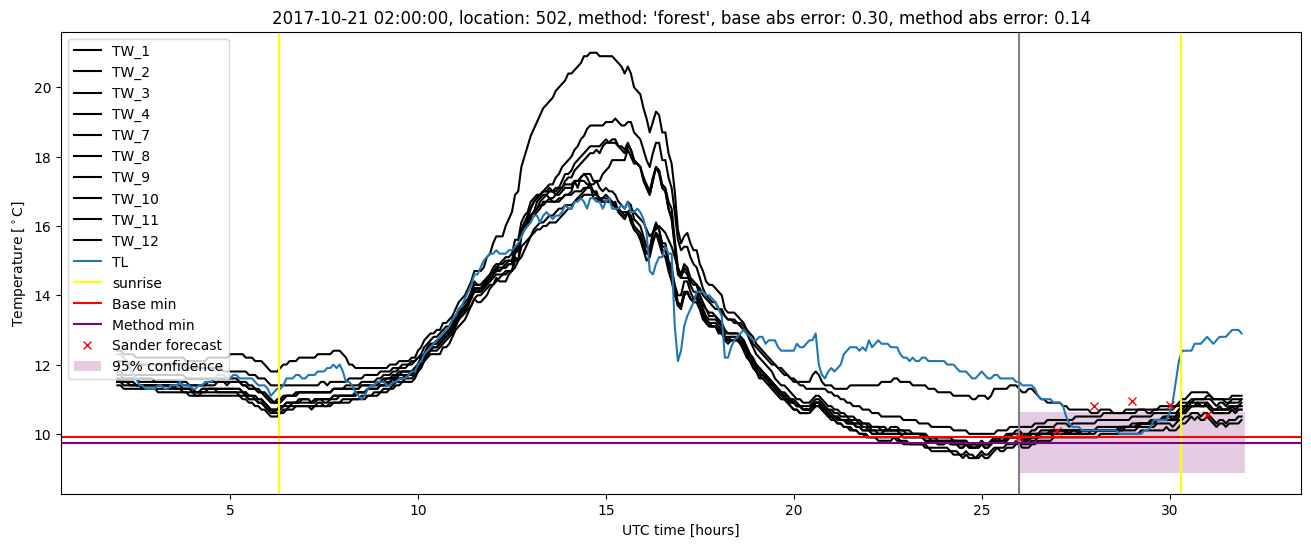
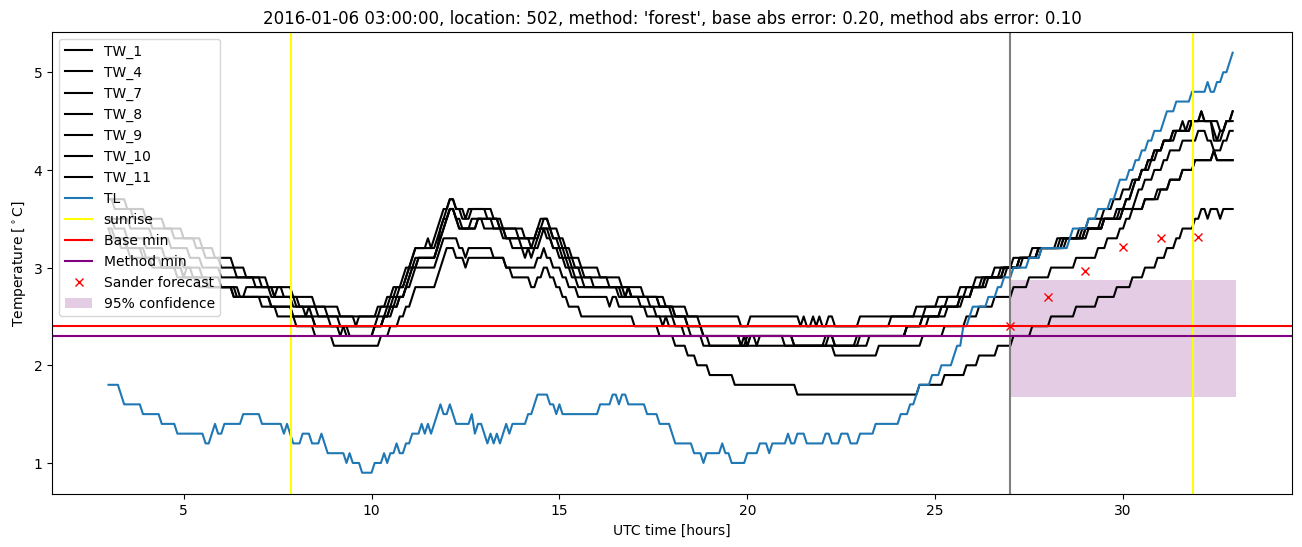
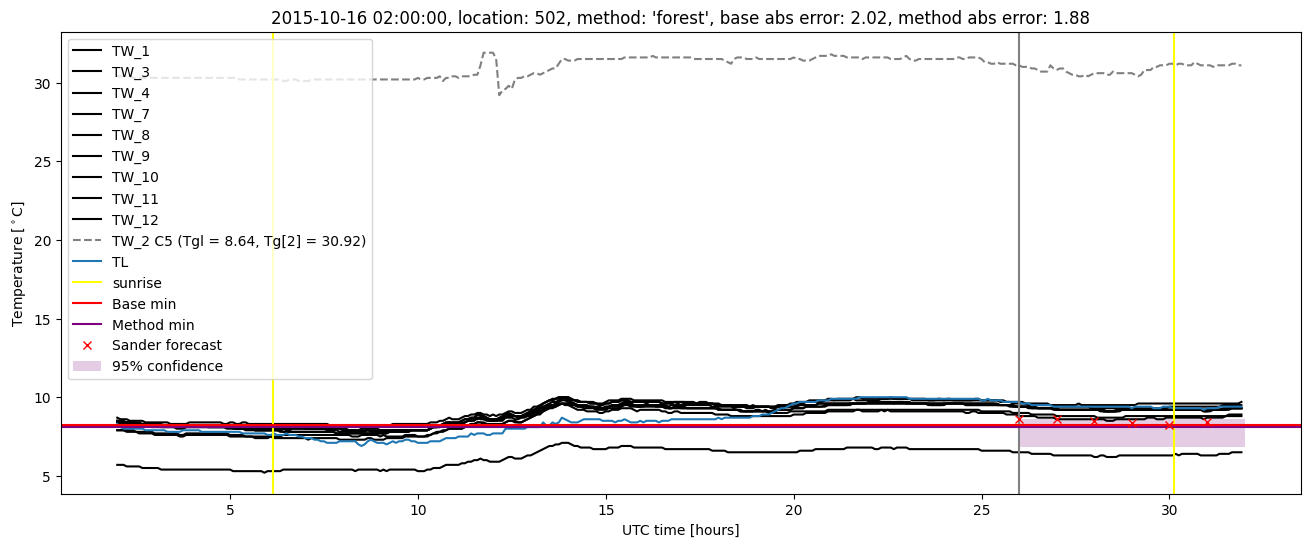
| forest |
winter 2016 |
0.989 |
0.053 |
0.259 |
0.385 |
1.883 |
0.507 |
3.746 |
| baseline |
winter 2017 |
0.957 |
0.028 |
0.432 |
0.492 |
2.433 |
NaN |
NaN |
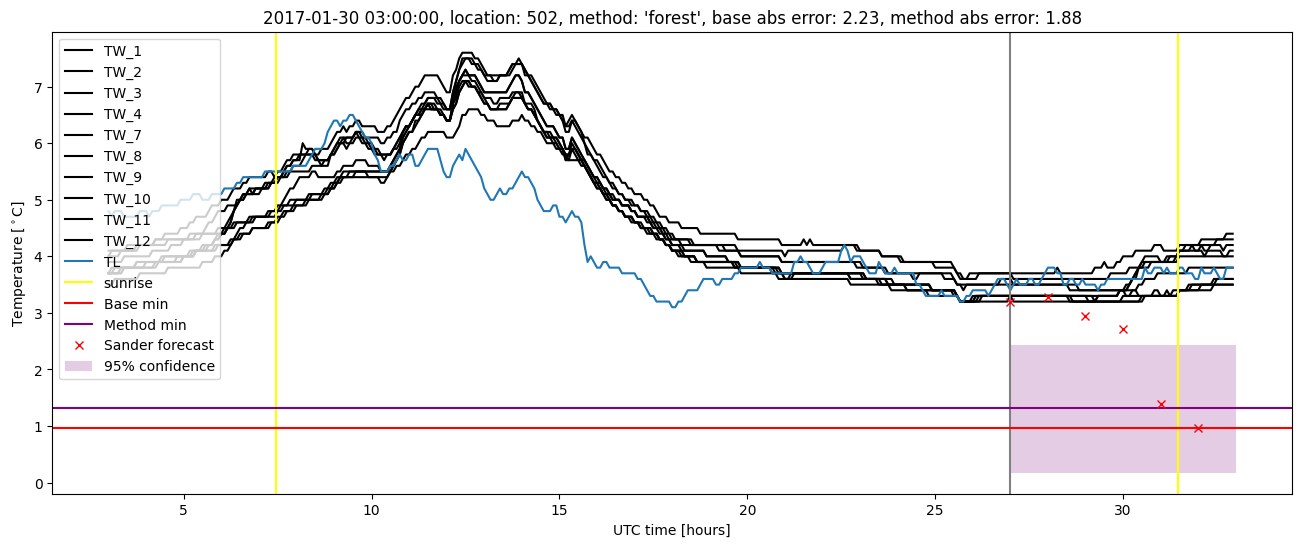
| forest |
winter 2017 |
0.949 |
0.056 |
0.318 |
0.421 |
1.881 |
0.497 |
4.290 |
| baseline |
winter 2018 |
0.971 |
0.069 |
0.369 |
0.453 |
1.896 |
NaN |
NaN |
| forest |
winter 2018 |
0.971 |
0.069 |
0.291 |
0.399 |
1.919 |
0.515 |
3.931 |
| baseline |
winter 2019 |
1.000 |
0.083 |
0.288 |
0.387 |
1.854 |
NaN |
NaN |
| forest |
winter 2019 |
1.000 |
0.083 |
0.245 |
0.379 |
1.575 |
0.505 |
3.654 |
| baseline |
all |
0.979 |
0.052 |
0.355 |
0.445 |
2.433 |
NaN |
NaN |
| forest |
all |
0.979 |
0.062 |
0.278 |
0.396 |
1.919 |
0.506 |
3.899 |
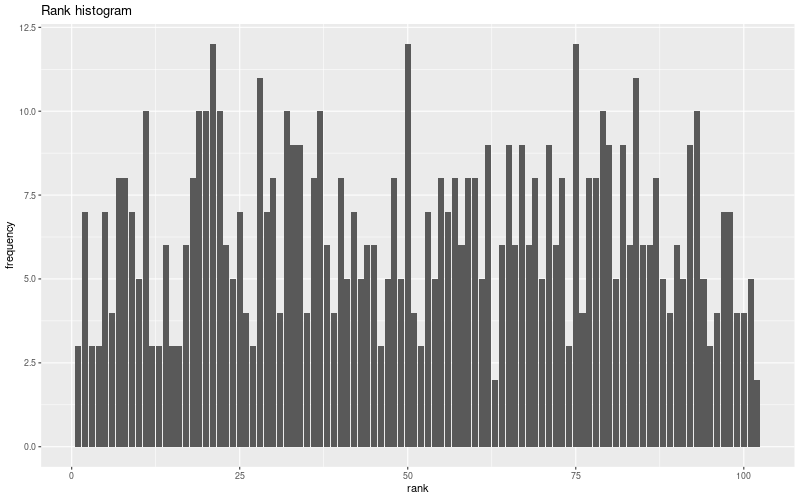
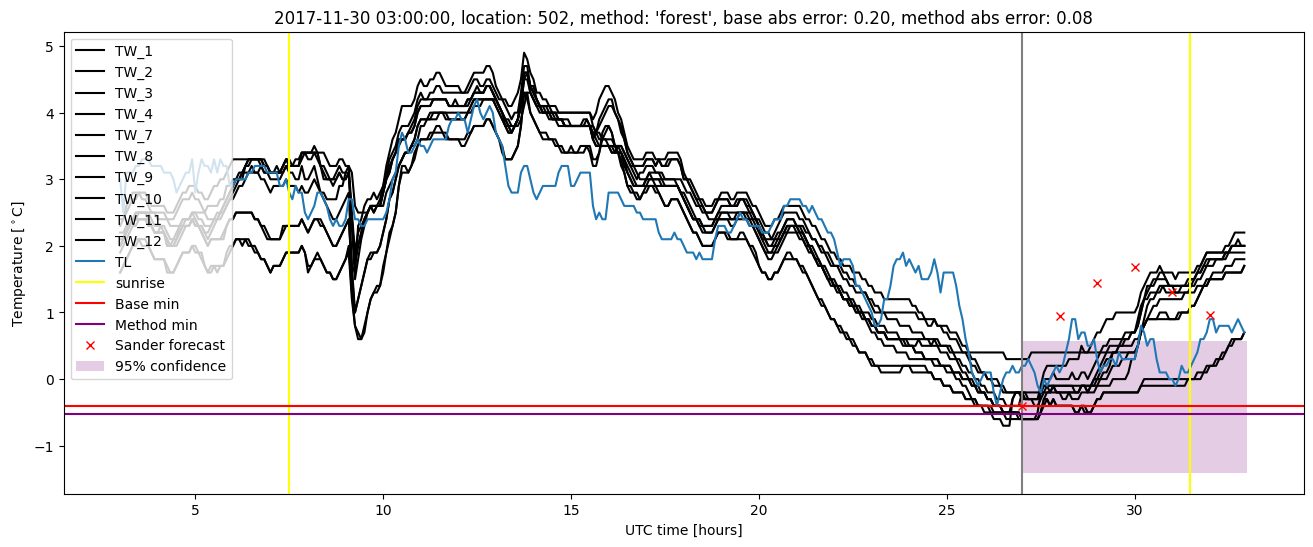
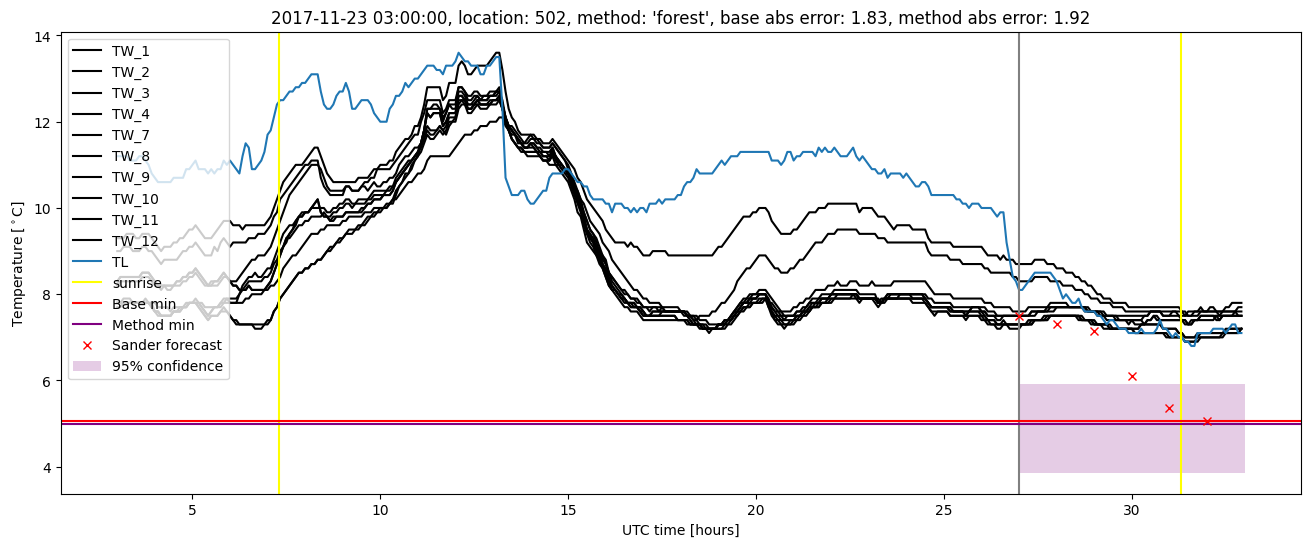
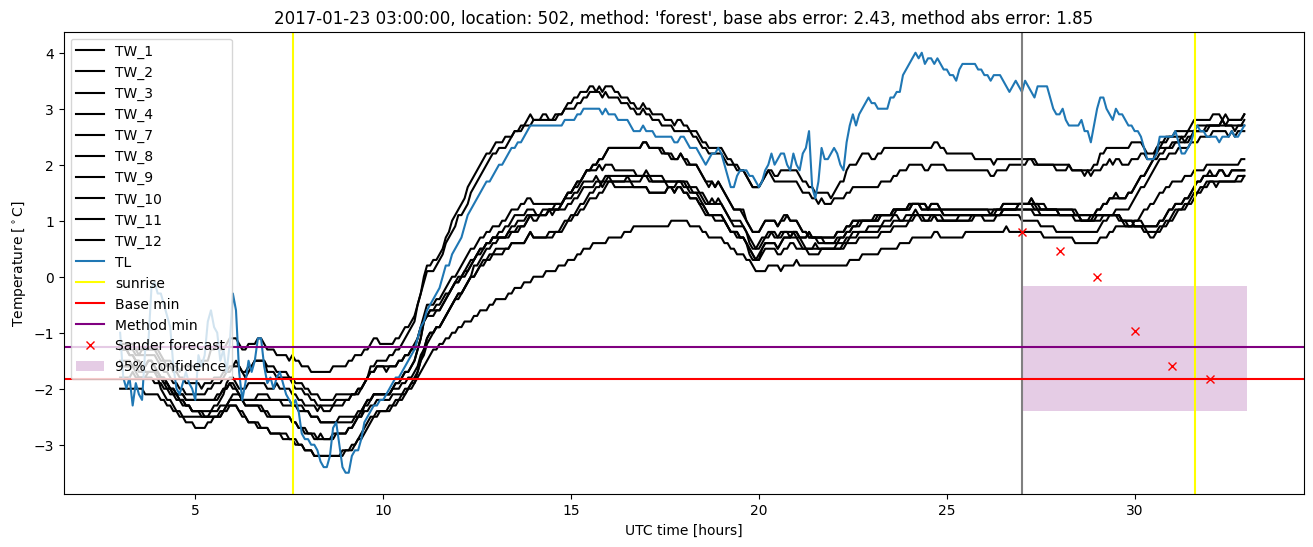
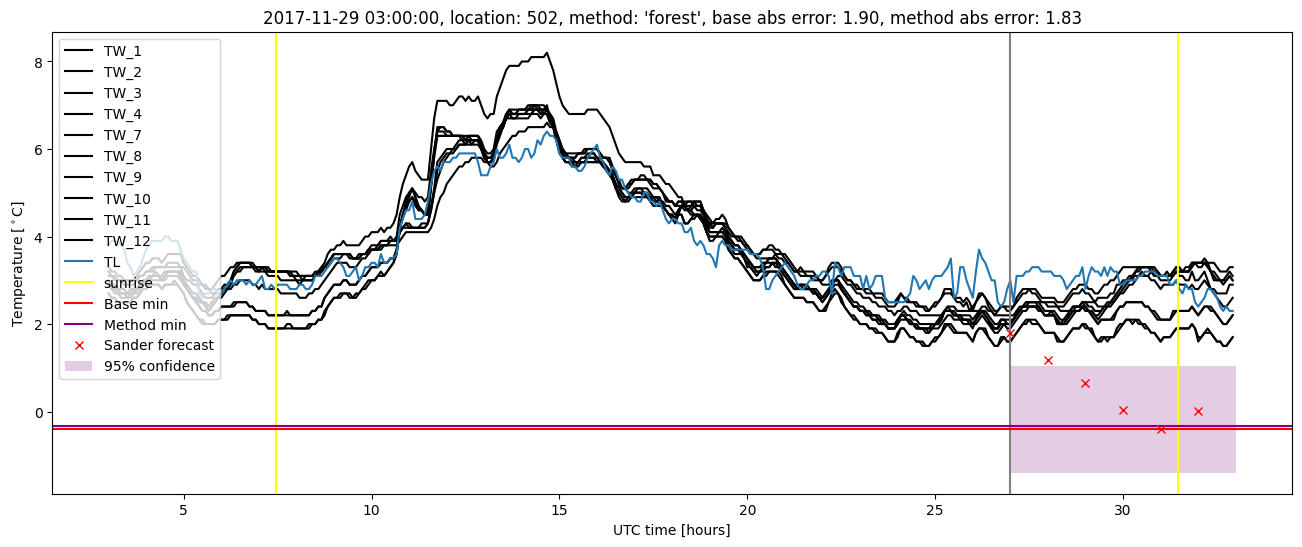
Random forest plots
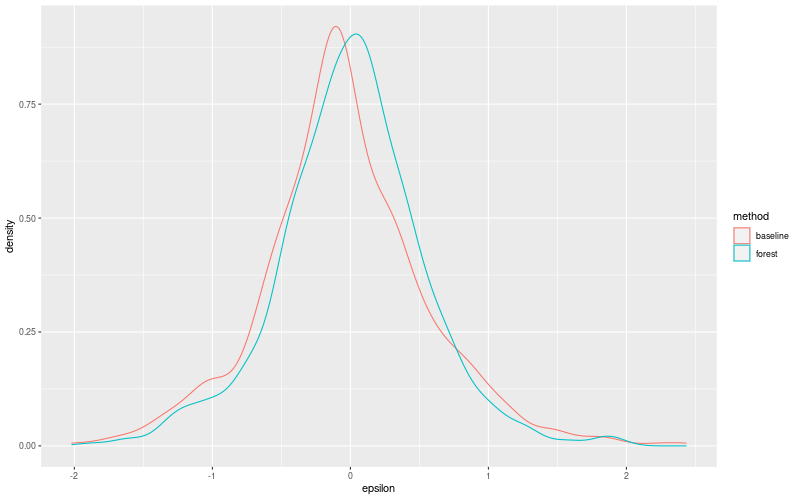
Extended logistic regression results
| names |
period |
power |
significance |
meanSquareError |
absError |
maxError |
CRPS |
IGN |
| baseline |
winter 2016 |
0.984 |
0.053 |
0.333 |
0.442 |
2.018 |
NaN |
NaN |
| elr |
winter 2016 |
0.984 |
0.053 |
0.297 |
0.425 |
1.683 |
0.560 |
3.889 |
| baseline |
winter 2017 |
0.957 |
0.028 |
0.432 |
0.492 |
2.433 |
NaN |
NaN |
| elr |
winter 2017 |
0.957 |
0.083 |
0.384 |
0.465 |
2.278 |
0.537 |
4.212 |
| baseline |
winter 2018 |
0.971 |
0.069 |
0.369 |
0.453 |
1.896 |
NaN |
NaN |
| elr |
winter 2018 |
0.971 |
0.069 |
0.324 |
0.432 |
1.867 |
0.574 |
4.259 |
| baseline |
winter 2019 |
1.000 |
0.083 |
0.288 |
0.387 |
1.854 |
NaN |
NaN |
| elr |
winter 2019 |
1.000 |
0.083 |
0.303 |
0.422 |
1.962 |
0.550 |
3.765 |
| baseline |
all |
0.979 |
0.052 |
0.355 |
0.445 |
2.433 |
NaN |
NaN |
| elr |
all |
0.979 |
0.073 |
0.325 |
0.435 |
2.278 |
0.556 |
4.031 |
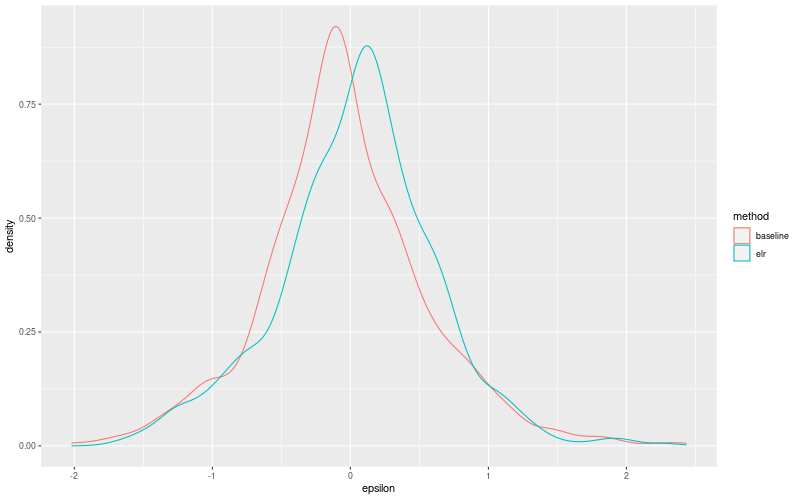
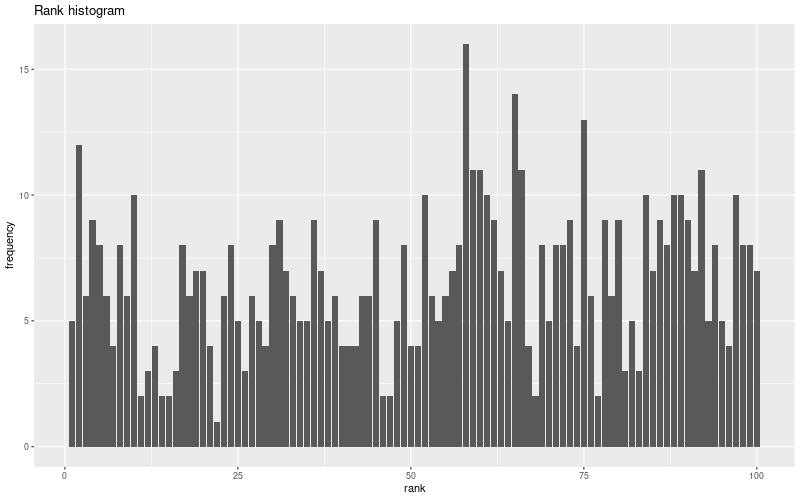
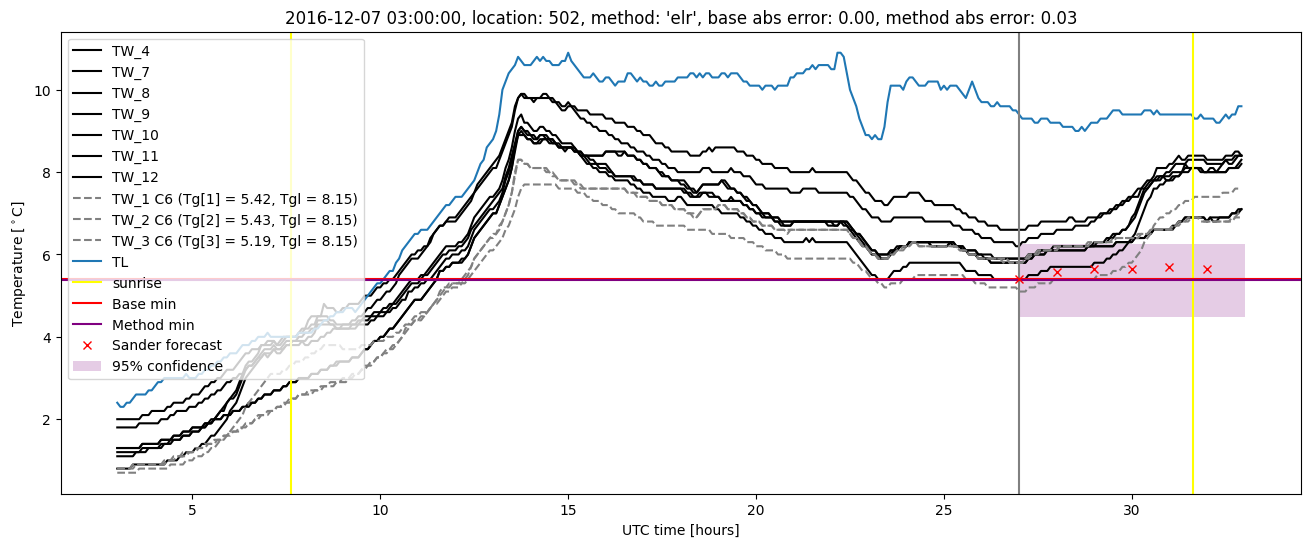
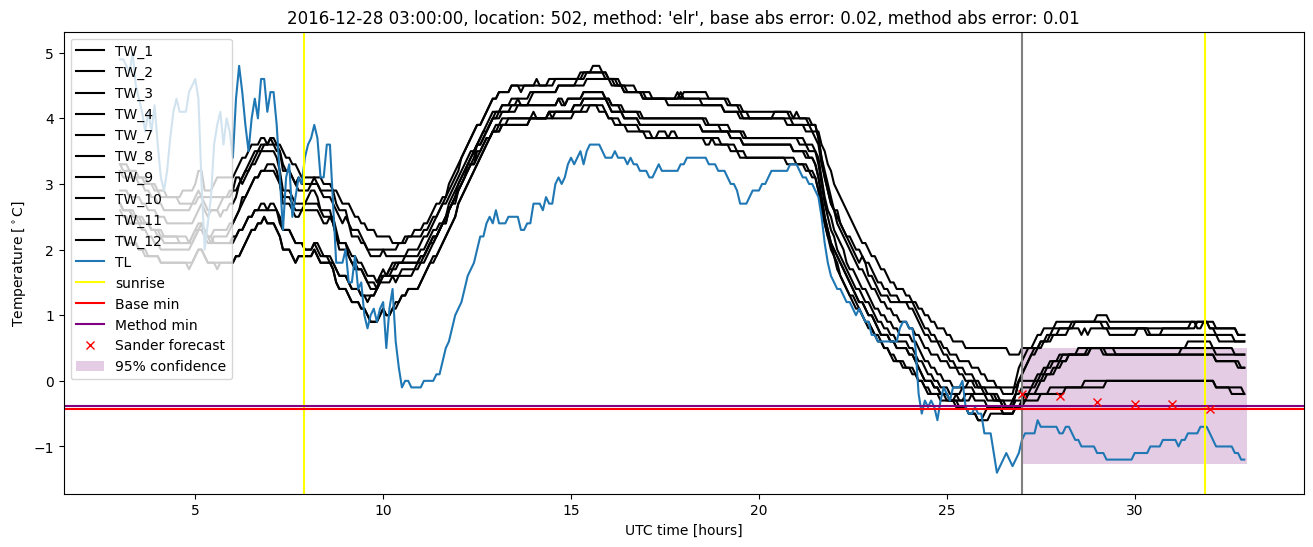
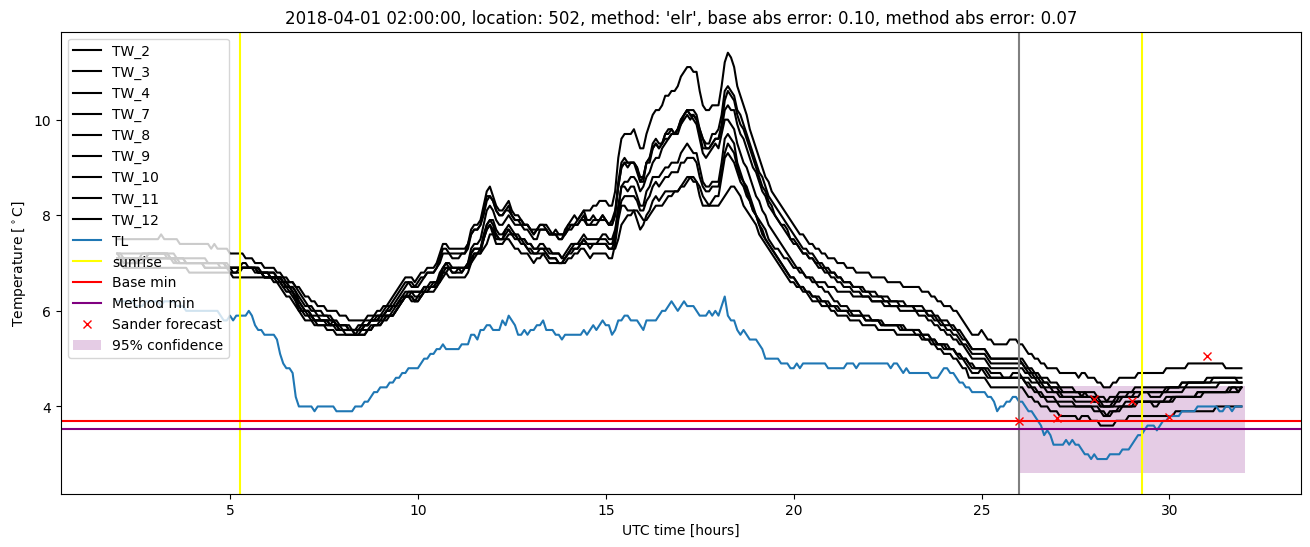
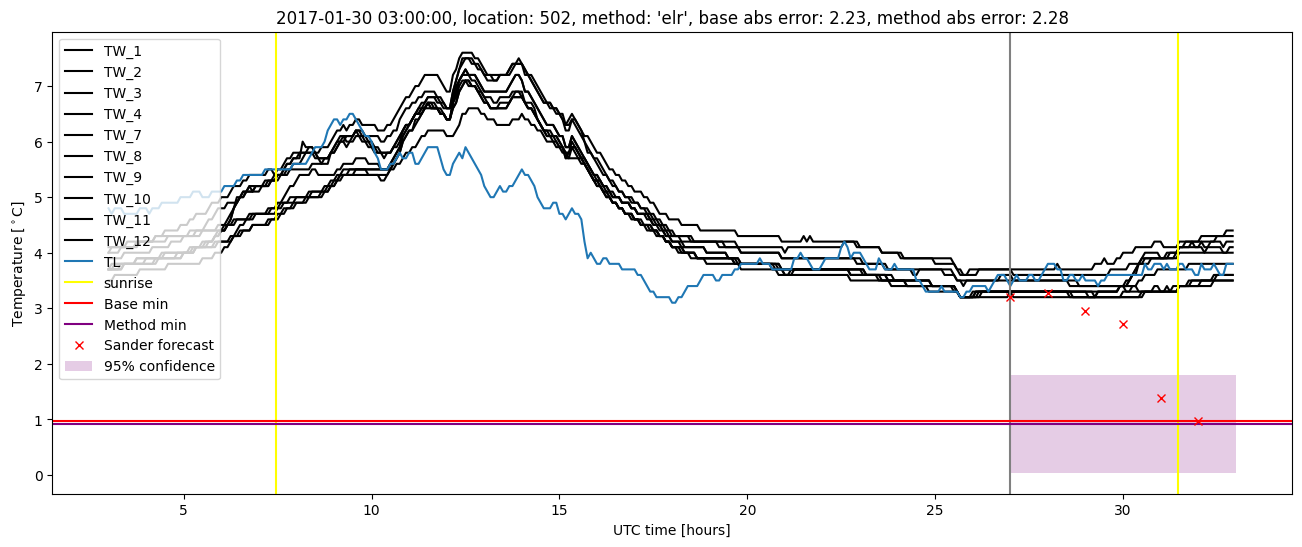
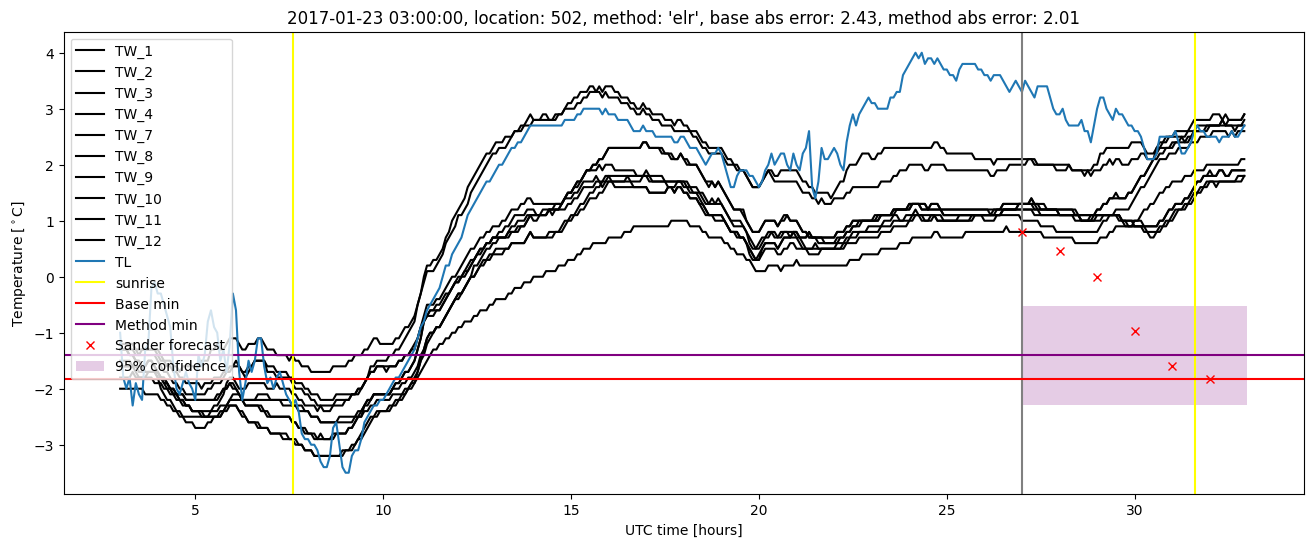
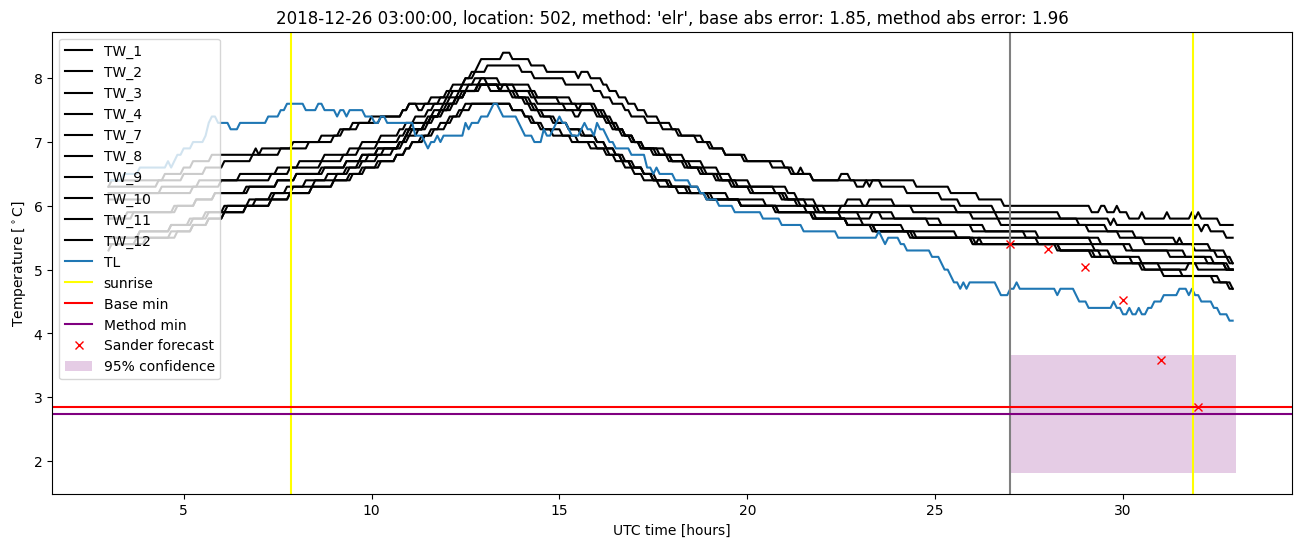
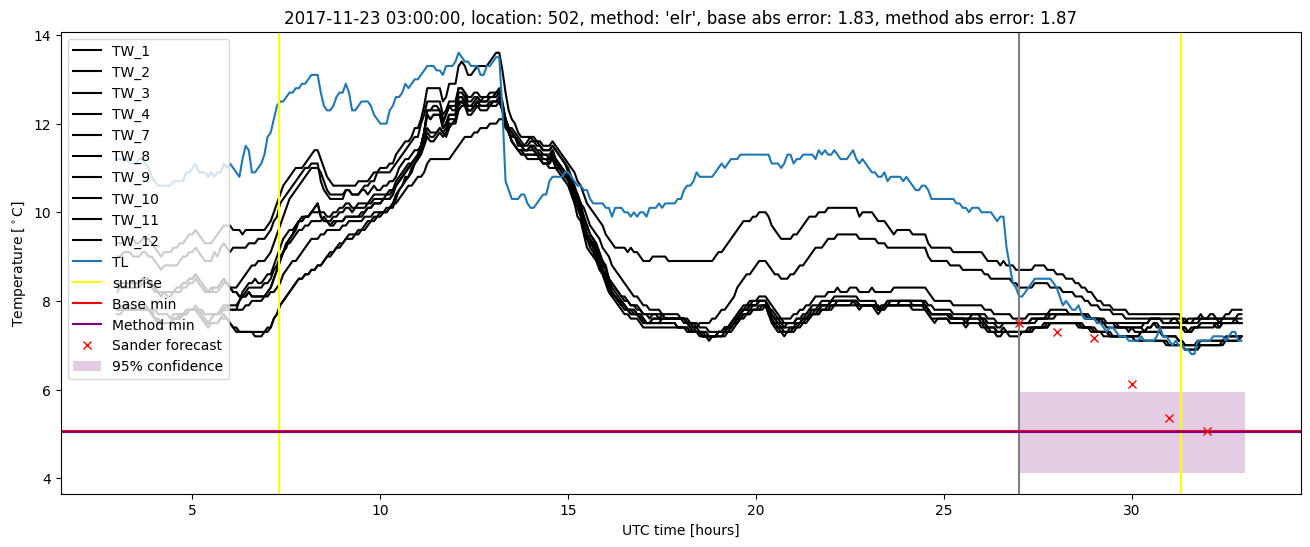
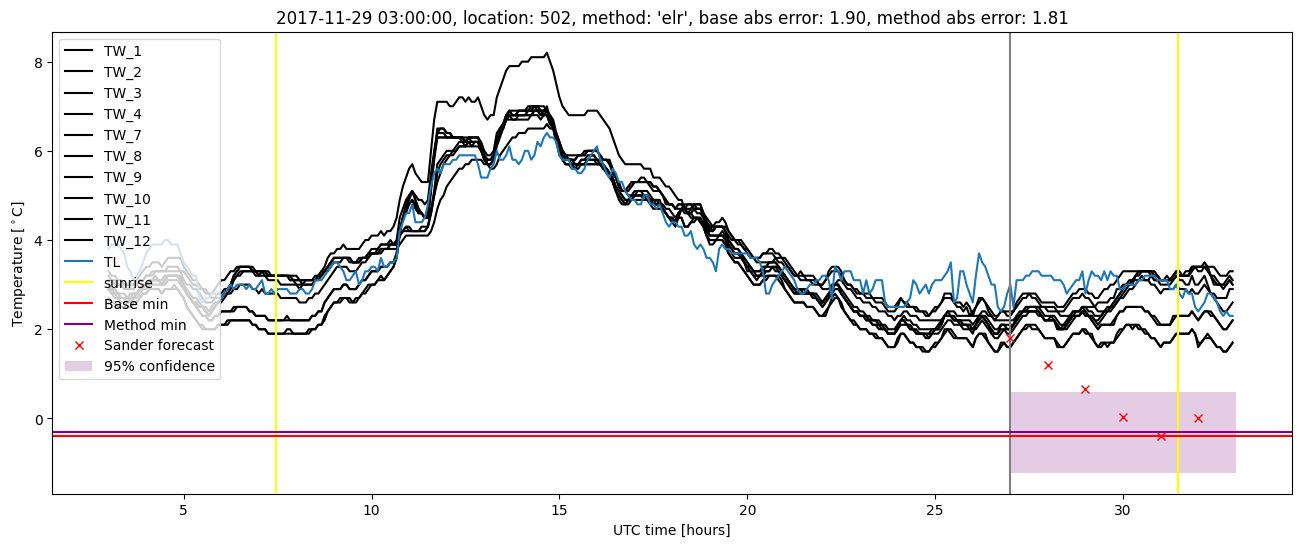
Extended logistic regression plots