GMS location: 501
Random forest results
| names |
period |
power |
significance |
meanSquareError |
absError |
maxError |
CRPS |
IGN |
| baseline |
winter 2016 |
0.984 |
0.000e+00 |
0.309 |
0.424 |
1.860 |
NaN |
NaN |
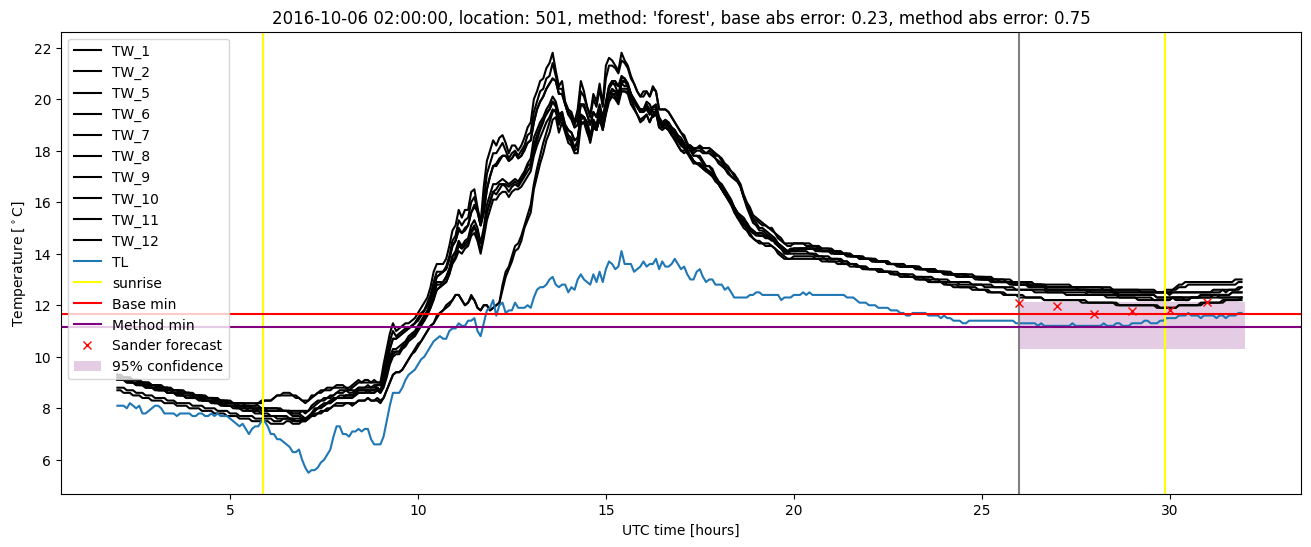
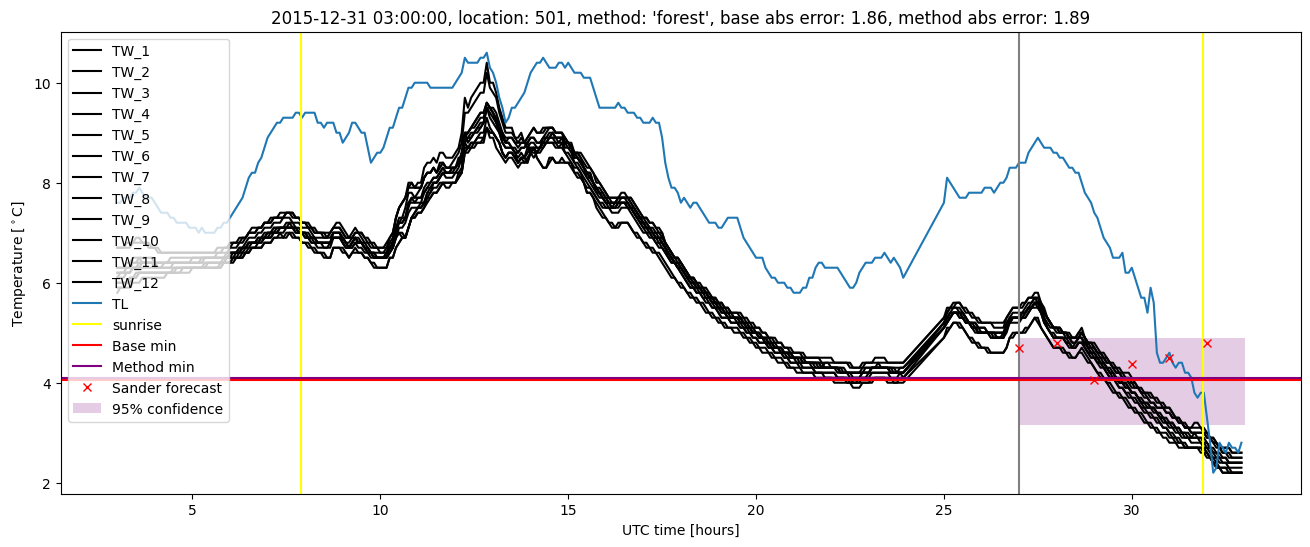
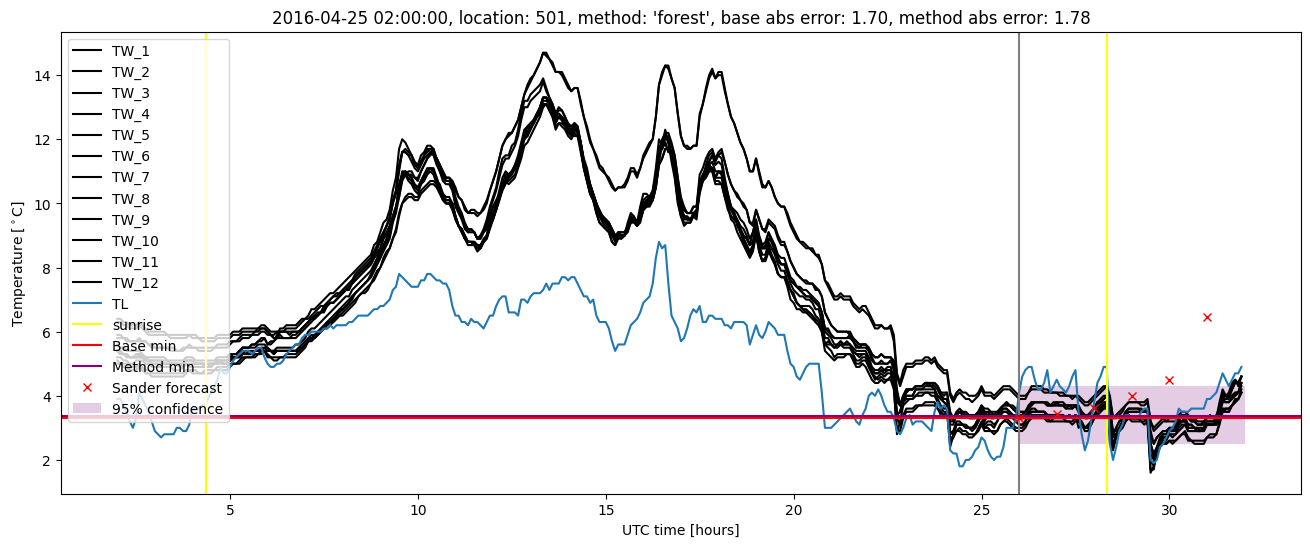
| forest |
winter 2016 |
0.995 |
0.000e+00 |
0.246 |
0.377 |
1.887 |
0.511 |
4.437 |
| baseline |
winter 2017 |
0.933 |
0.125 |
0.374 |
0.456 |
1.713 |
NaN |
NaN |
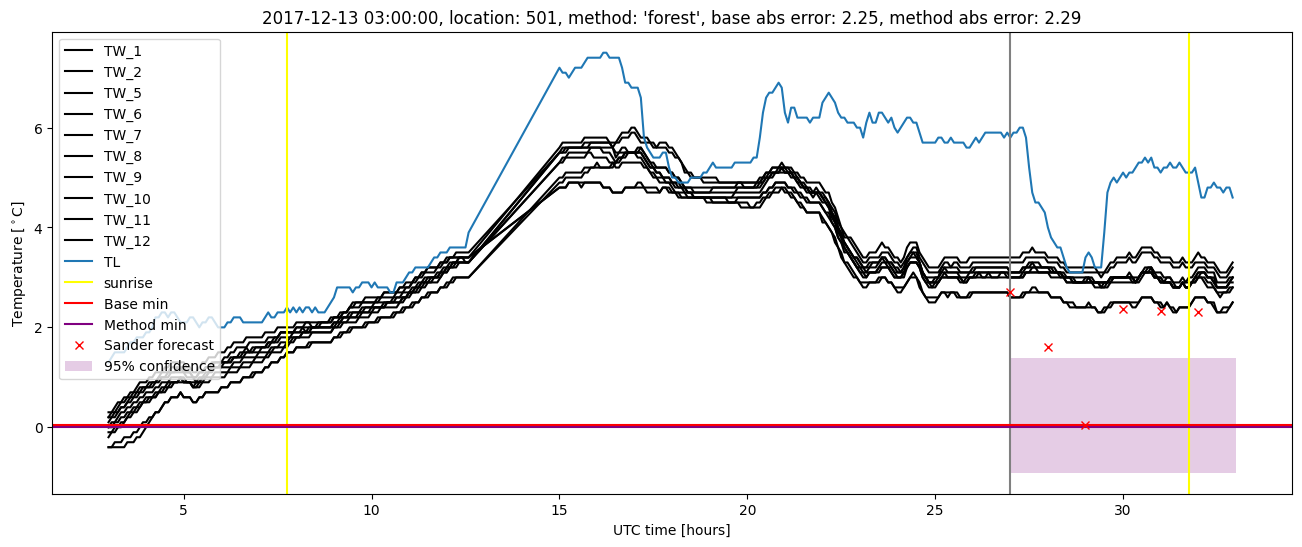
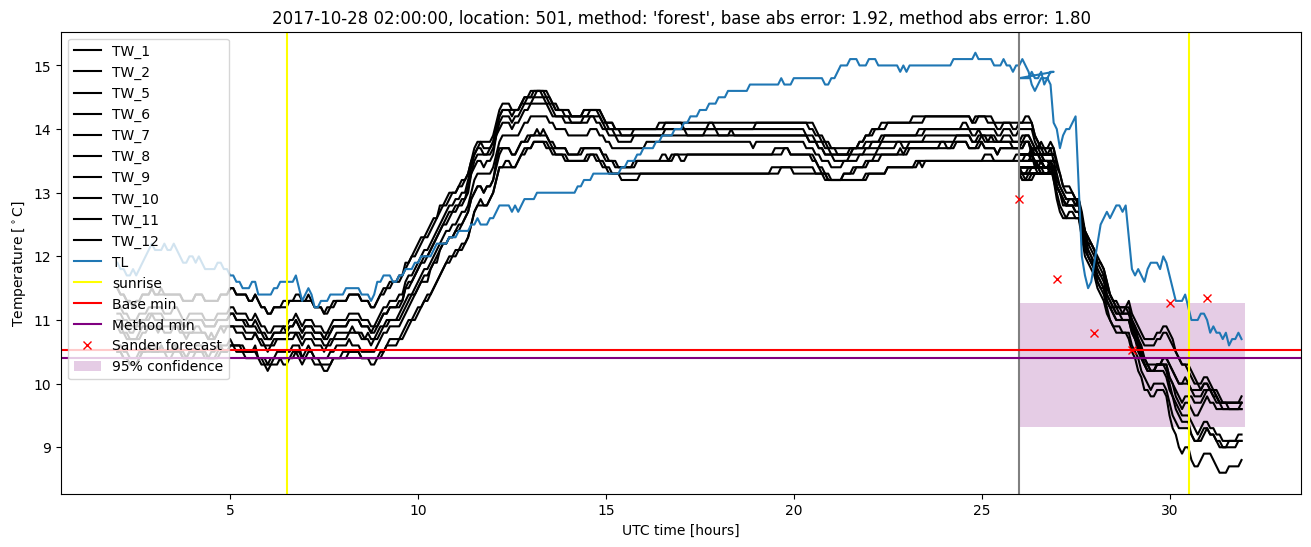
| forest |
winter 2017 |
0.950 |
0.094 |
0.287 |
0.404 |
1.435 |
0.491 |
5.121 |
| baseline |
winter 2018 |
0.992 |
0.061 |
0.354 |
0.434 |
2.253 |
NaN |
NaN |
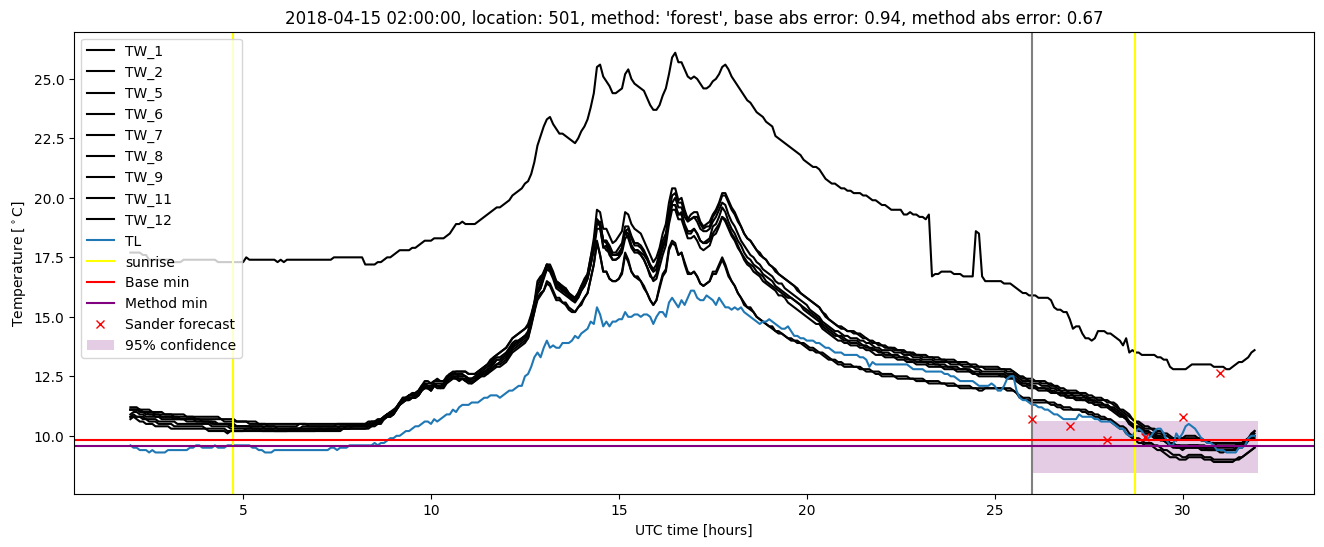
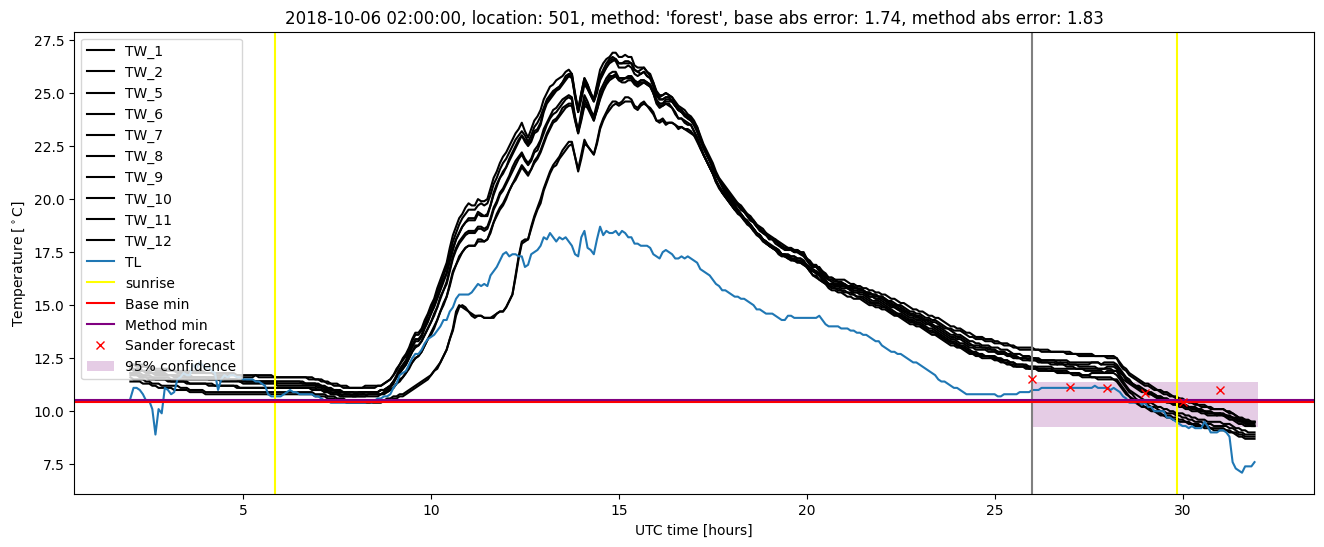
| forest |
winter 2018 |
1.000 |
0.061 |
0.279 |
0.394 |
2.295 |
0.508 |
4.135 |
| baseline |
winter 2019 |
0.986 |
0.000e+00 |
0.284 |
0.391 |
1.847 |
NaN |
NaN |
| forest |
winter 2019 |
0.986 |
0.091 |
0.243 |
0.363 |
1.829 |
0.507 |
4.524 |
| baseline |
all |
0.976 |
0.063 |
0.329 |
0.426 |
2.253 |
NaN |
NaN |
| forest |
all |
0.984 |
0.063 |
0.263 |
0.384 |
2.295 |
0.505 |
4.537 |
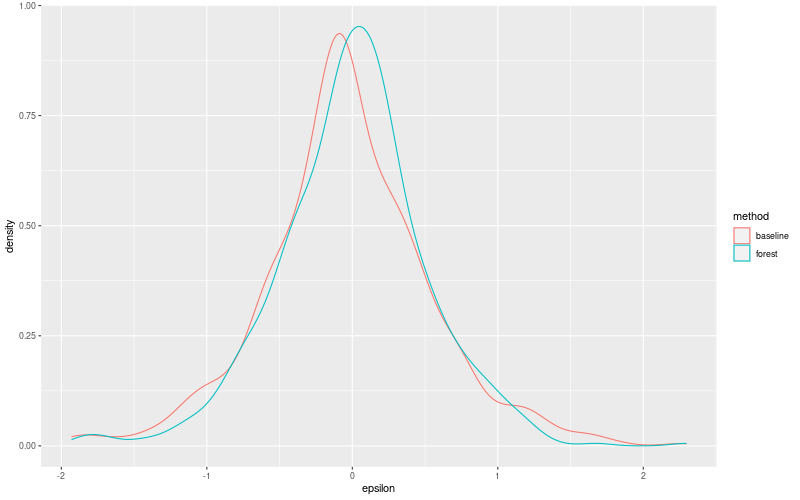
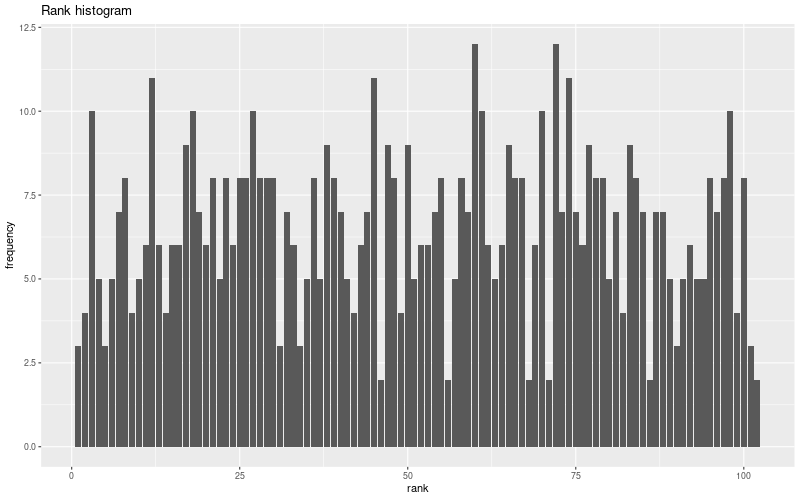
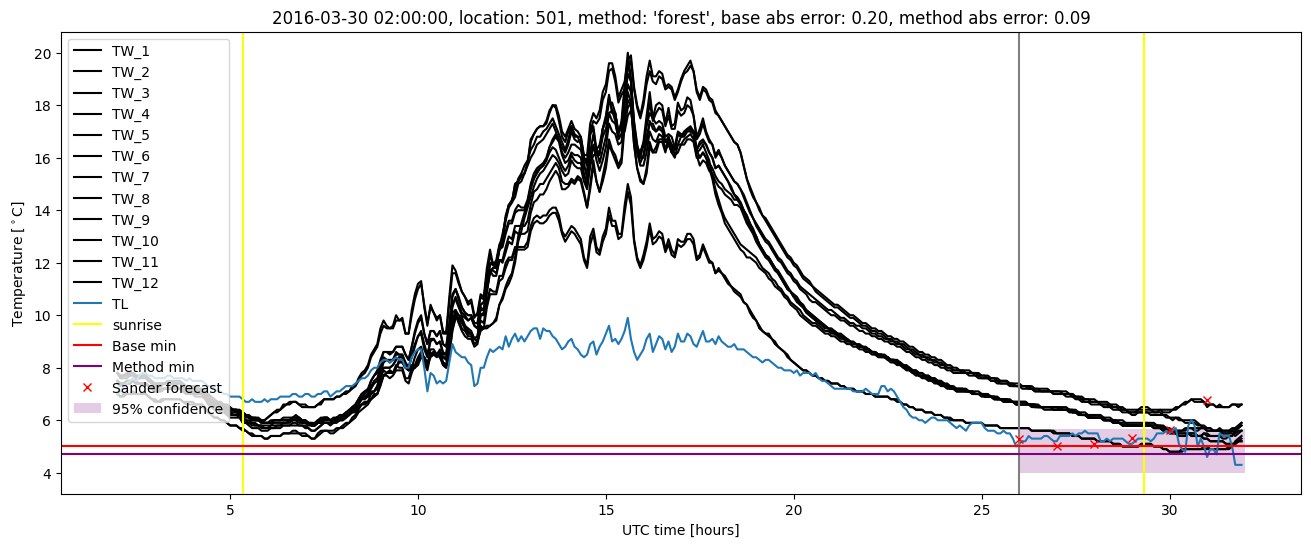
Random forest plots
Extended logistic regression results
| names |
period |
power |
significance |
meanSquareError |
absError |
maxError |
CRPS |
IGN |
| baseline |
winter 2016 |
0.984 |
0.000e+00 |
0.309 |
0.424 |
1.860 |
NaN |
NaN |
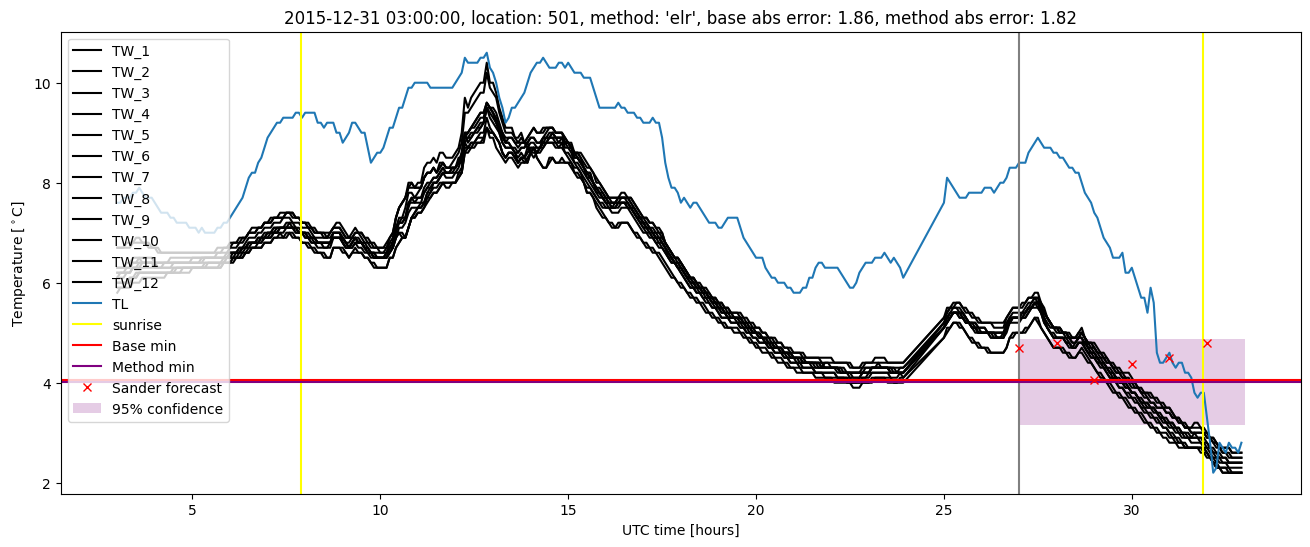
| elr |
winter 2016 |
0.989 |
0.000e+00 |
0.275 |
0.413 |
1.816 |
0.582 |
5.364 |
| baseline |
winter 2017 |
0.933 |
0.125 |
0.374 |
0.456 |
1.713 |
NaN |
NaN |
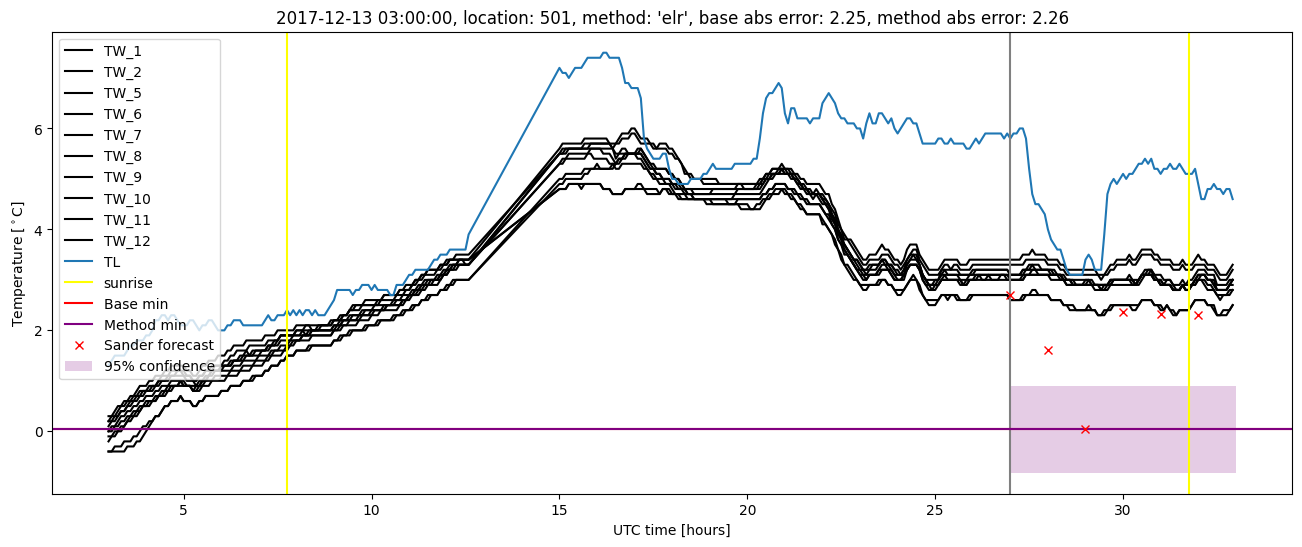
| elr |
winter 2017 |
0.958 |
0.125 |
0.284 |
0.405 |
1.589 |
0.512 |
4.342 |
| baseline |
winter 2018 |
0.992 |
0.061 |
0.354 |
0.434 |
2.253 |
NaN |
NaN |
| elr |
winter 2018 |
1.000 |
0.061 |
0.282 |
0.401 |
2.261 |
0.576 |
5.209 |
| baseline |
winter 2019 |
0.986 |
0.000e+00 |
0.284 |
0.391 |
1.847 |
NaN |
NaN |
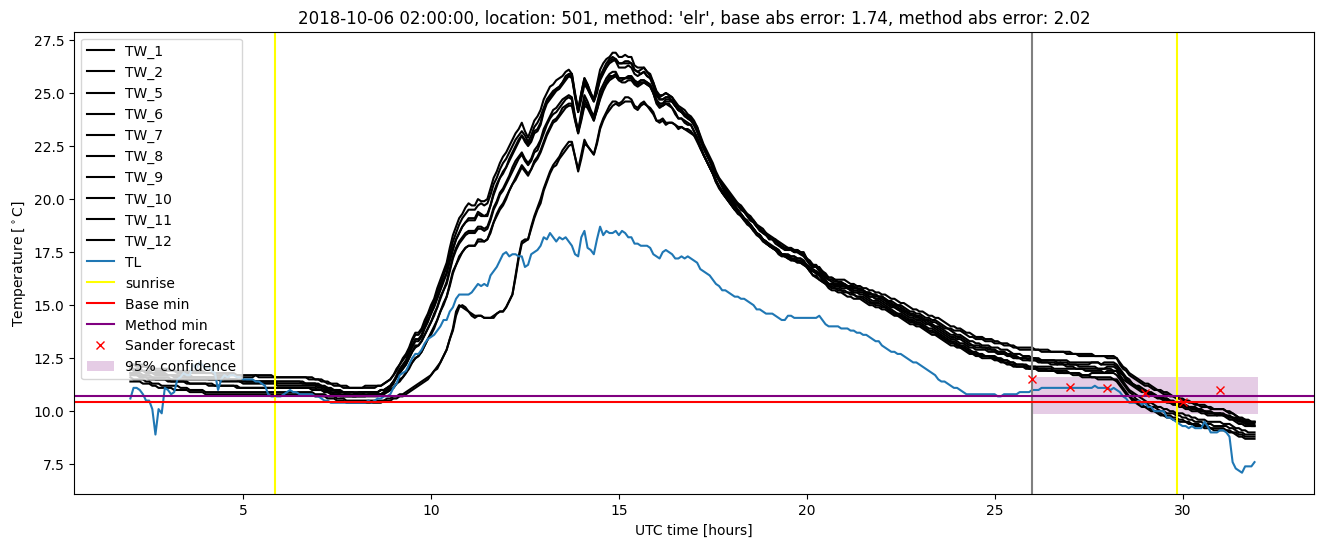
| elr |
winter 2019 |
0.986 |
0.091 |
0.285 |
0.407 |
2.016 |
0.559 |
4.655 |
| baseline |
all |
0.976 |
0.063 |
0.329 |
0.426 |
2.253 |
NaN |
NaN |
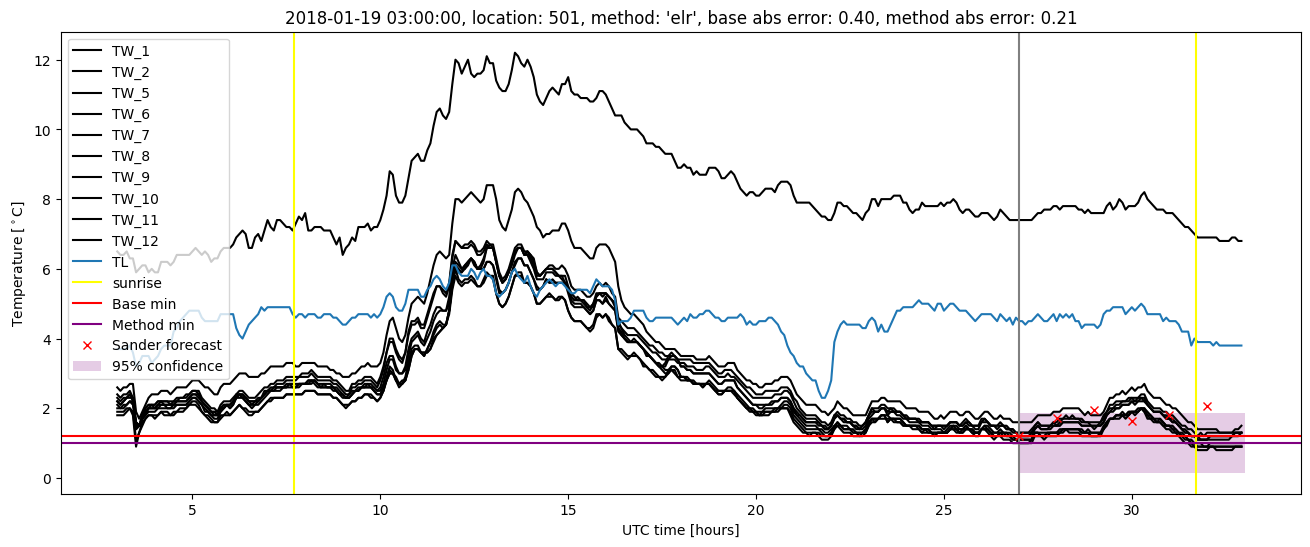
| elr |
all |
0.984 |
0.074 |
0.281 |
0.407 |
2.261 |
0.559 |
4.934 |
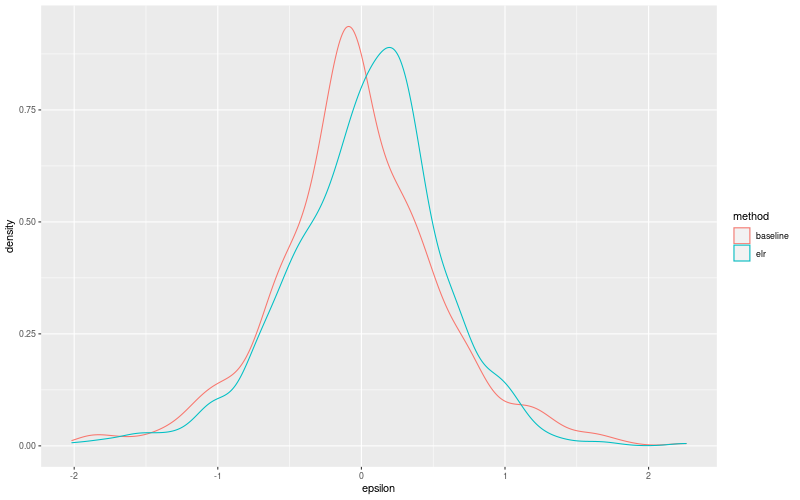
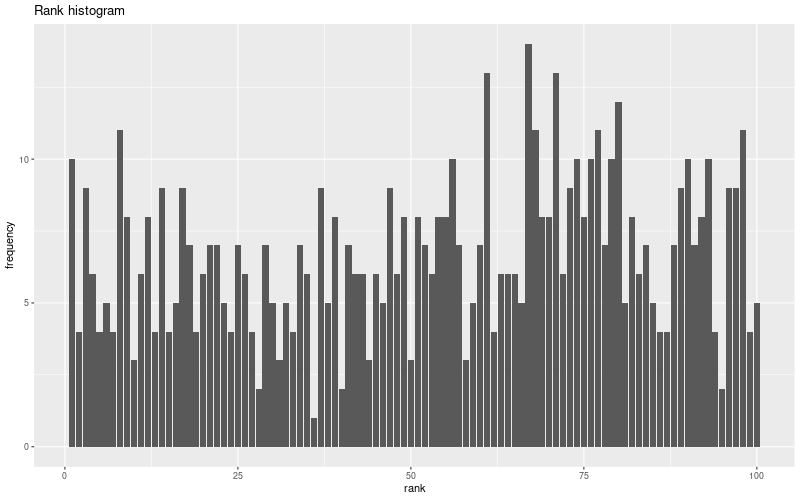
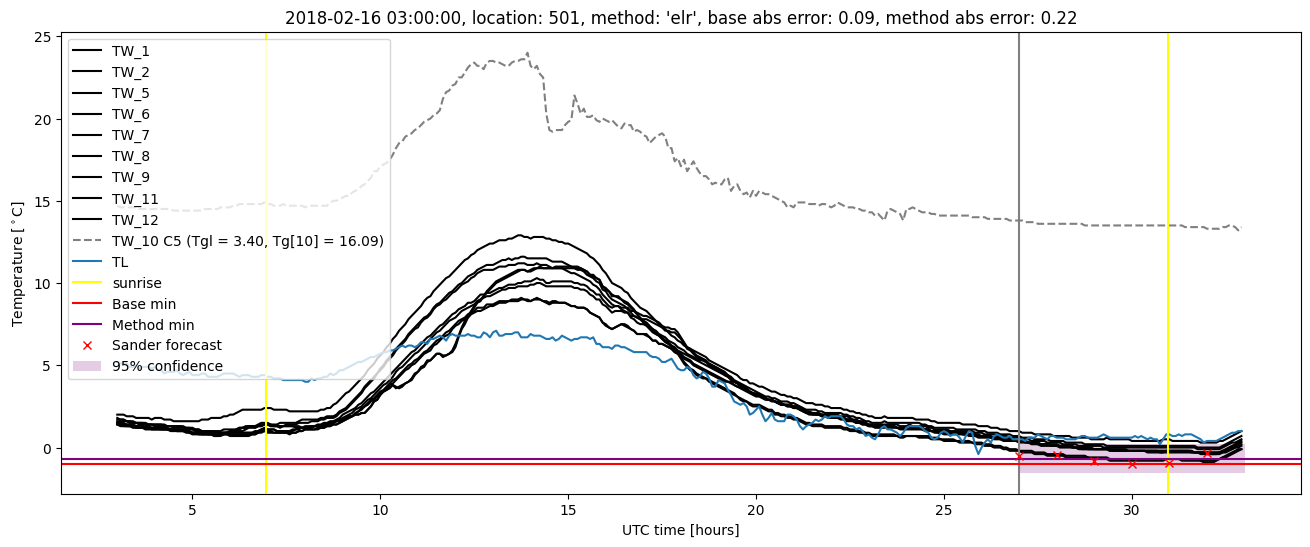
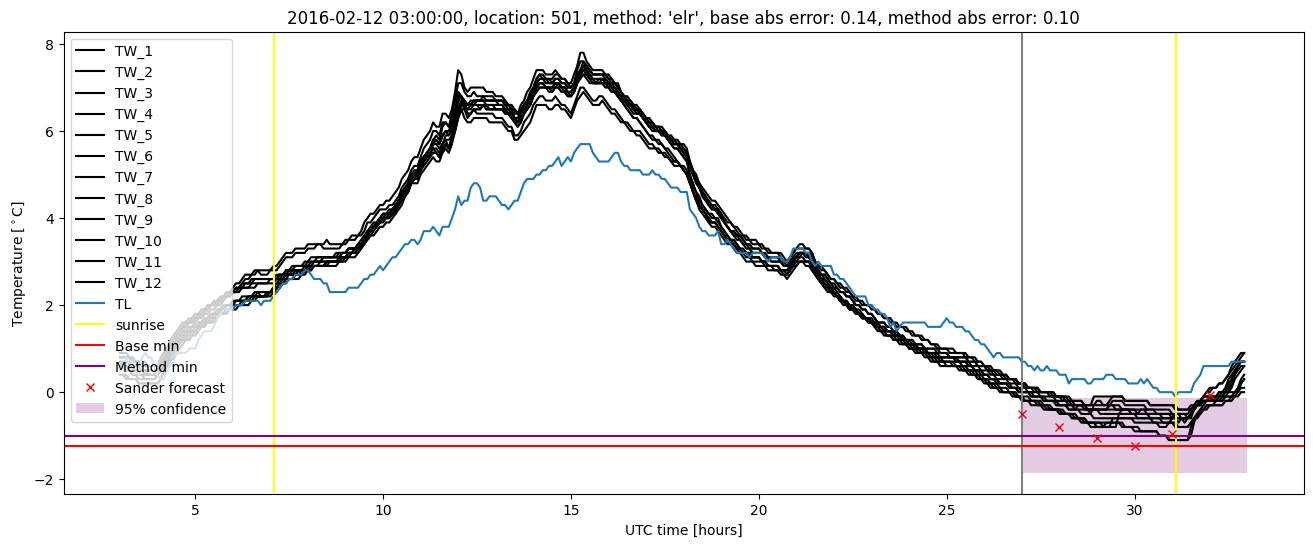
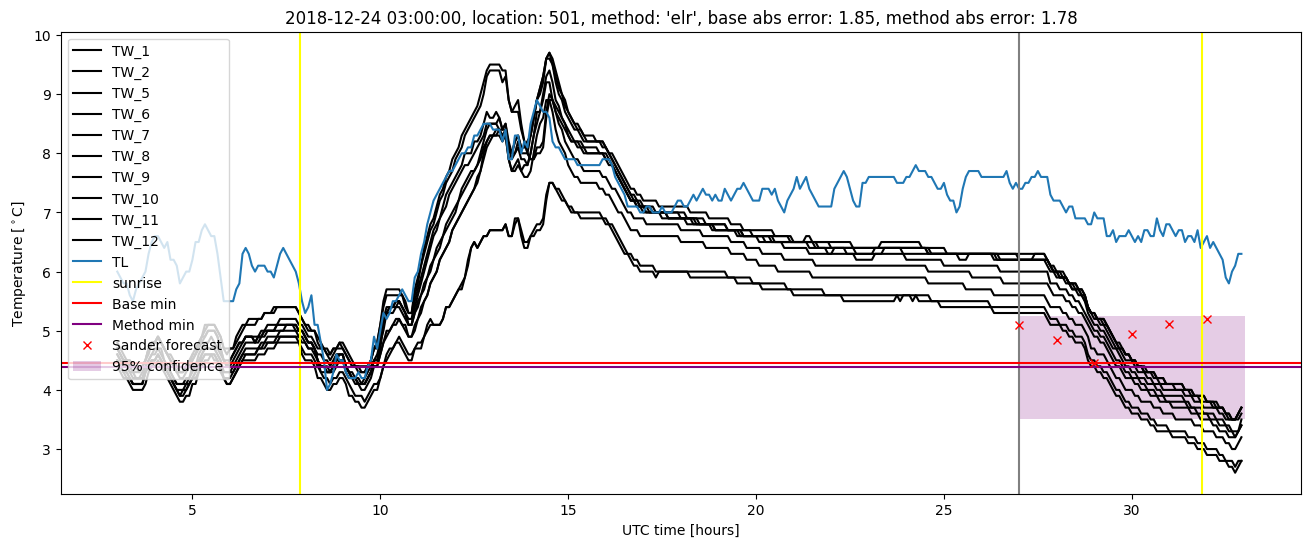
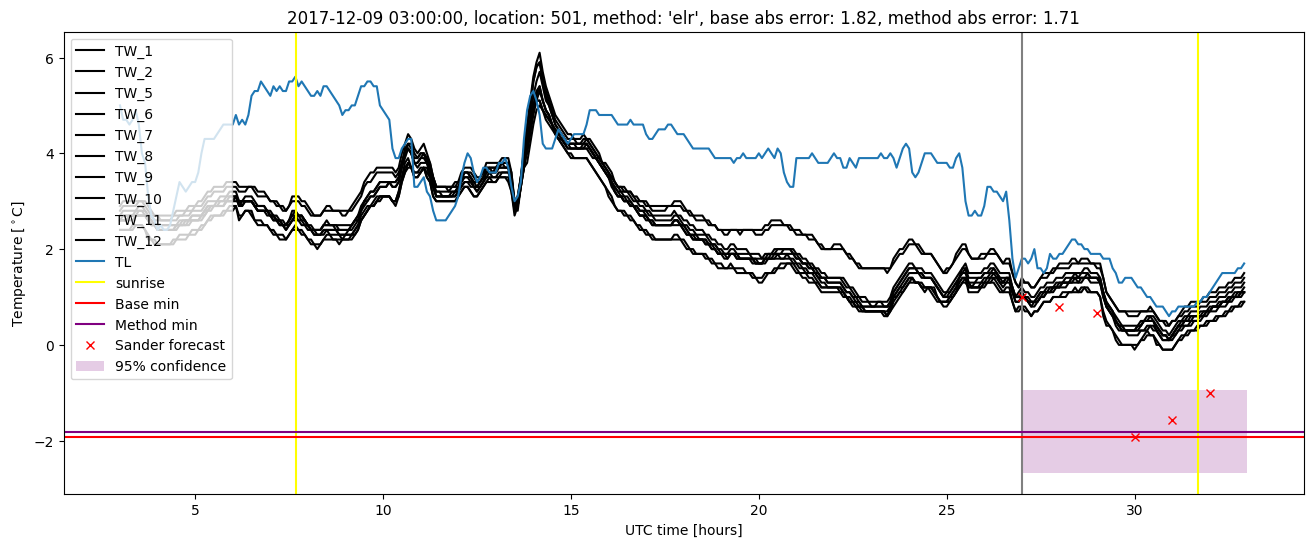
Extended logistic regression plots