GMS location: 500
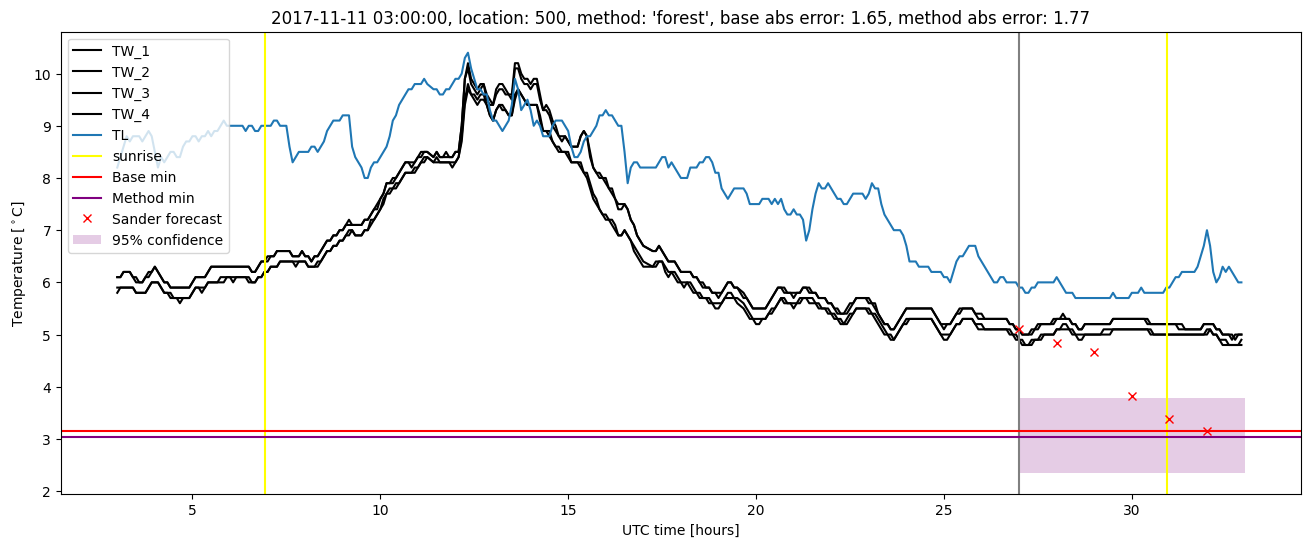
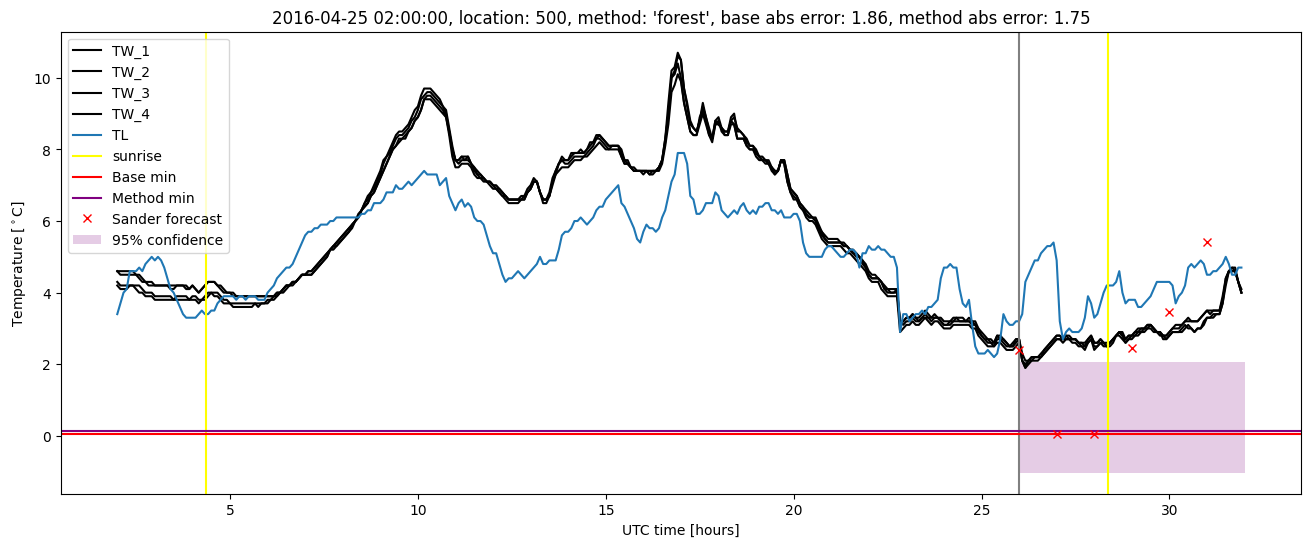
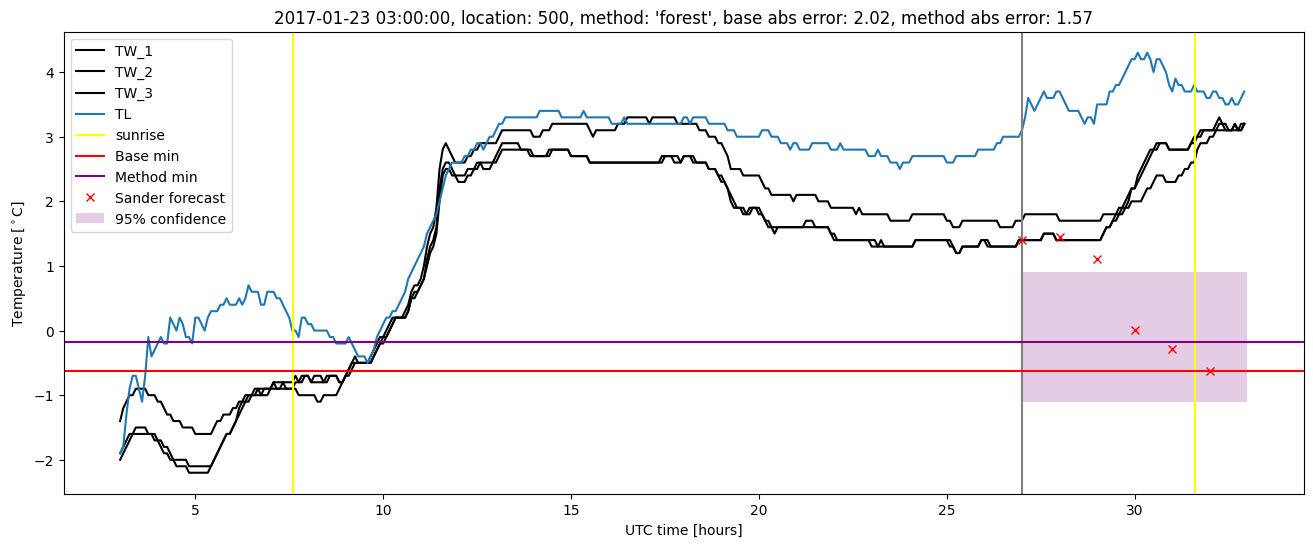
Random forest results
| names |
period |
power |
significance |
meanSquareError |
absError |
maxError |
CRPS |
IGN |
| baseline |
winter 2016 |
0.977 |
0.059 |
0.300 |
0.414 |
1.915 |
NaN |
NaN |
| forest |
winter 2016 |
0.994 |
0.059 |
0.215 |
0.337 |
1.828 |
0.453 |
5.818 |
| baseline |
winter 2017 |
0.960 |
0.071 |
0.356 |
0.459 |
2.021 |
NaN |
NaN |
| forest |
winter 2017 |
0.984 |
0.071 |
0.231 |
0.354 |
1.572 |
0.460 |
4.436 |
| baseline |
winter 2018 |
0.993 |
0.130 |
0.289 |
0.408 |
1.650 |
NaN |
NaN |
| forest |
winter 2018 |
0.993 |
0.130 |
0.230 |
0.357 |
1.768 |
0.470 |
4.095 |
| baseline |
winter 2019 |
0.979 |
0.000e+00 |
0.255 |
0.383 |
1.528 |
NaN |
NaN |
| forest |
winter 2019 |
0.979 |
0.000e+00 |
0.203 |
0.338 |
1.584 |
0.463 |
4.290 |
| baseline |
all |
0.978 |
0.078 |
0.300 |
0.416 |
2.021 |
NaN |
NaN |
| forest |
all |
0.988 |
0.078 |
0.220 |
0.346 |
1.828 |
0.461 |
4.713 |
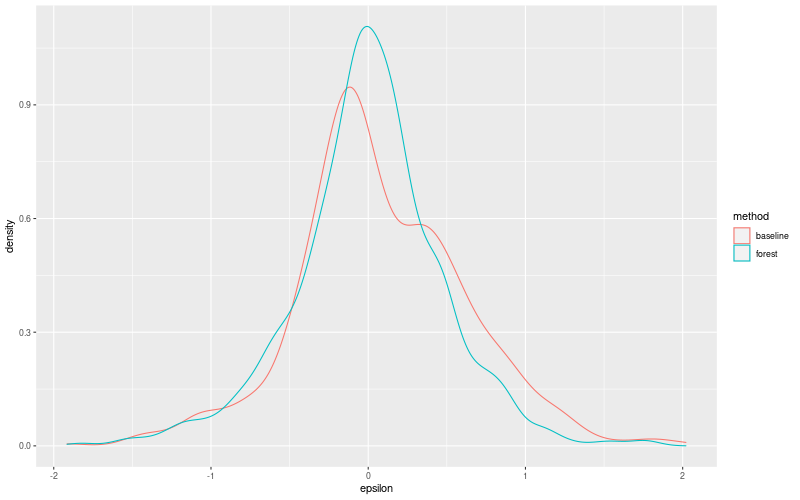
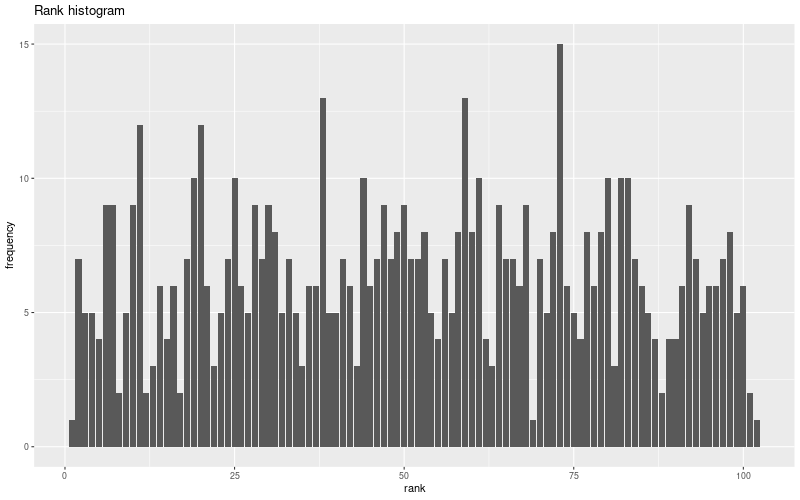
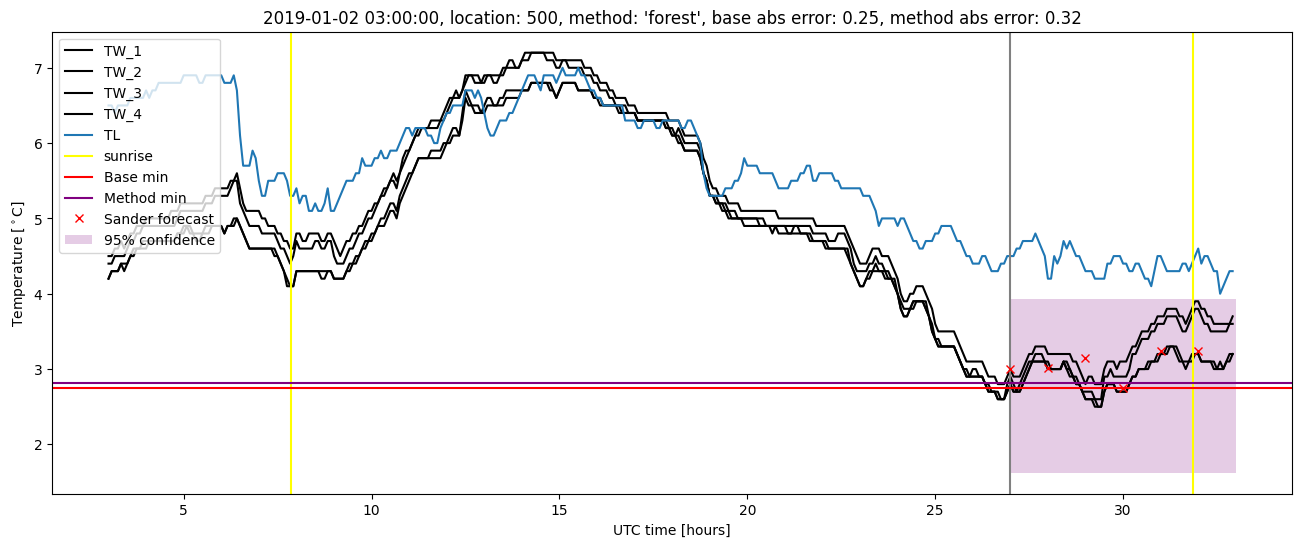
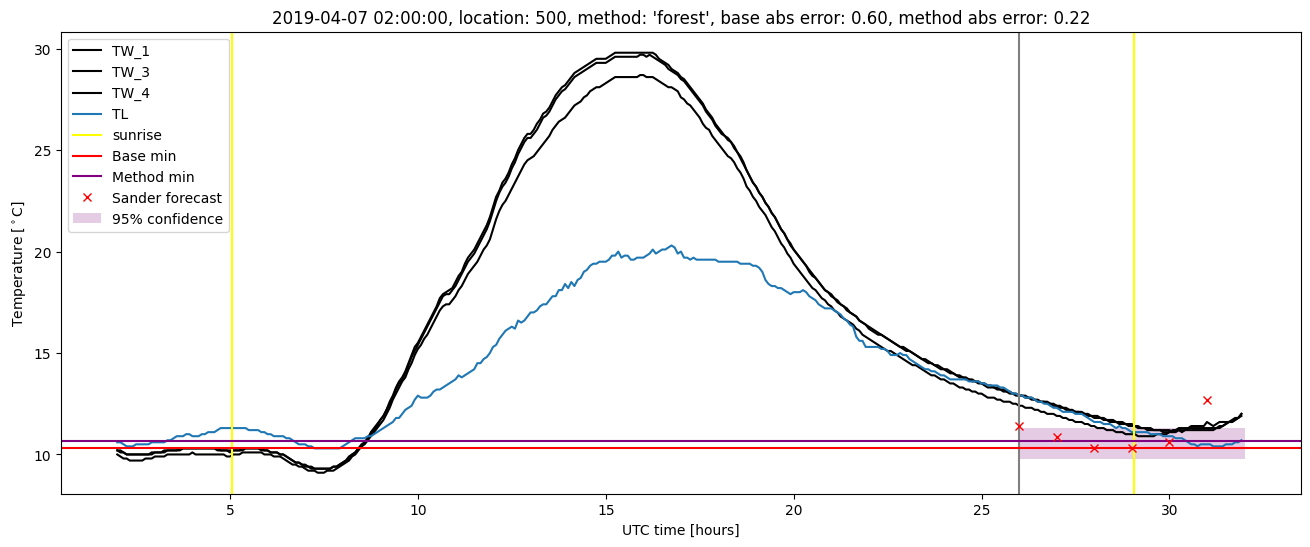
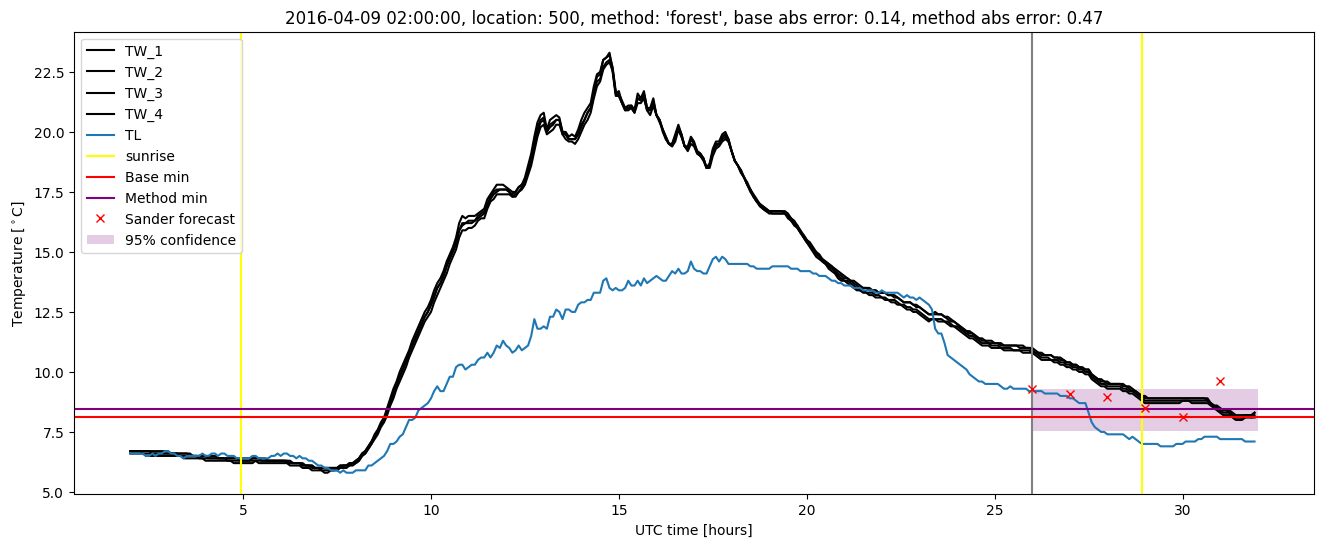
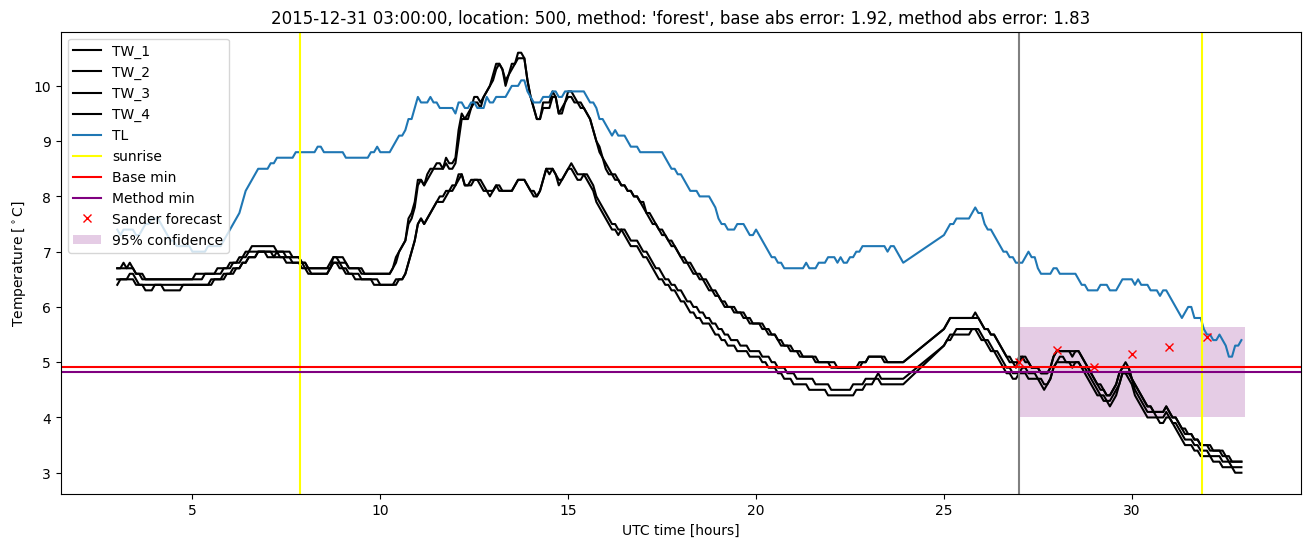
Random forest plots

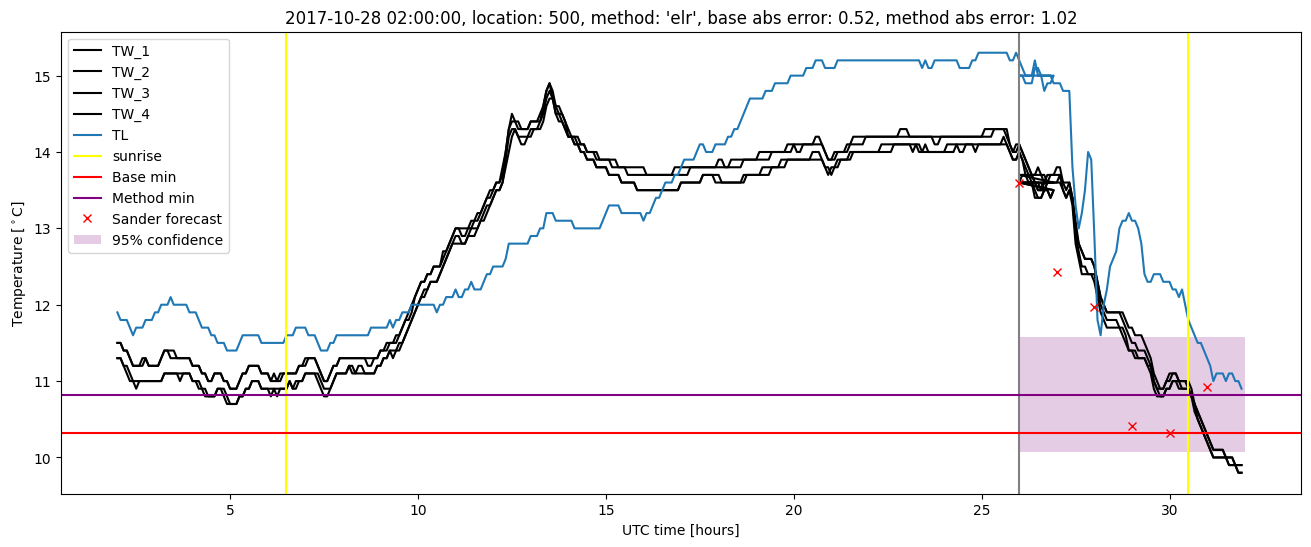
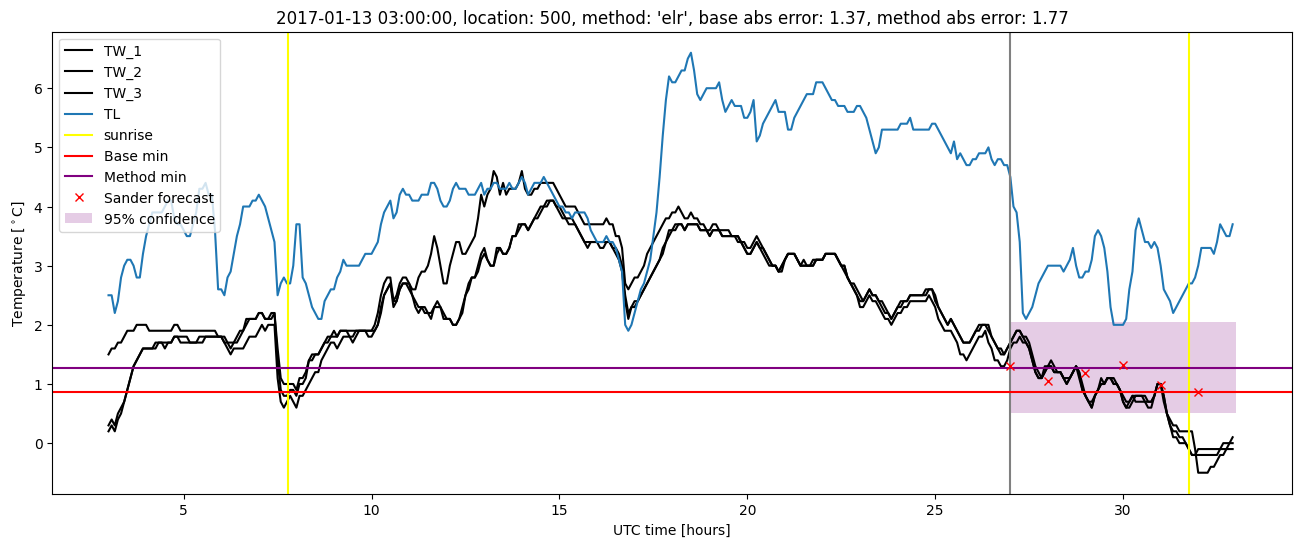
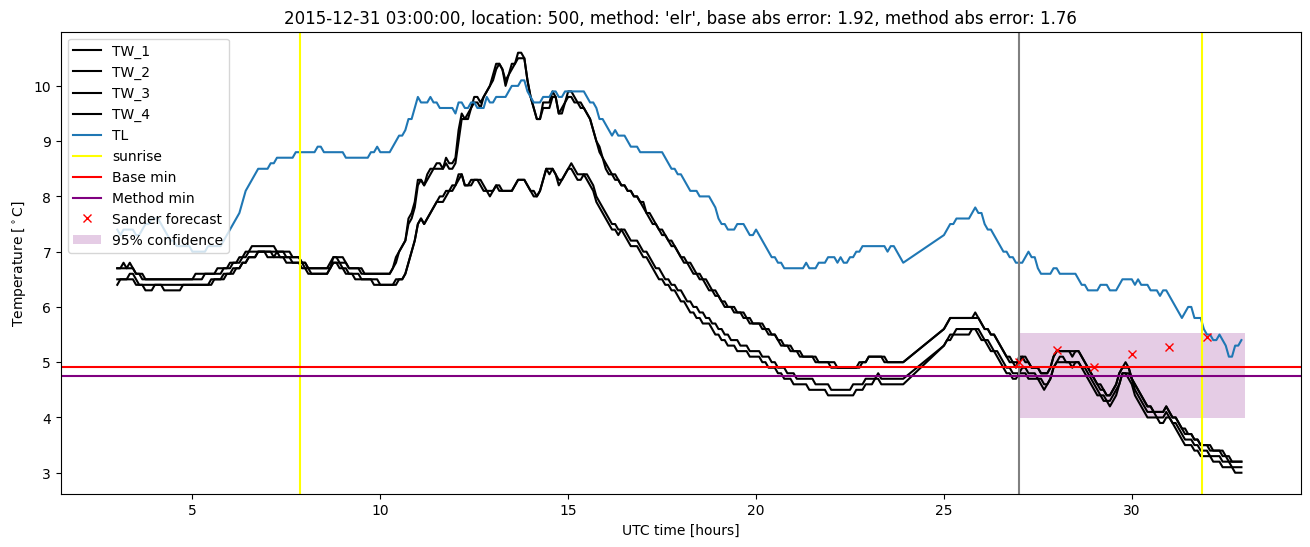
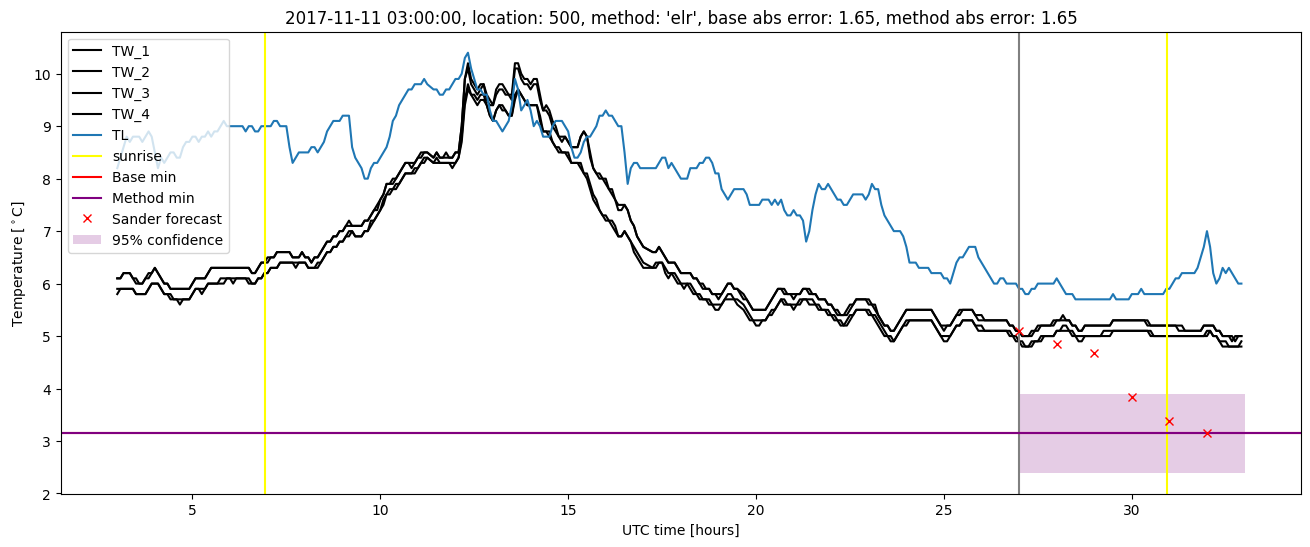
Extended logistic regression results
| names |
period |
power |
significance |
meanSquareError |
absError |
maxError |
CRPS |
IGN |
| baseline |
winter 2016 |
0.977 |
0.059 |
0.300 |
0.414 |
1.915 |
NaN |
NaN |
| elr |
winter 2016 |
1.000 |
0.059 |
0.269 |
0.406 |
1.757 |
0.565 |
7.364 |
| baseline |
winter 2017 |
0.960 |
0.071 |
0.356 |
0.459 |
2.021 |
NaN |
NaN |
| elr |
winter 2017 |
0.976 |
0.107 |
0.277 |
0.411 |
1.770 |
0.525 |
6.463 |
| baseline |
winter 2018 |
0.993 |
0.130 |
0.289 |
0.408 |
1.650 |
NaN |
NaN |
| elr |
winter 2018 |
0.979 |
0.130 |
0.254 |
0.384 |
1.650 |
0.538 |
7.287 |
| baseline |
winter 2019 |
0.979 |
0.000e+00 |
0.255 |
0.383 |
1.528 |
NaN |
NaN |
| elr |
winter 2019 |
0.986 |
0.000e+00 |
0.226 |
0.358 |
1.619 |
0.526 |
5.940 |
| baseline |
all |
0.978 |
0.078 |
0.300 |
0.416 |
2.021 |
NaN |
NaN |
| elr |
all |
0.986 |
0.091 |
0.257 |
0.391 |
1.770 |
0.540 |
6.812 |
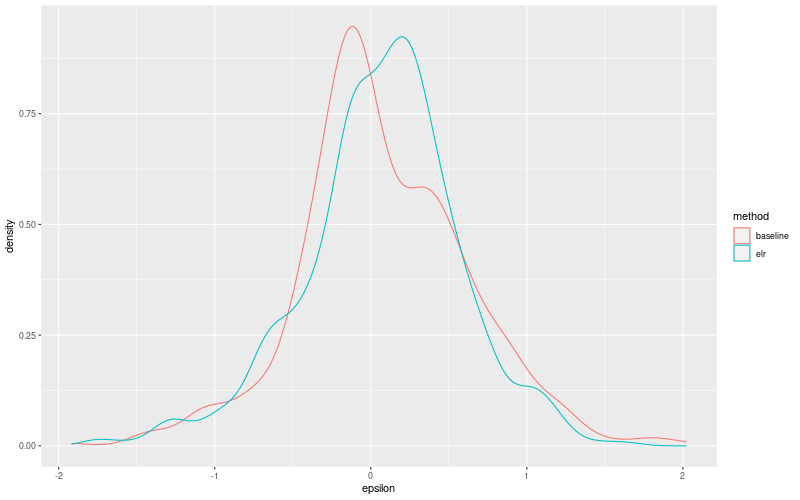
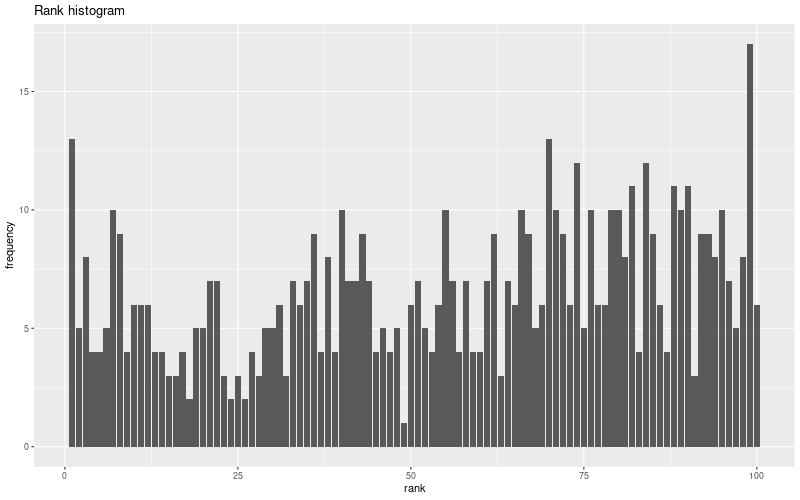
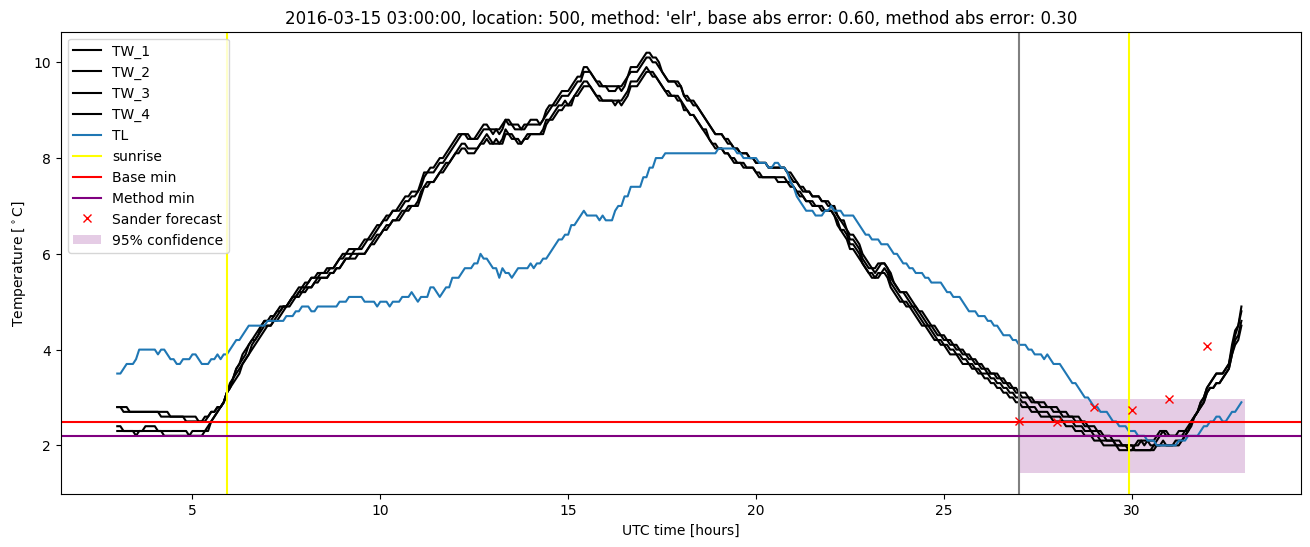
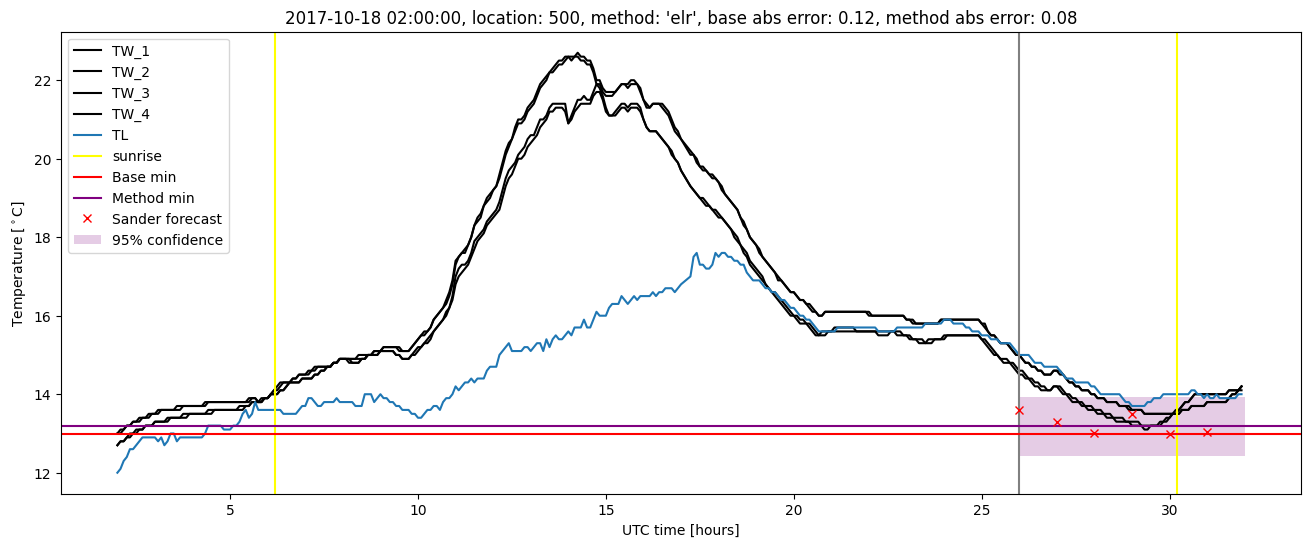
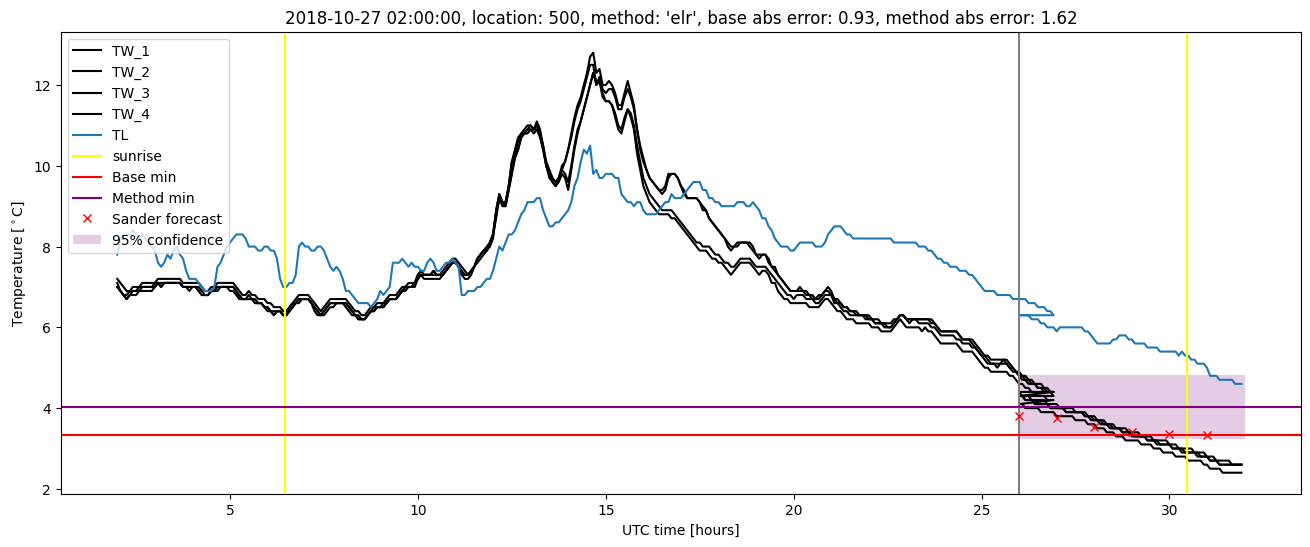
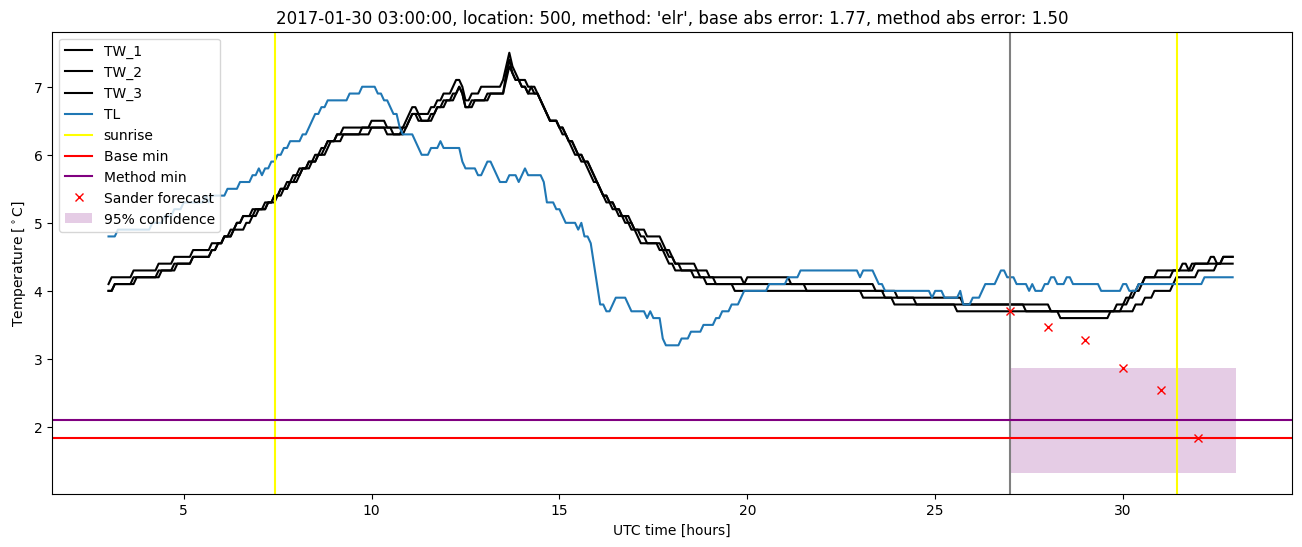
Extended logistic regression plots