GMS location: 480
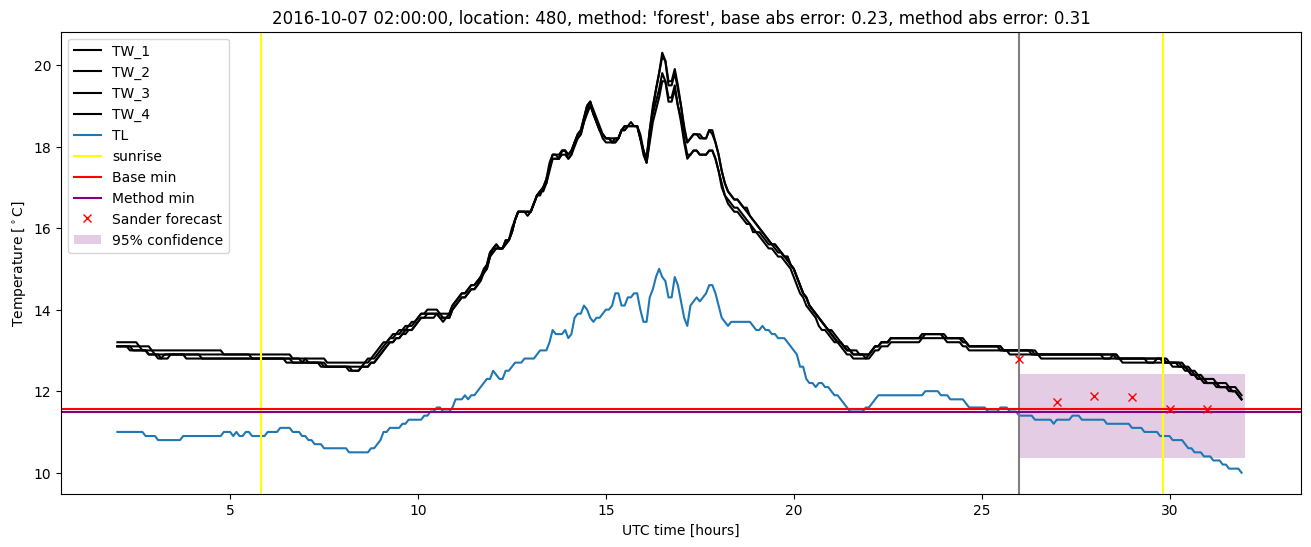
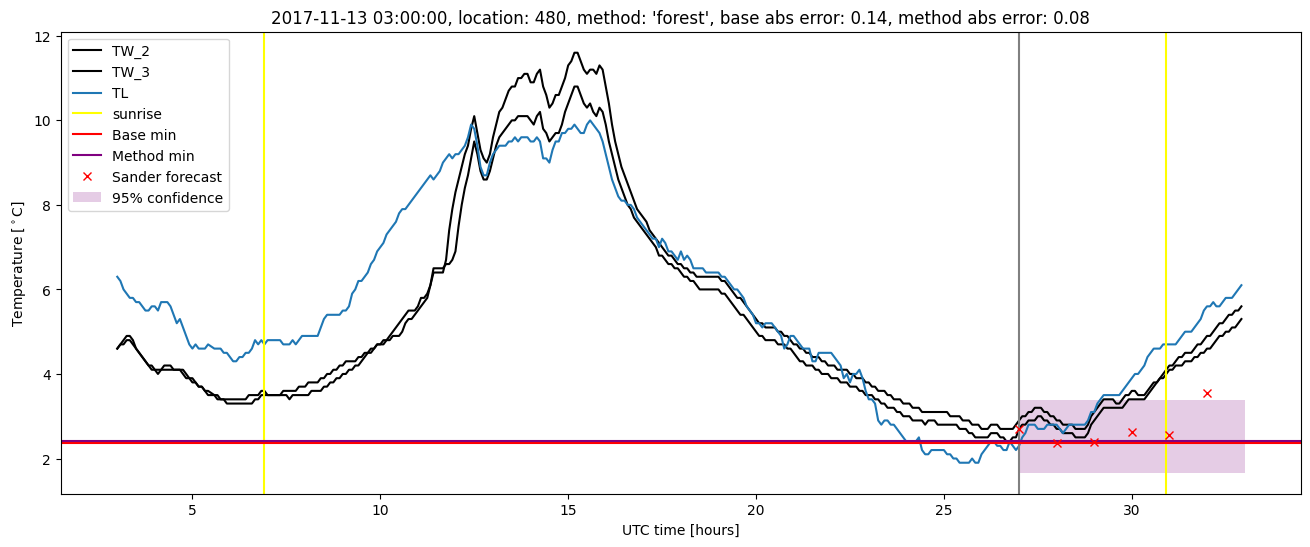
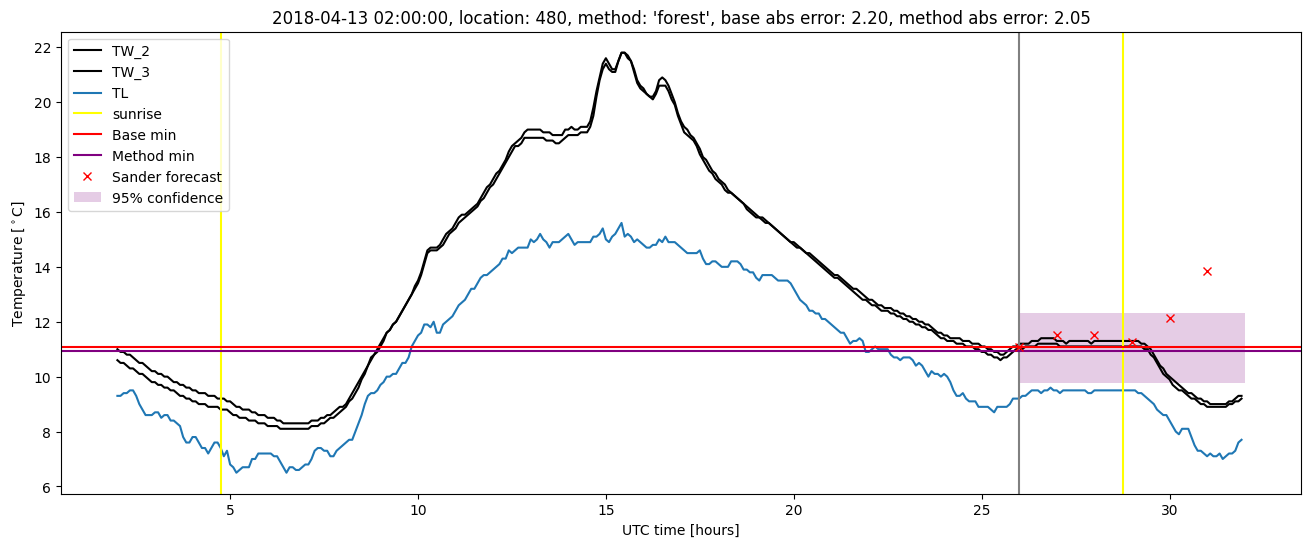
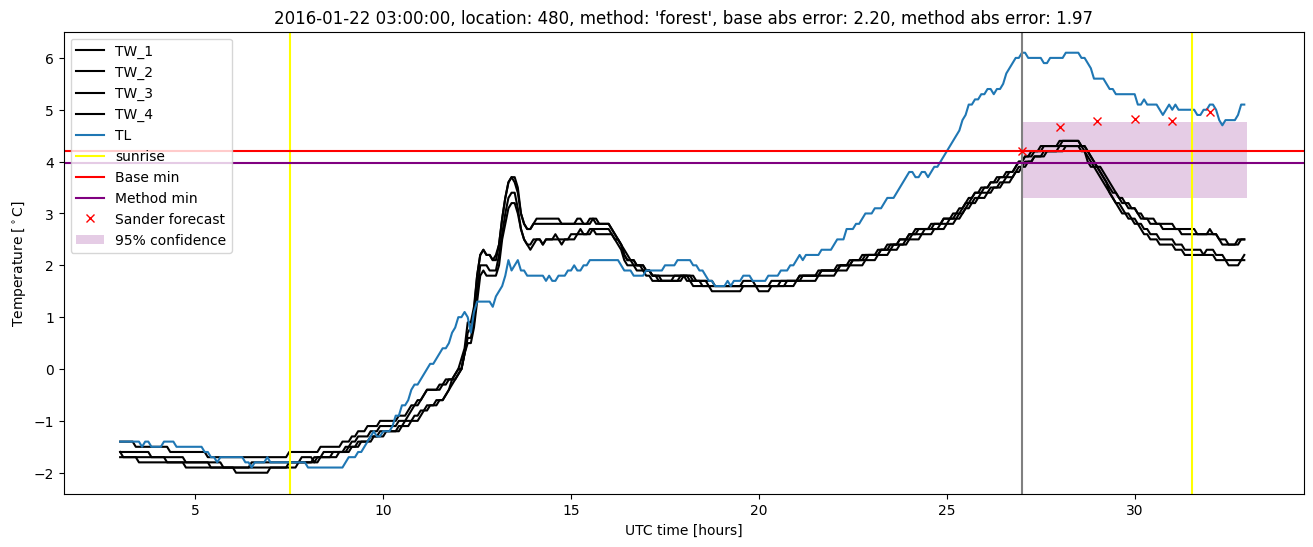
Random forest results
| names |
period |
power |
significance |
meanSquareError |
absError |
maxError |
CRPS |
IGN |
| baseline |
winter 2016 |
0.982 |
0.105 |
0.383 |
0.453 |
2.200 |
NaN |
NaN |
| forest |
winter 2016 |
0.982 |
0.158 |
0.297 |
0.393 |
1.971 |
0.492 |
4.352 |
| baseline |
winter 2017 |
0.966 |
0.083 |
0.414 |
0.453 |
2.450 |
NaN |
NaN |
| forest |
winter 2017 |
0.974 |
0.111 |
0.303 |
0.402 |
1.911 |
0.478 |
3.182 |
| baseline |
winter 2018 |
0.976 |
0.114 |
0.384 |
0.471 |
2.197 |
NaN |
NaN |
| forest |
winter 2018 |
0.992 |
0.086 |
0.309 |
0.409 |
2.048 |
0.490 |
3.307 |
| baseline |
winter 2019 |
0.984 |
0.000e+00 |
0.295 |
0.393 |
2.078 |
NaN |
NaN |
| forest |
winter 2019 |
0.992 |
0.071 |
0.205 |
0.343 |
1.314 |
0.468 |
2.738 |
| baseline |
all |
0.978 |
0.086 |
0.371 |
0.445 |
2.450 |
NaN |
NaN |
| forest |
all |
0.985 |
0.106 |
0.281 |
0.388 |
2.048 |
0.483 |
3.460 |
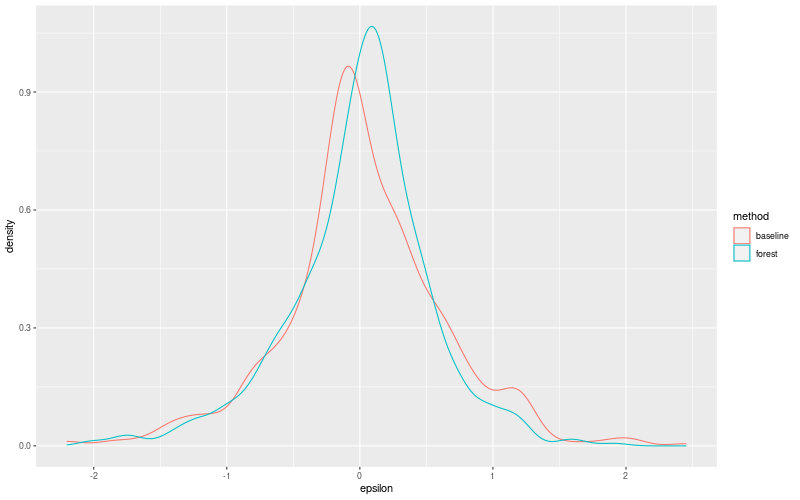
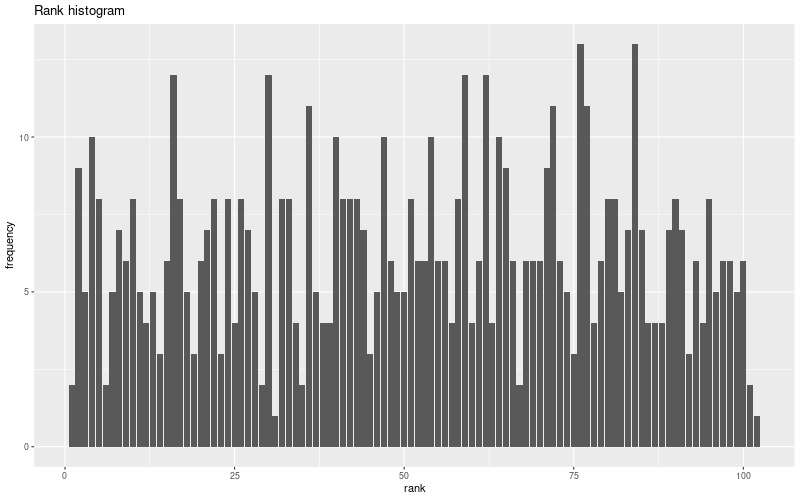
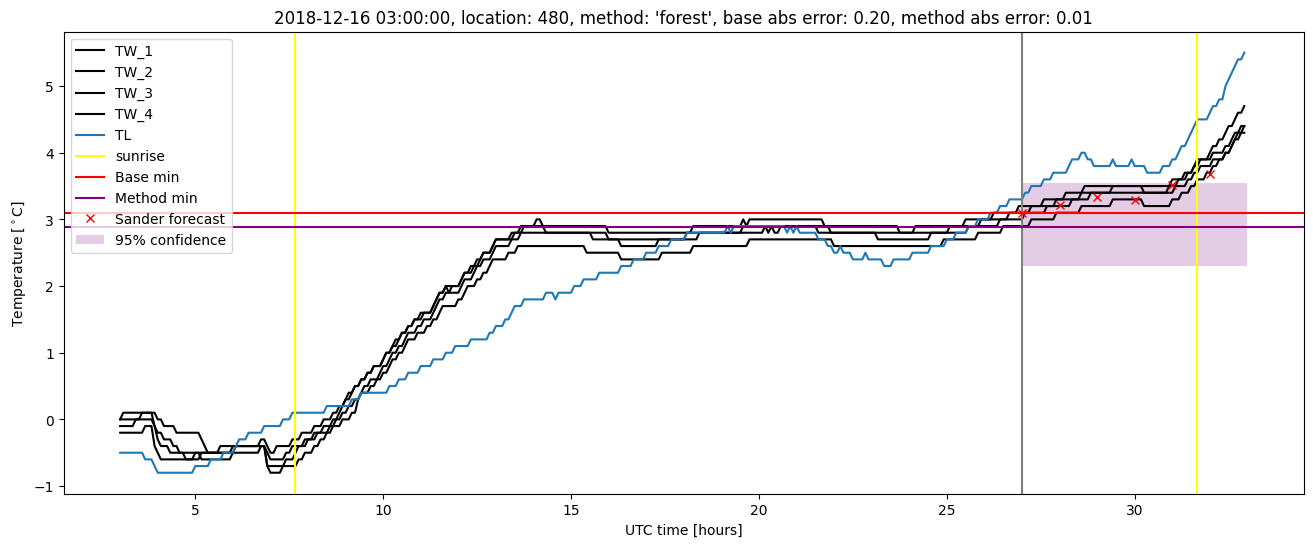
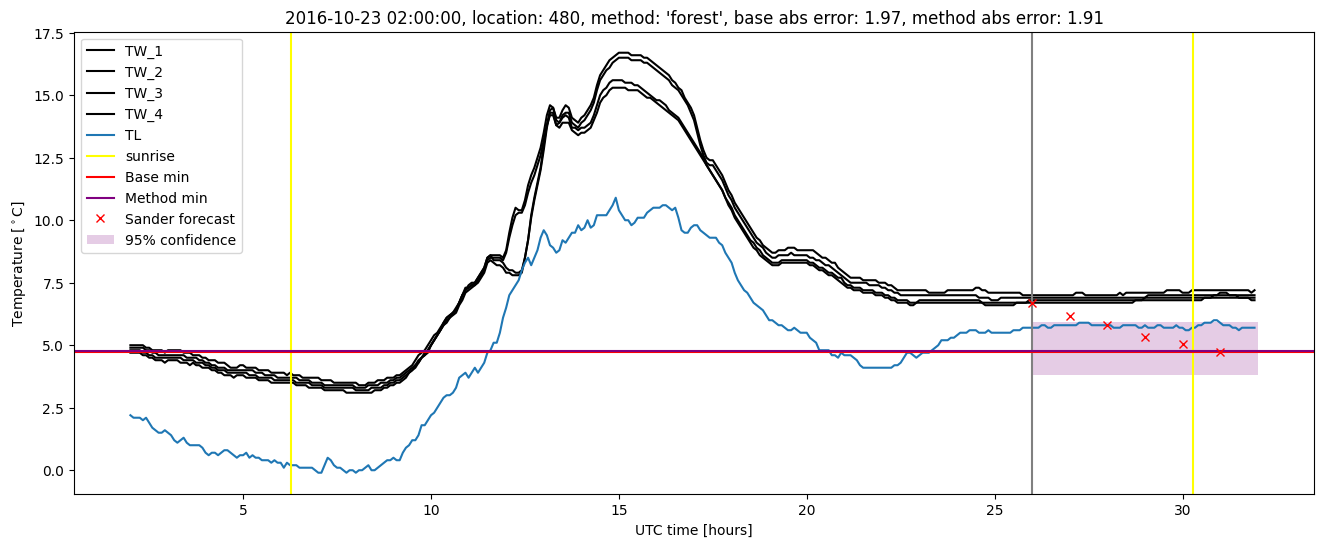
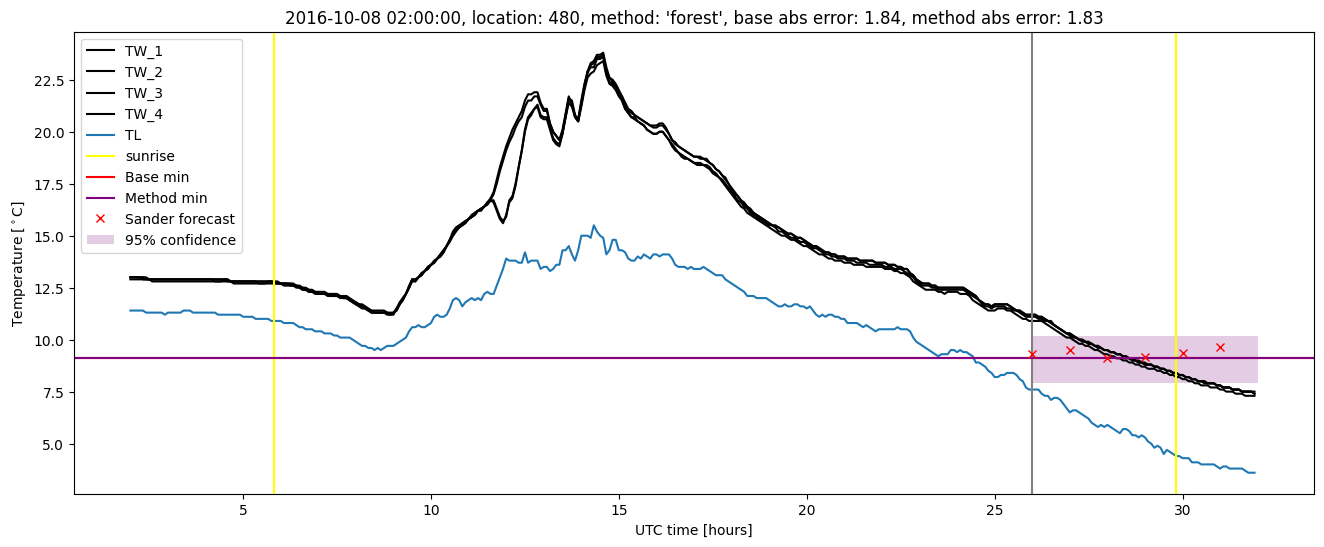
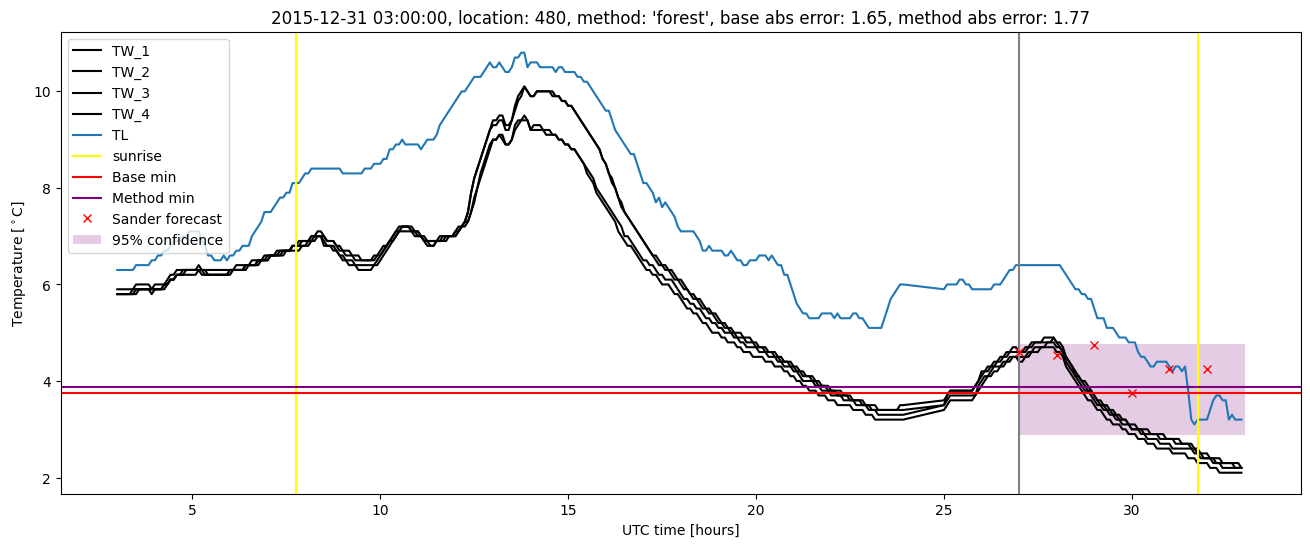
Random forest plots
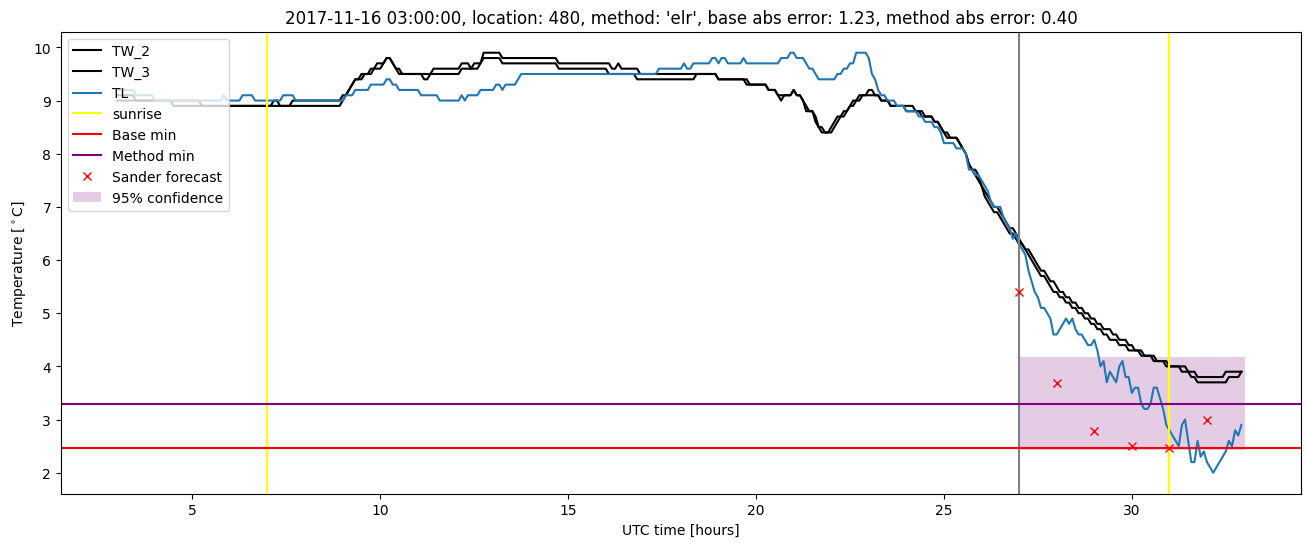
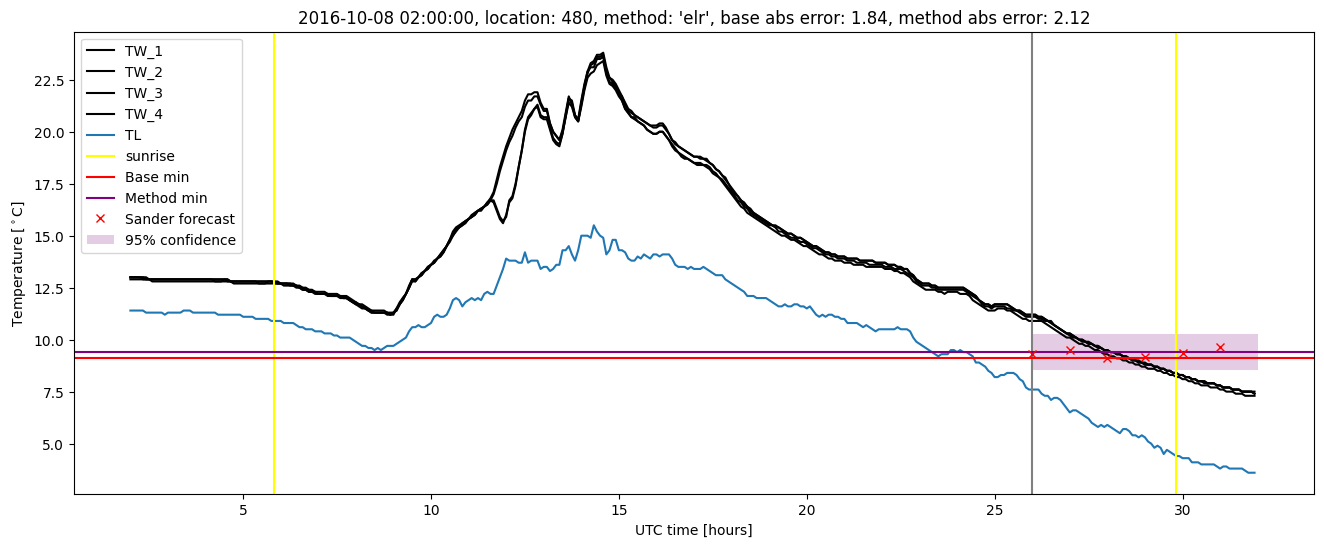
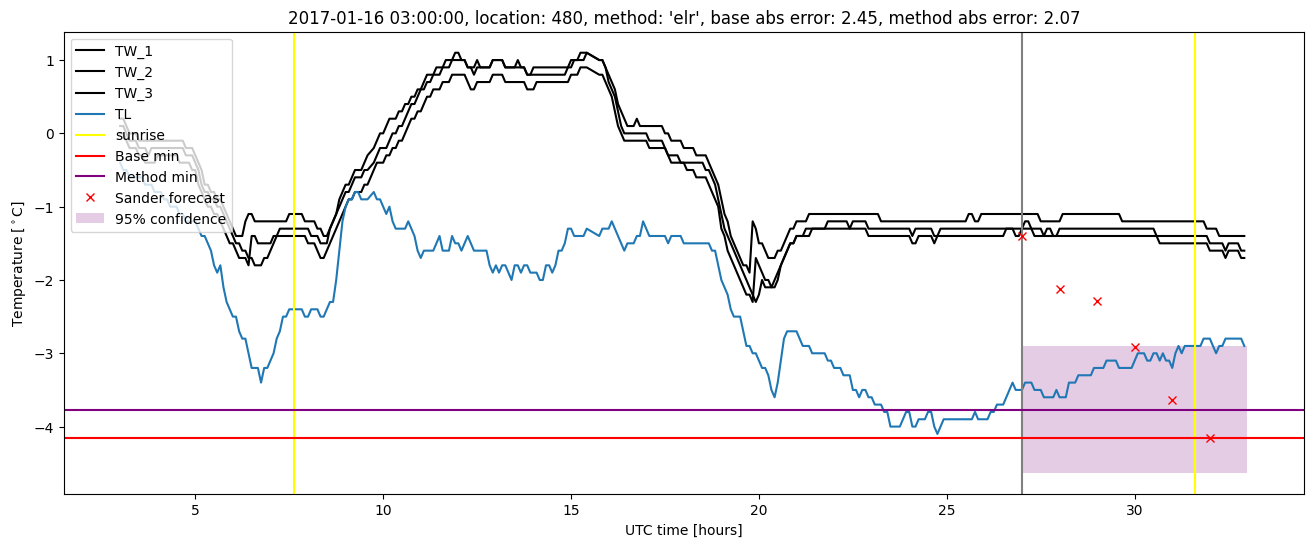
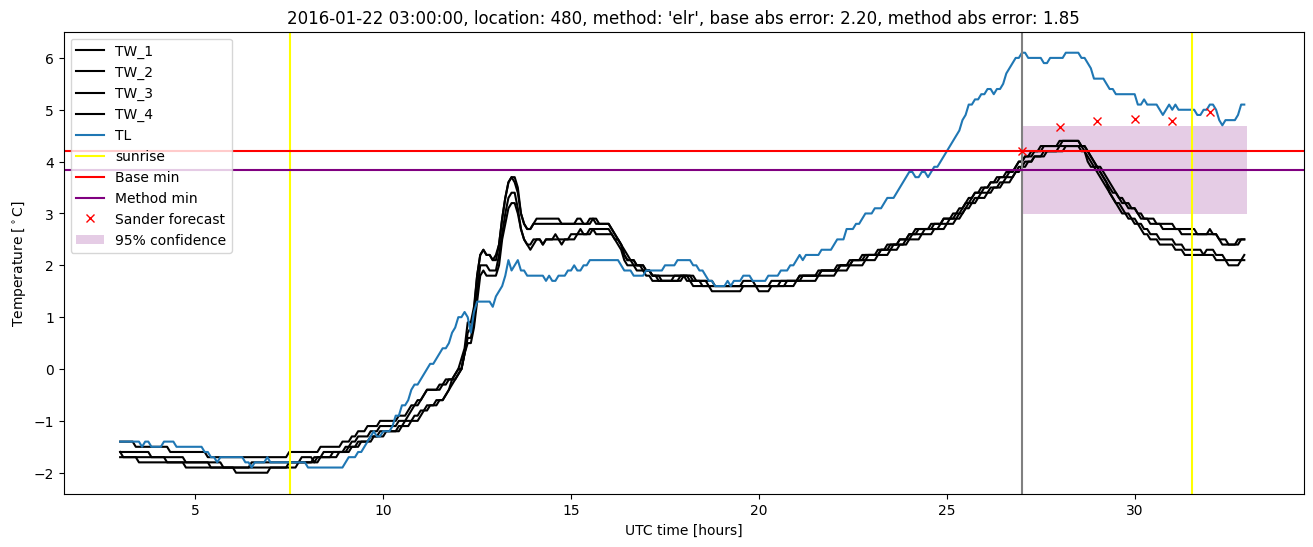
Extended logistic regression results
| names |
period |
power |
significance |
meanSquareError |
absError |
maxError |
CRPS |
IGN |
| baseline |
winter 2016 |
0.982 |
0.105 |
0.383 |
0.453 |
2.200 |
NaN |
NaN |
| elr |
winter 2016 |
0.982 |
0.210 |
0.318 |
0.435 |
1.847 |
0.577 |
5.337 |
| baseline |
winter 2017 |
0.966 |
0.083 |
0.414 |
0.453 |
2.450 |
NaN |
NaN |
| elr |
winter 2017 |
0.974 |
0.111 |
0.349 |
0.427 |
2.123 |
0.535 |
4.461 |
| baseline |
winter 2018 |
0.976 |
0.114 |
0.384 |
0.471 |
2.197 |
NaN |
NaN |
| elr |
winter 2018 |
0.992 |
0.114 |
0.309 |
0.420 |
1.833 |
0.555 |
4.531 |
| baseline |
winter 2019 |
0.984 |
0.000e+00 |
0.295 |
0.393 |
2.078 |
NaN |
NaN |
| elr |
winter 2019 |
0.992 |
0.071 |
0.252 |
0.387 |
1.518 |
0.532 |
3.842 |
| baseline |
all |
0.978 |
0.086 |
0.371 |
0.445 |
2.450 |
NaN |
NaN |
| elr |
all |
0.985 |
0.125 |
0.309 |
0.419 |
2.123 |
0.552 |
4.600 |
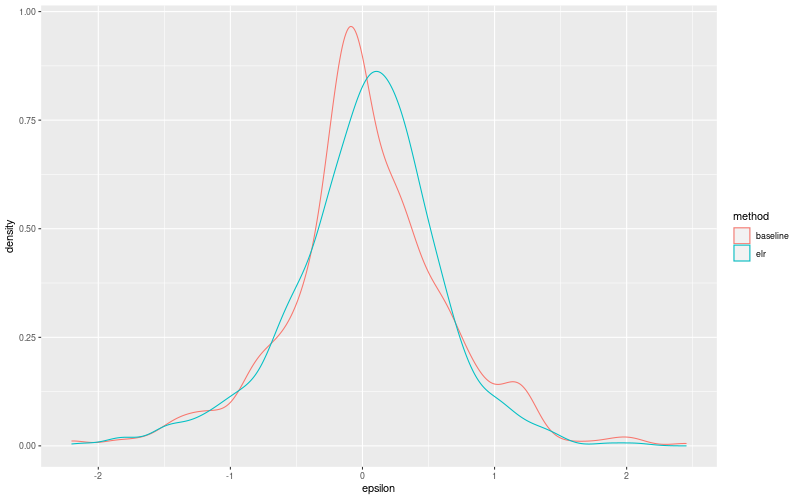
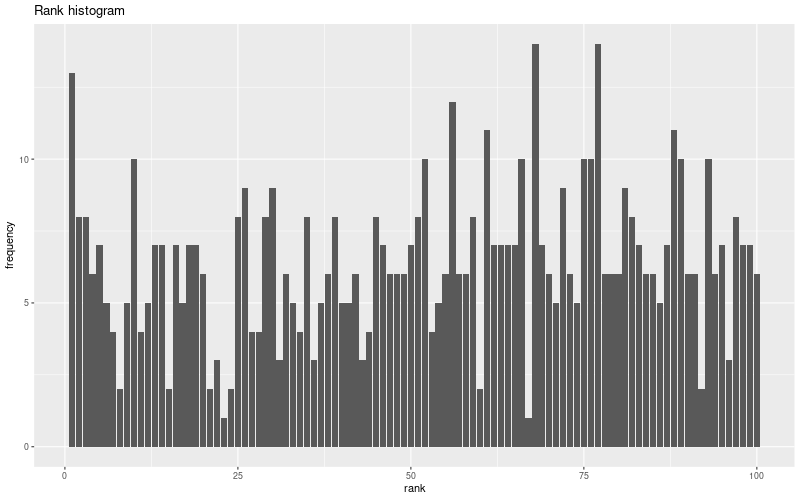
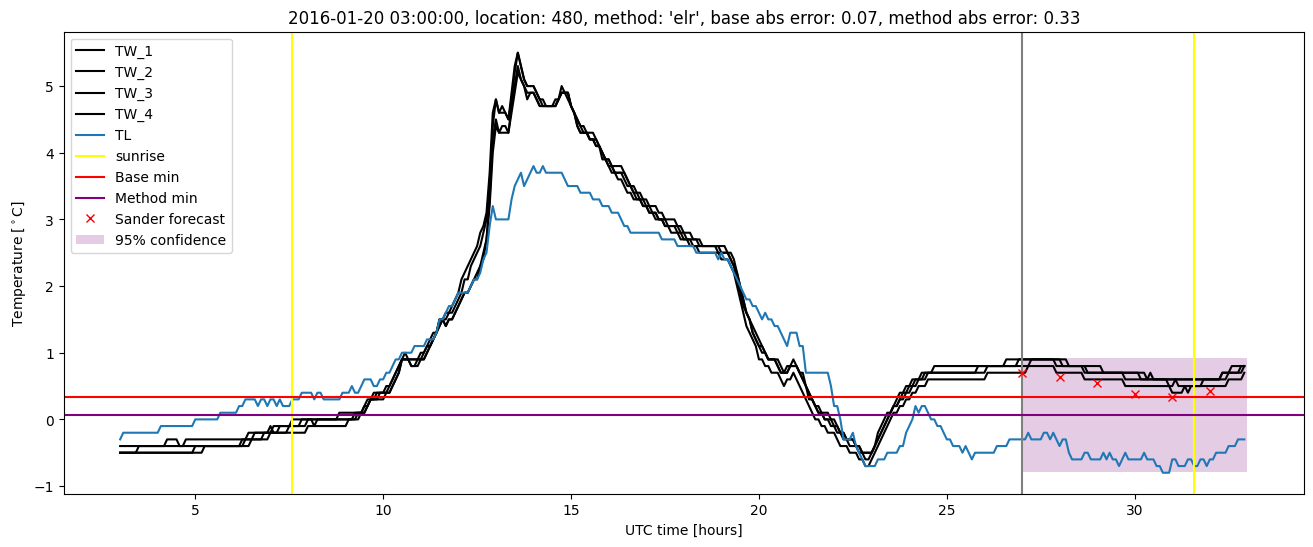
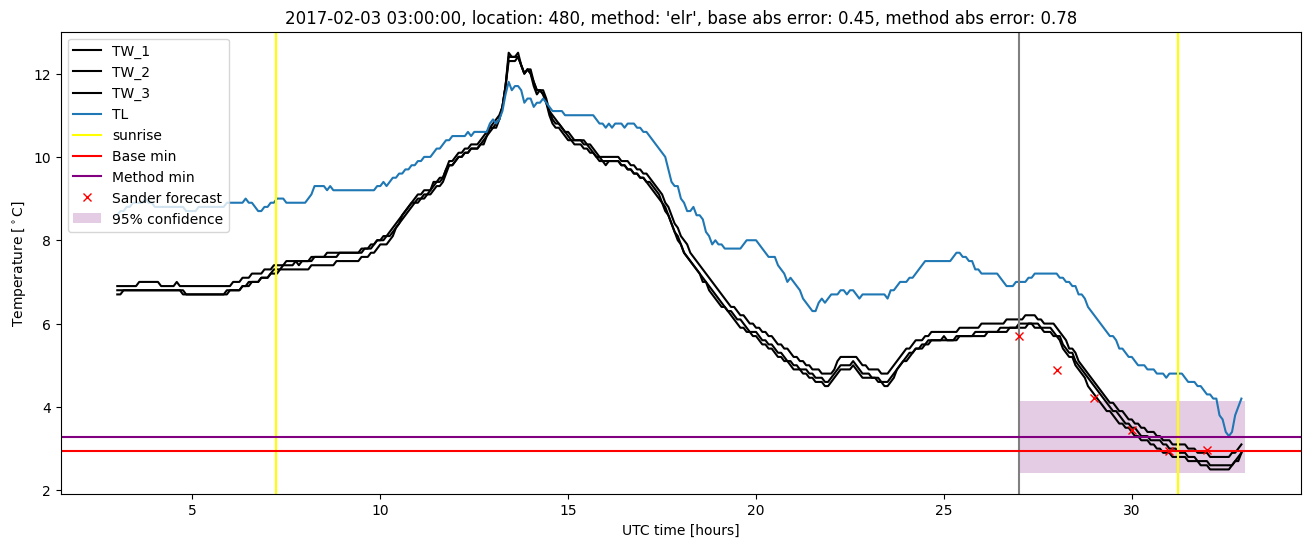
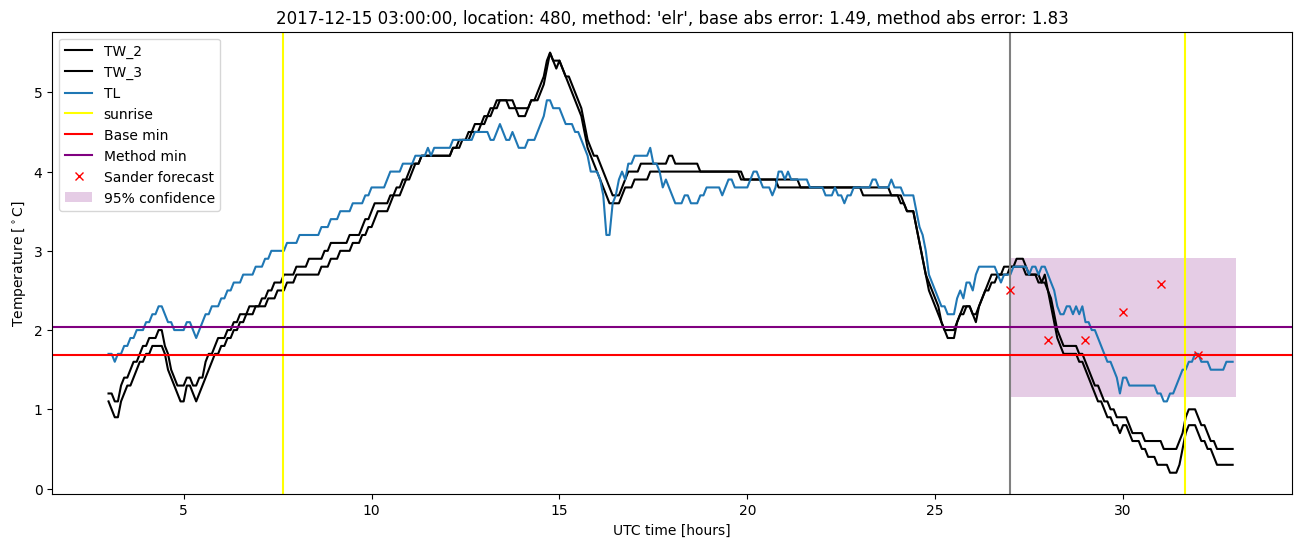
Extended logistic regression plots