GMS location: 478
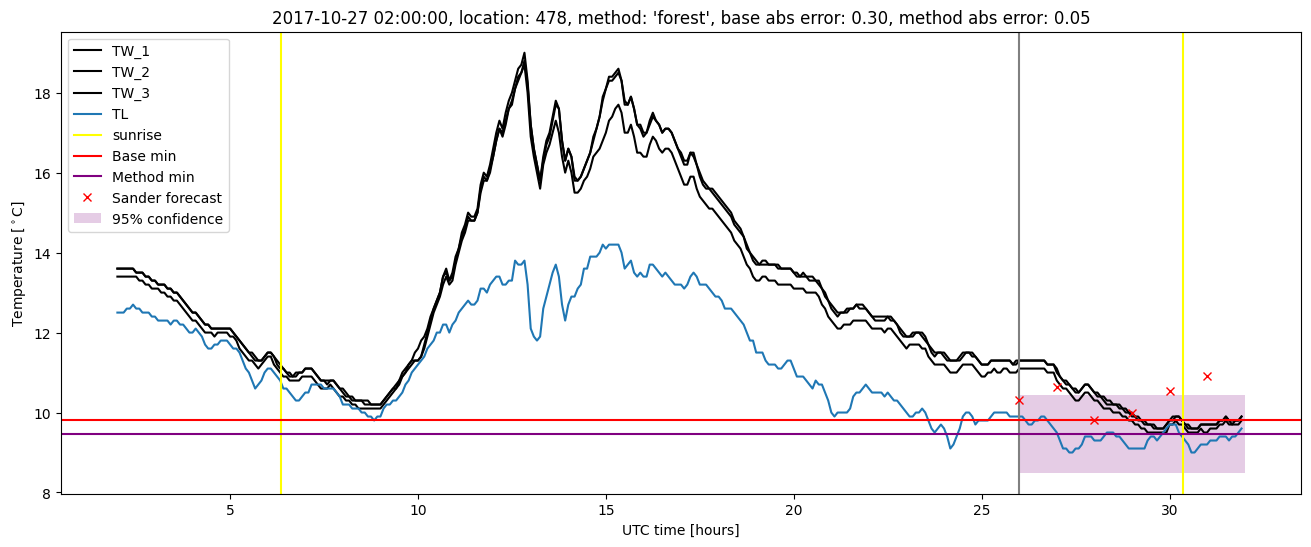
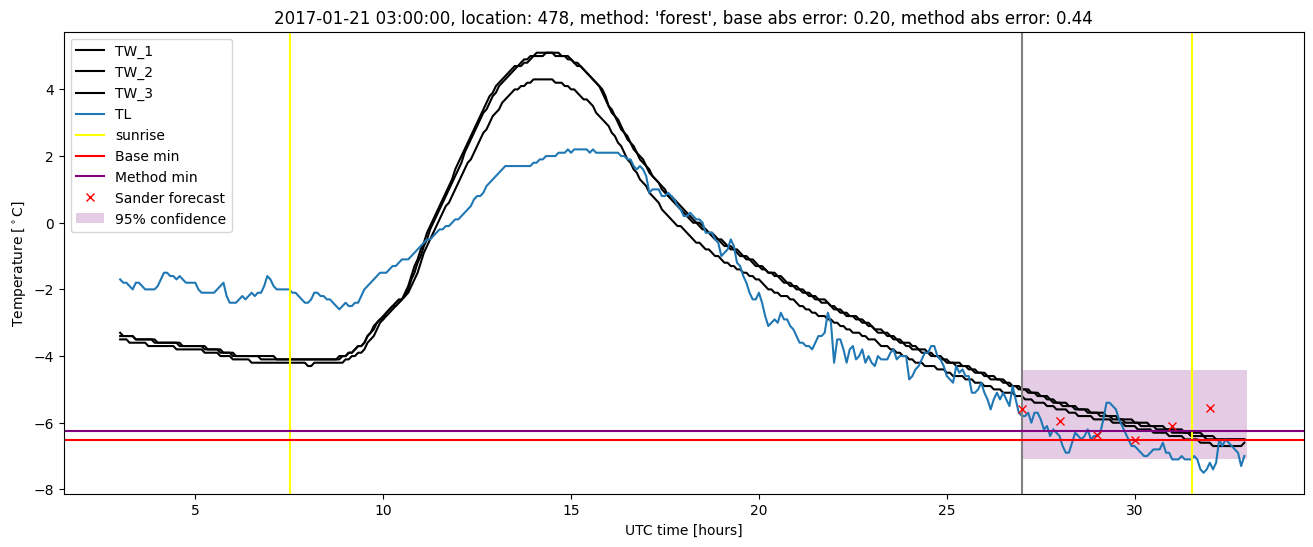
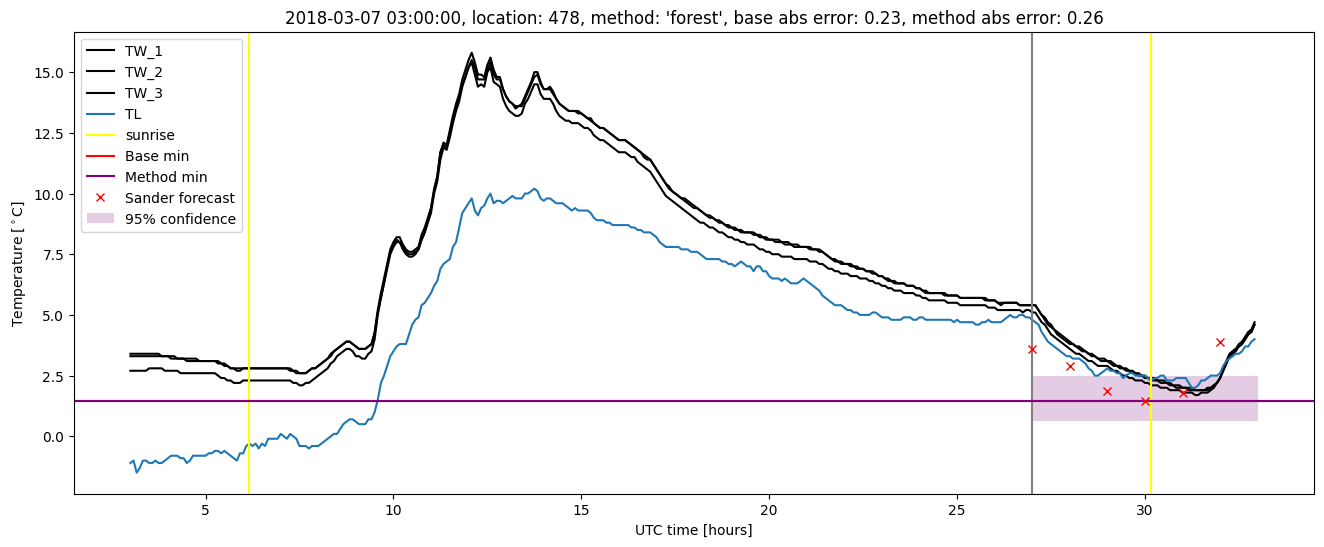
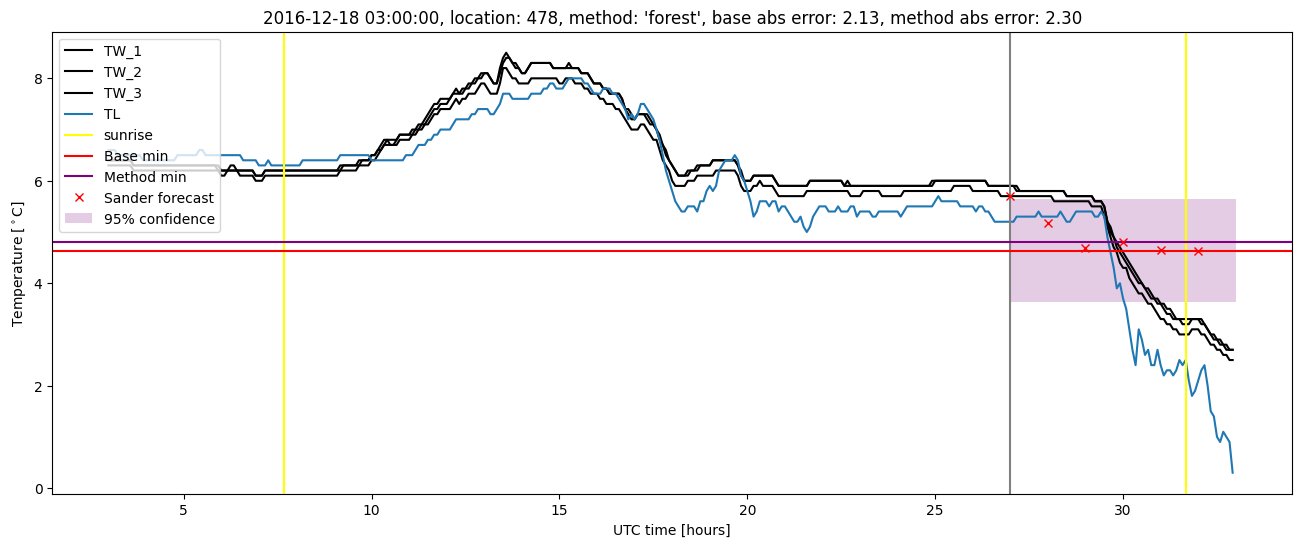
Random forest results
| names |
period |
power |
significance |
meanSquareError |
absError |
maxError |
CRPS |
IGN |
| baseline |
winter 2016 |
0.976 |
0.048 |
0.392 |
0.459 |
2.366 |
NaN |
NaN |
| forest |
winter 2016 |
0.970 |
0.000e+00 |
0.330 |
0.416 |
2.139 |
0.553 |
3.377 |
| baseline |
winter 2017 |
0.982 |
0.024 |
0.395 |
0.454 |
2.597 |
NaN |
NaN |
| forest |
winter 2017 |
0.991 |
0.049 |
0.358 |
0.430 |
2.295 |
0.525 |
2.840 |
| baseline |
winter 2018 |
0.993 |
0.212 |
0.511 |
0.520 |
2.165 |
NaN |
NaN |
| forest |
winter 2018 |
0.978 |
0.121 |
0.447 |
0.479 |
2.247 |
0.544 |
2.956 |
| baseline |
winter 2019 |
0.993 |
0.062 |
0.325 |
0.422 |
2.072 |
NaN |
NaN |
| forest |
winter 2019 |
0.986 |
0.062 |
0.248 |
0.365 |
1.467 |
0.551 |
2.521 |
| baseline |
all |
0.986 |
0.090 |
0.407 |
0.464 |
2.597 |
NaN |
NaN |
| forest |
all |
0.980 |
0.063 |
0.346 |
0.423 |
2.295 |
0.544 |
2.945 |
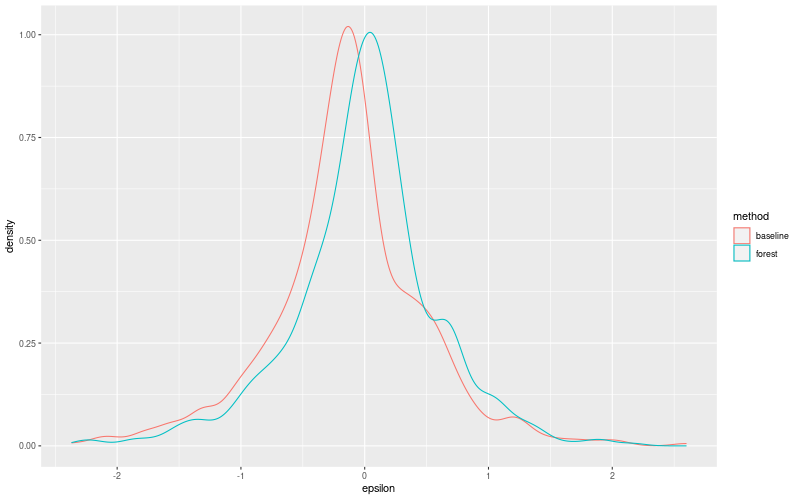
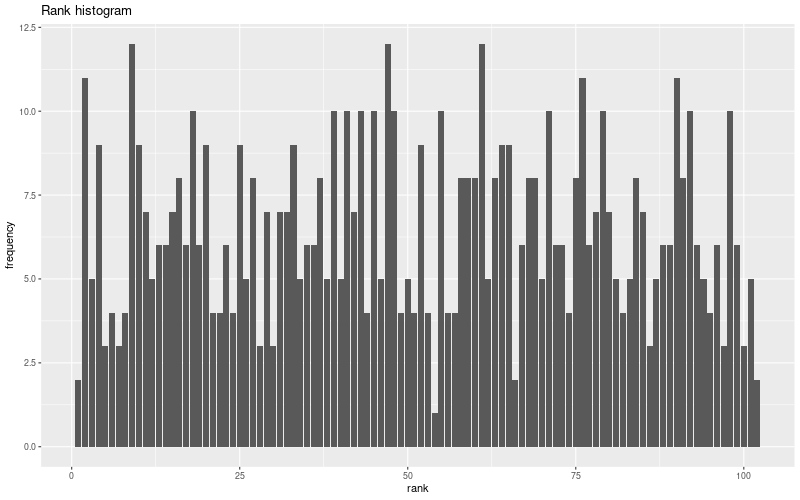
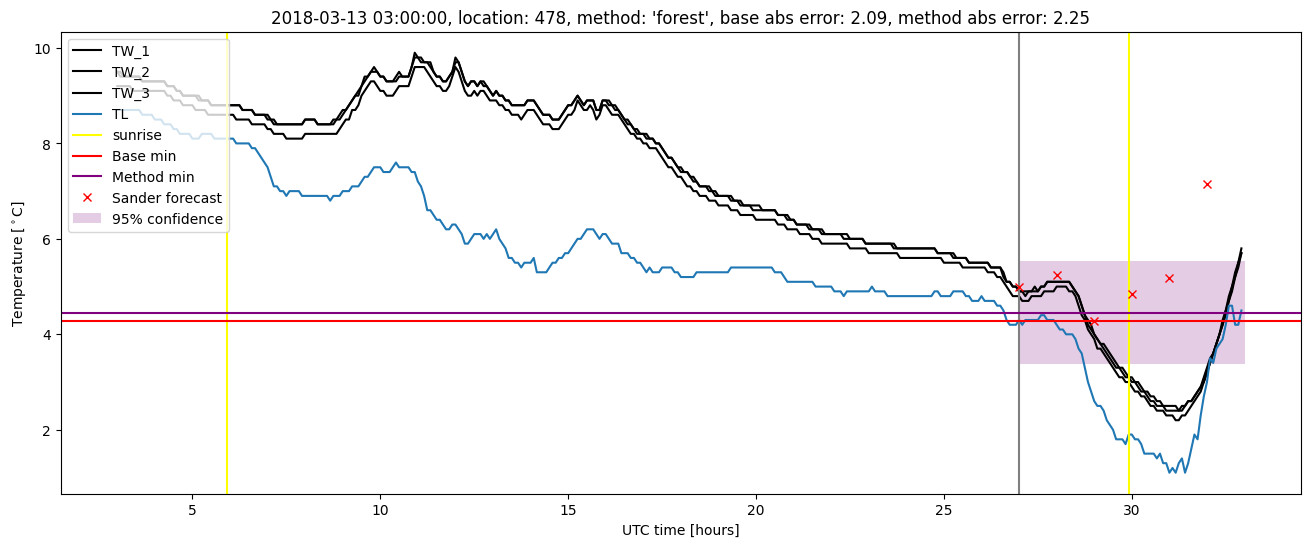
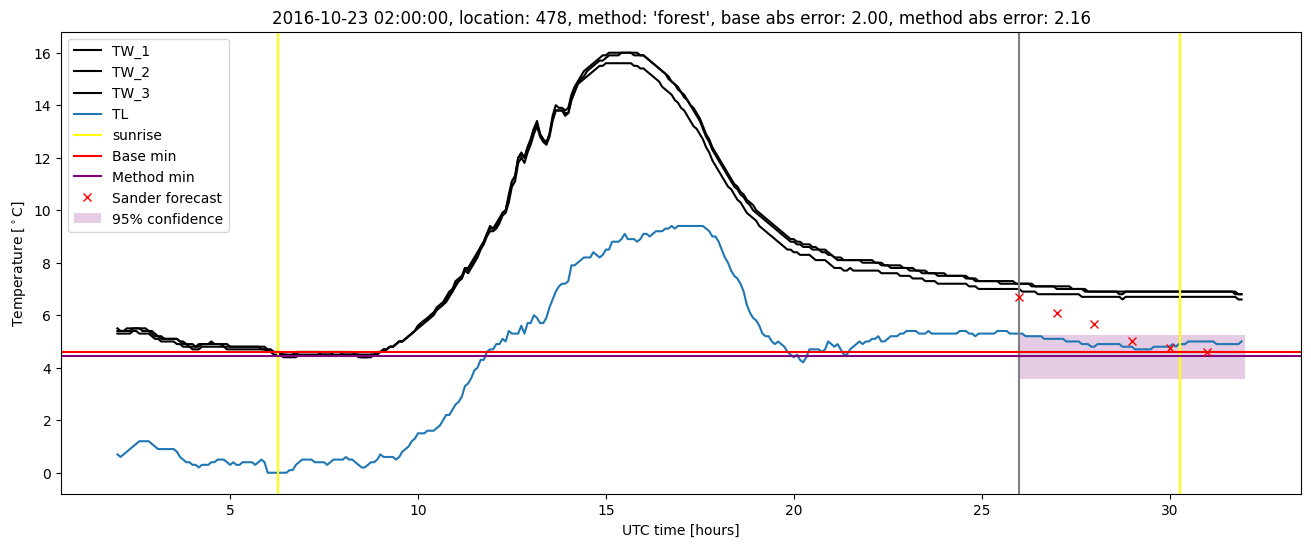
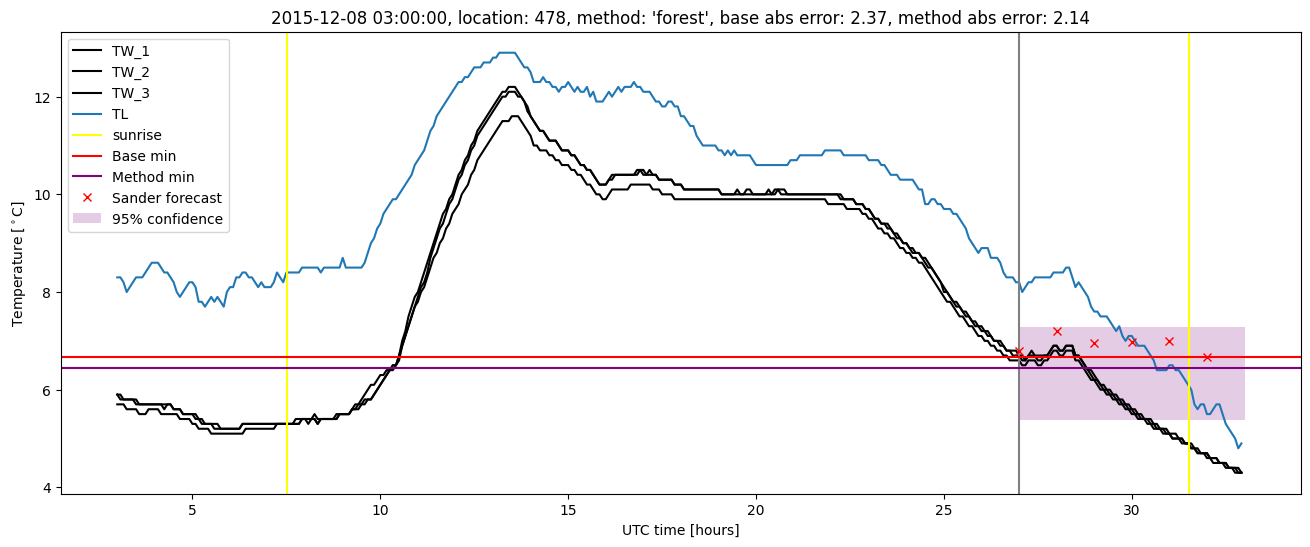
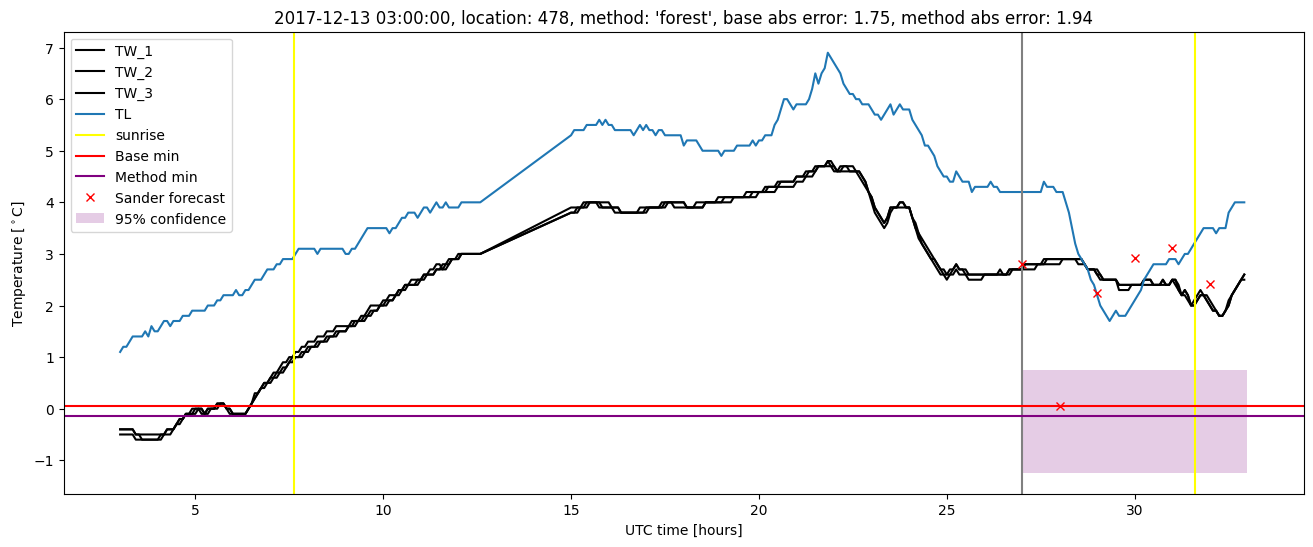
Random forest plots
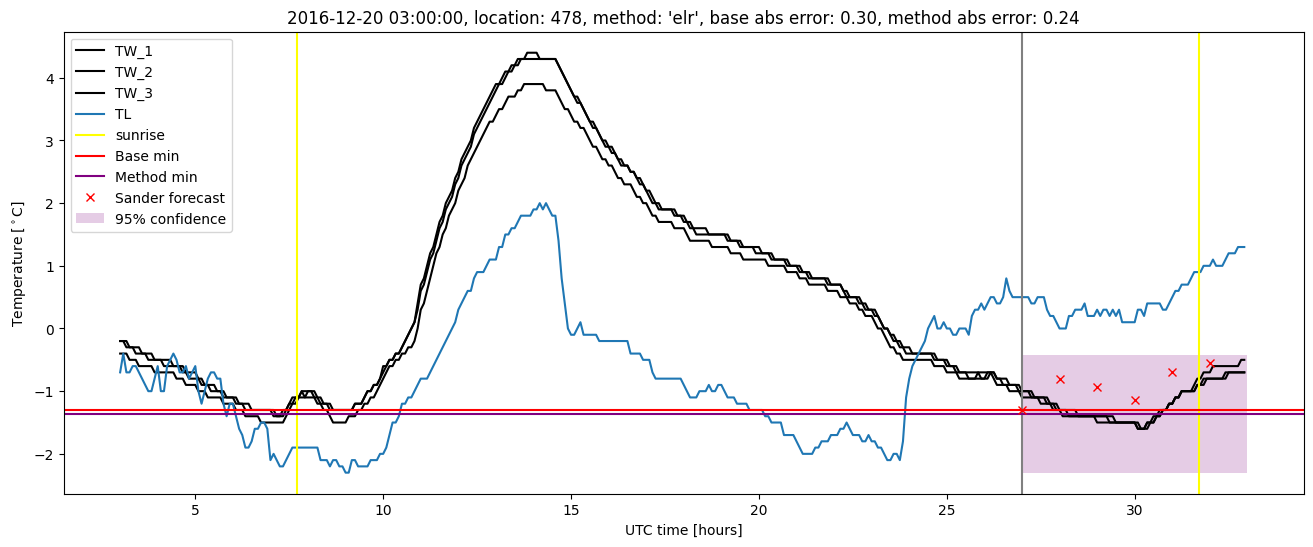
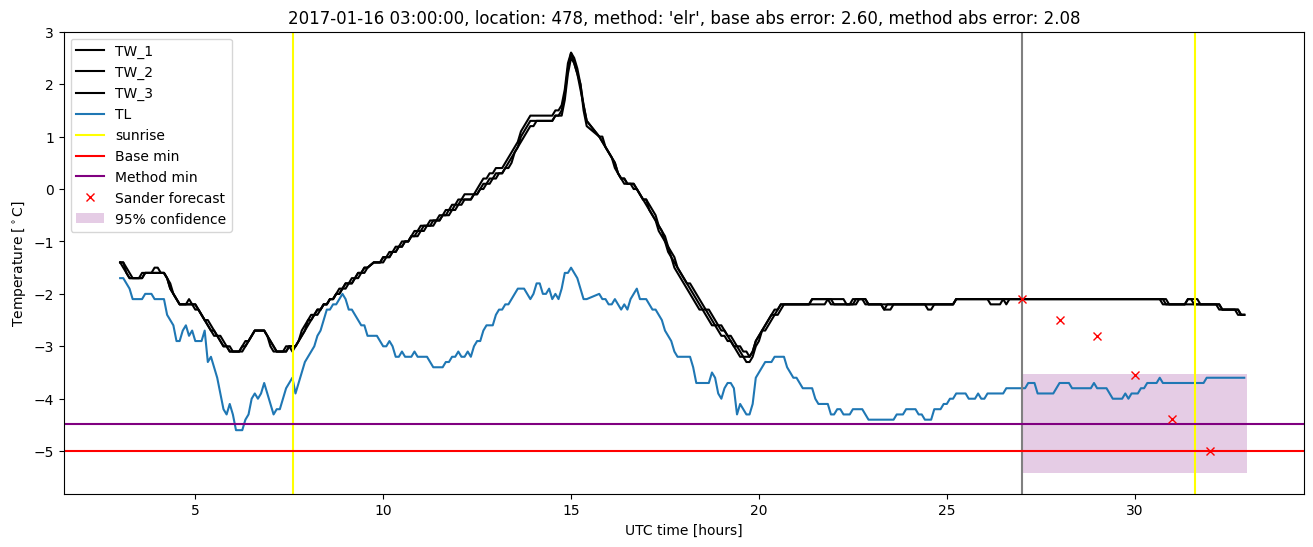
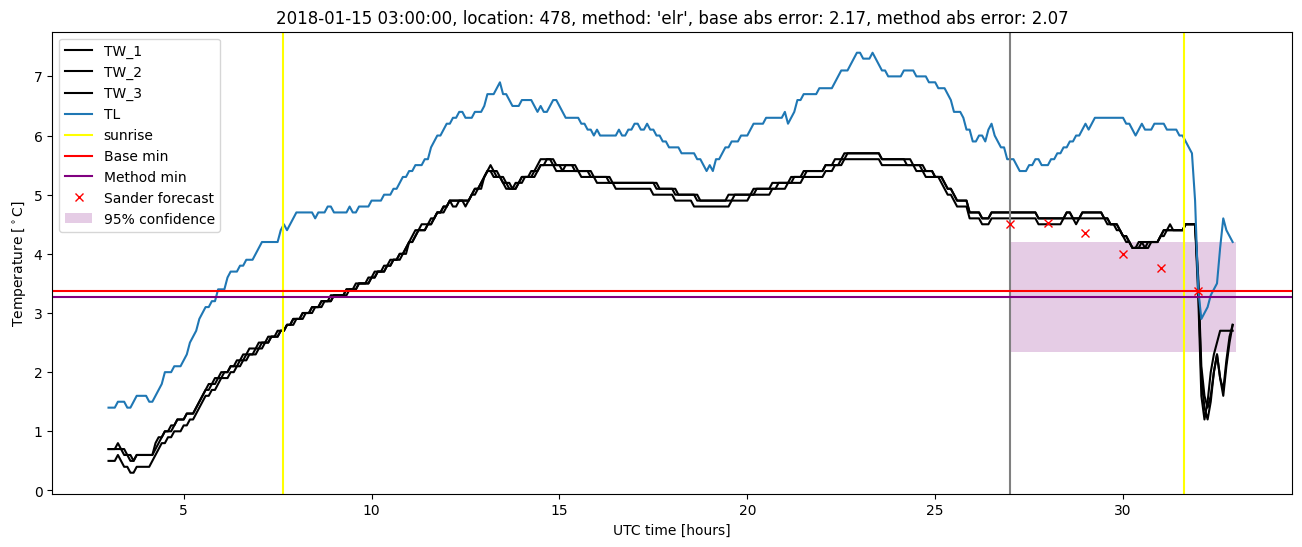
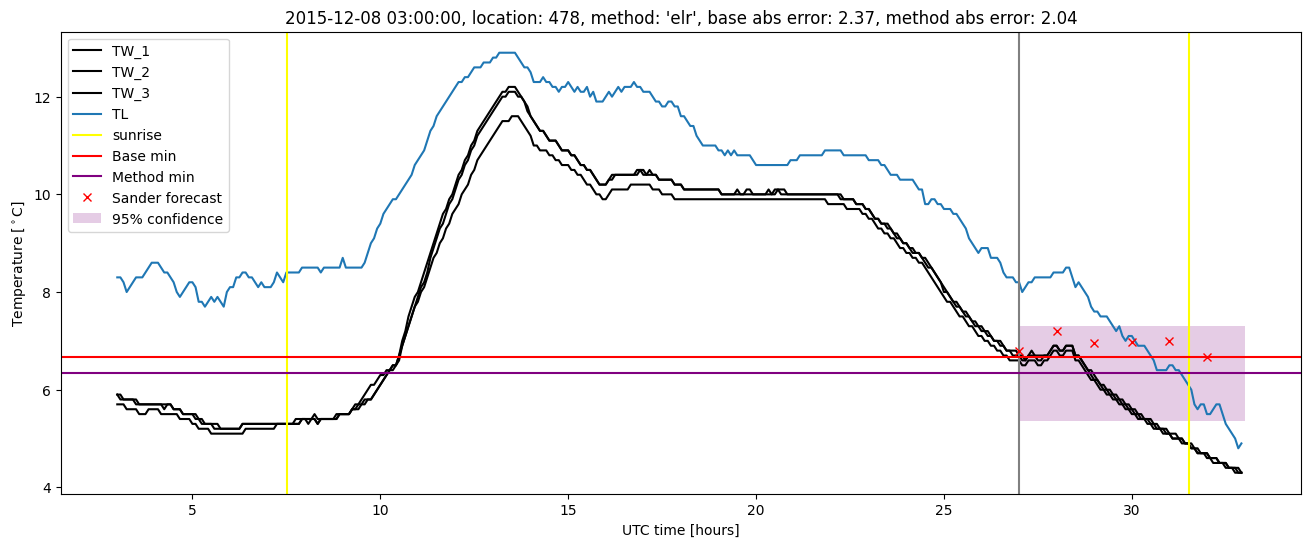
Extended logistic regression results
| names |
period |
power |
significance |
meanSquareError |
absError |
maxError |
CRPS |
IGN |
| baseline |
winter 2016 |
0.976 |
0.048 |
0.392 |
0.459 |
2.366 |
NaN |
NaN |
| elr |
winter 2016 |
0.970 |
0.000e+00 |
0.373 |
0.457 |
2.039 |
0.658 |
4.225 |
| baseline |
winter 2017 |
0.982 |
0.024 |
0.395 |
0.454 |
2.597 |
NaN |
NaN |
| elr |
winter 2017 |
0.982 |
0.024 |
0.361 |
0.468 |
2.076 |
0.580 |
3.861 |
| baseline |
winter 2018 |
0.993 |
0.212 |
0.511 |
0.520 |
2.165 |
NaN |
NaN |
| elr |
winter 2018 |
0.985 |
0.151 |
0.438 |
0.500 |
2.066 |
0.644 |
4.751 |
| baseline |
winter 2019 |
0.993 |
0.062 |
0.325 |
0.422 |
2.072 |
NaN |
NaN |
| elr |
winter 2019 |
0.993 |
0.062 |
0.280 |
0.424 |
1.379 |
0.606 |
3.728 |
| baseline |
all |
0.986 |
0.090 |
0.407 |
0.464 |
2.597 |
NaN |
NaN |
| elr |
all |
0.982 |
0.063 |
0.364 |
0.462 |
2.076 |
0.625 |
4.156 |
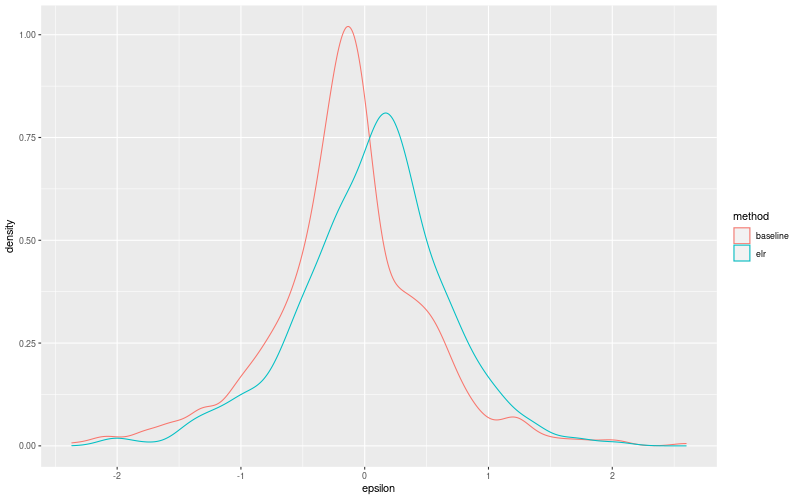
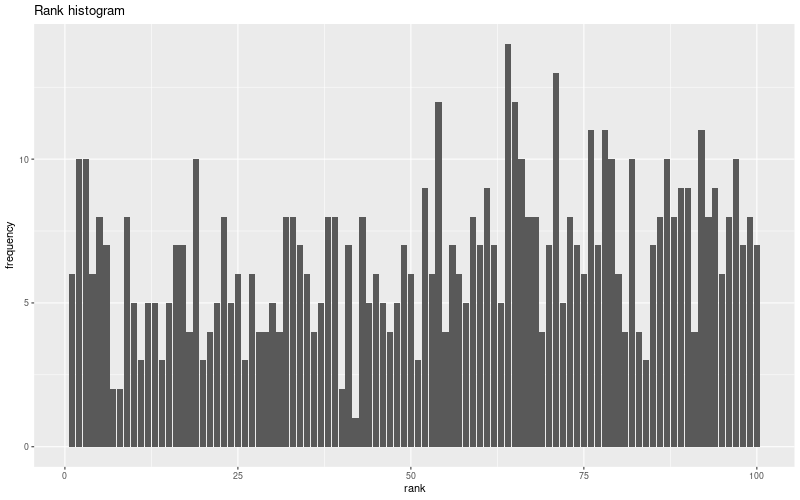
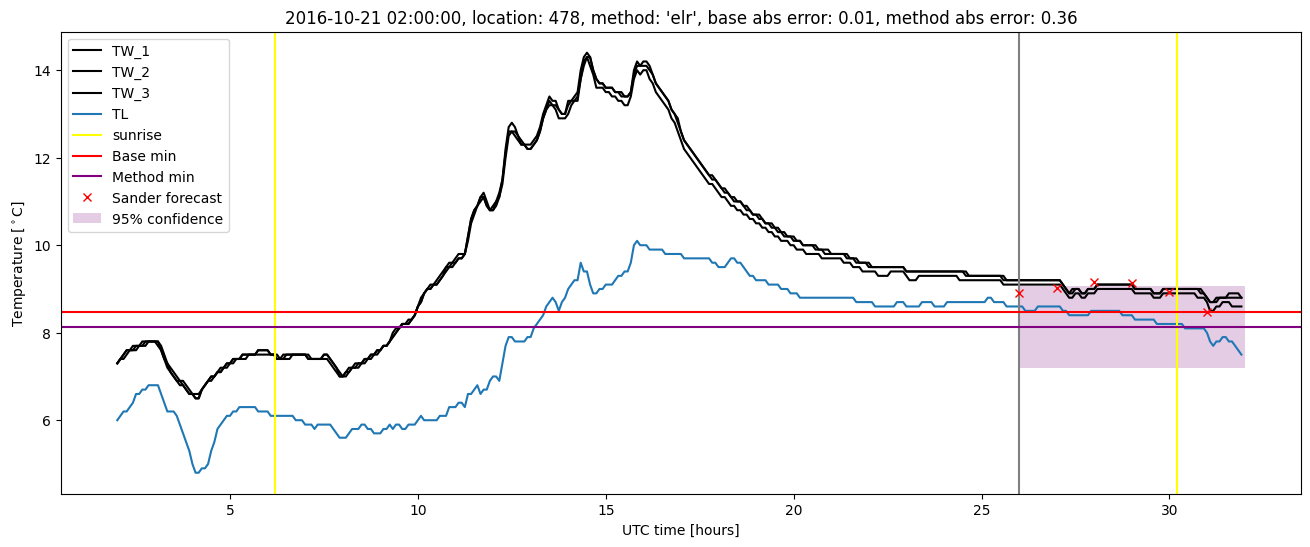
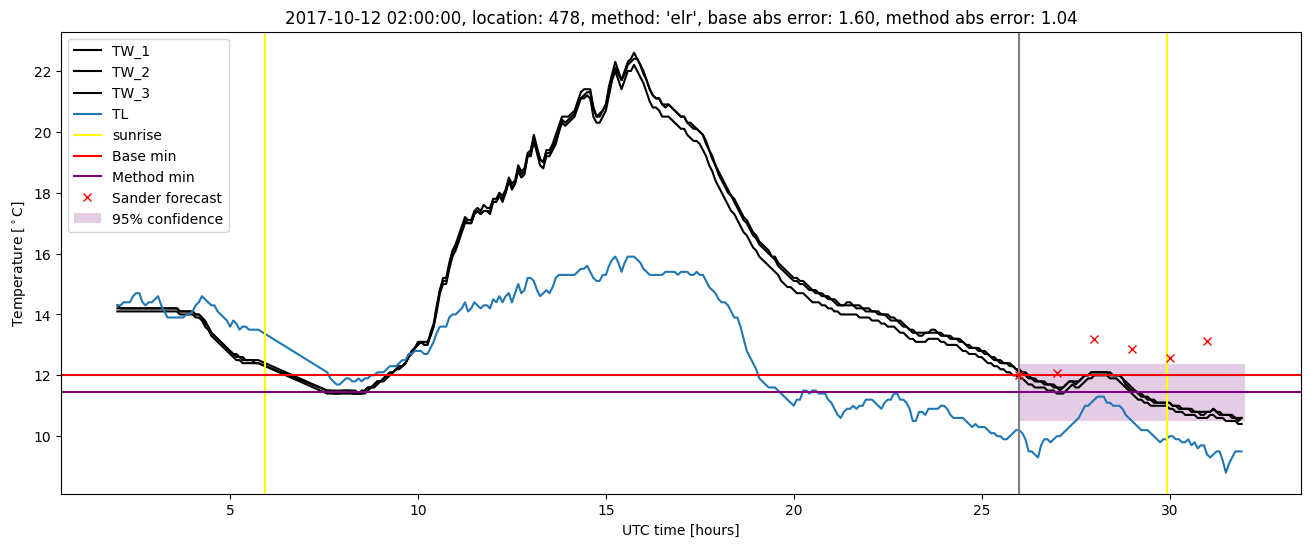
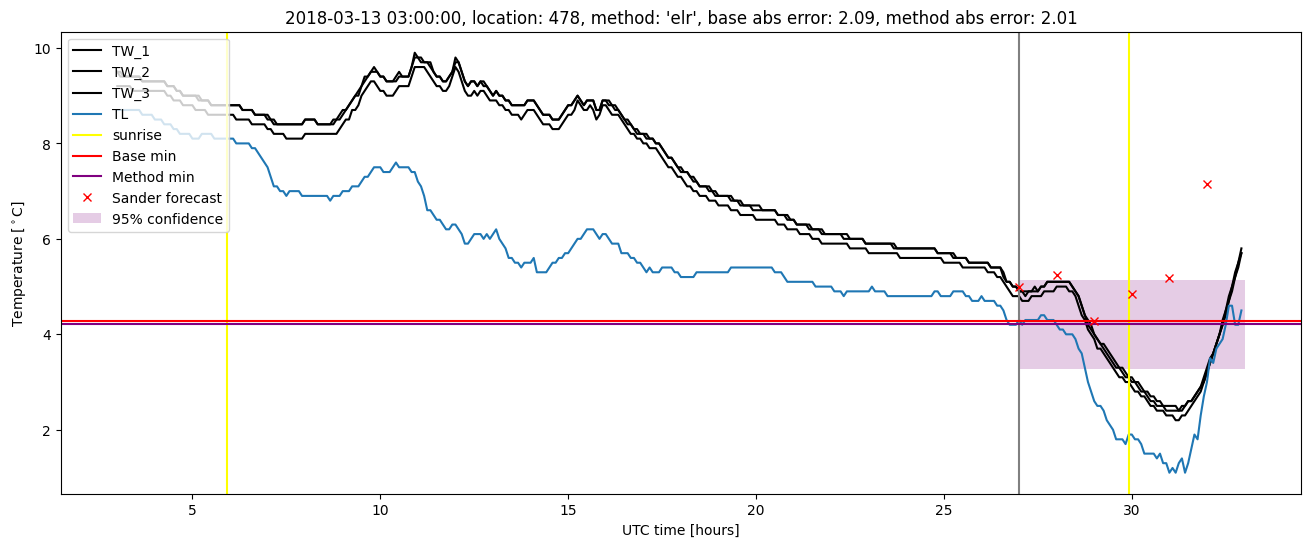
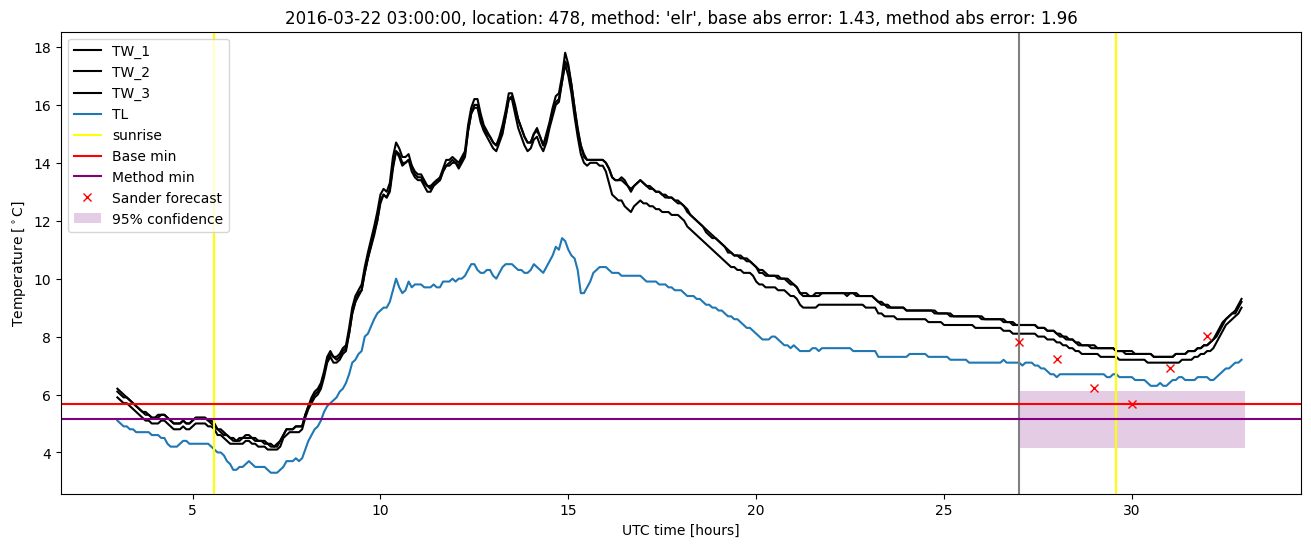
Extended logistic regression plots