GMS location: 477
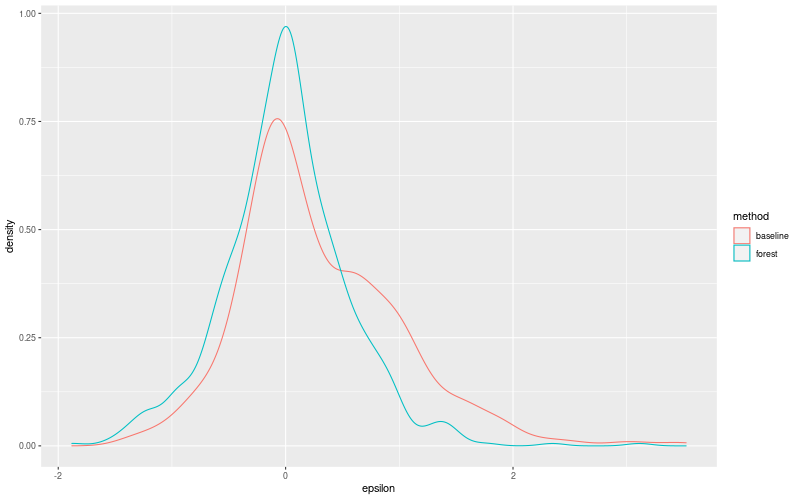
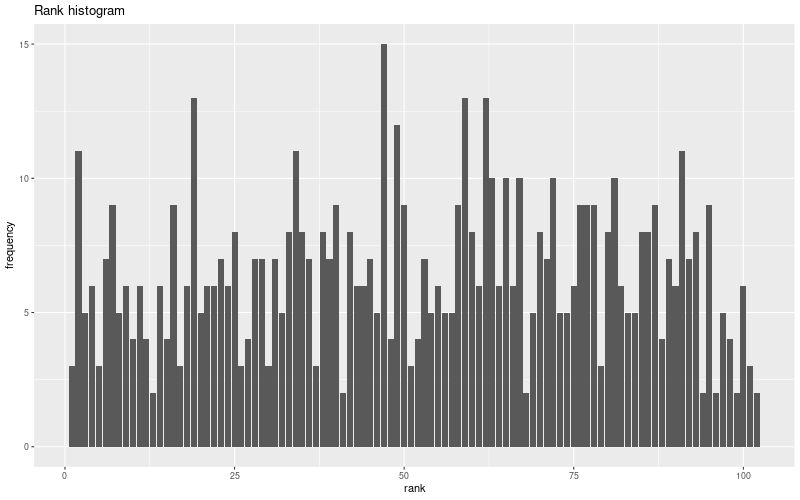
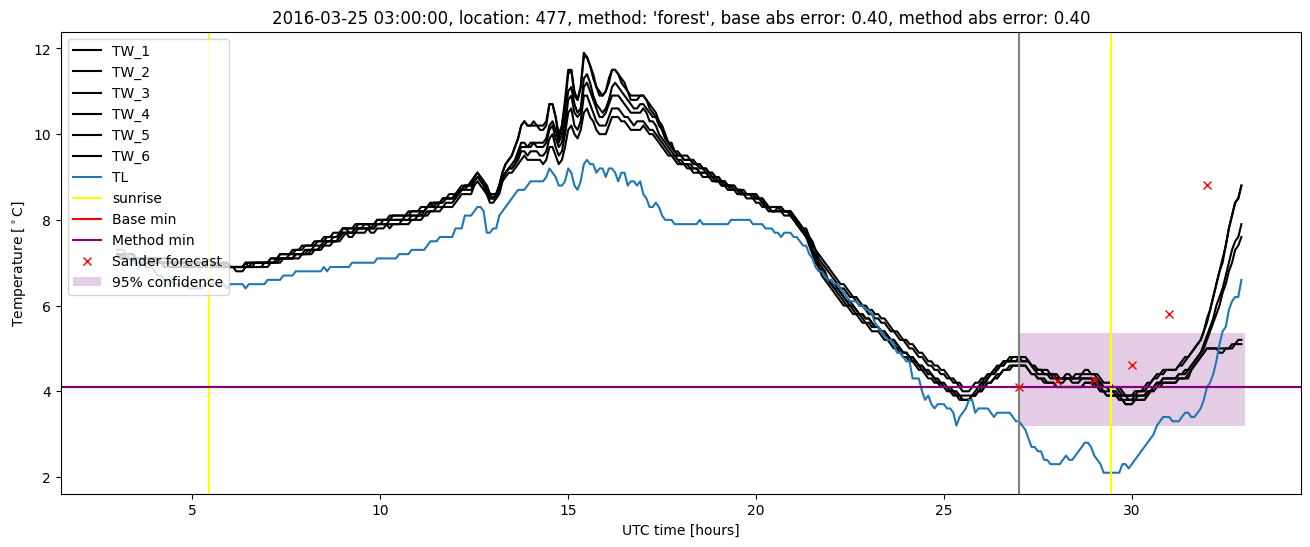
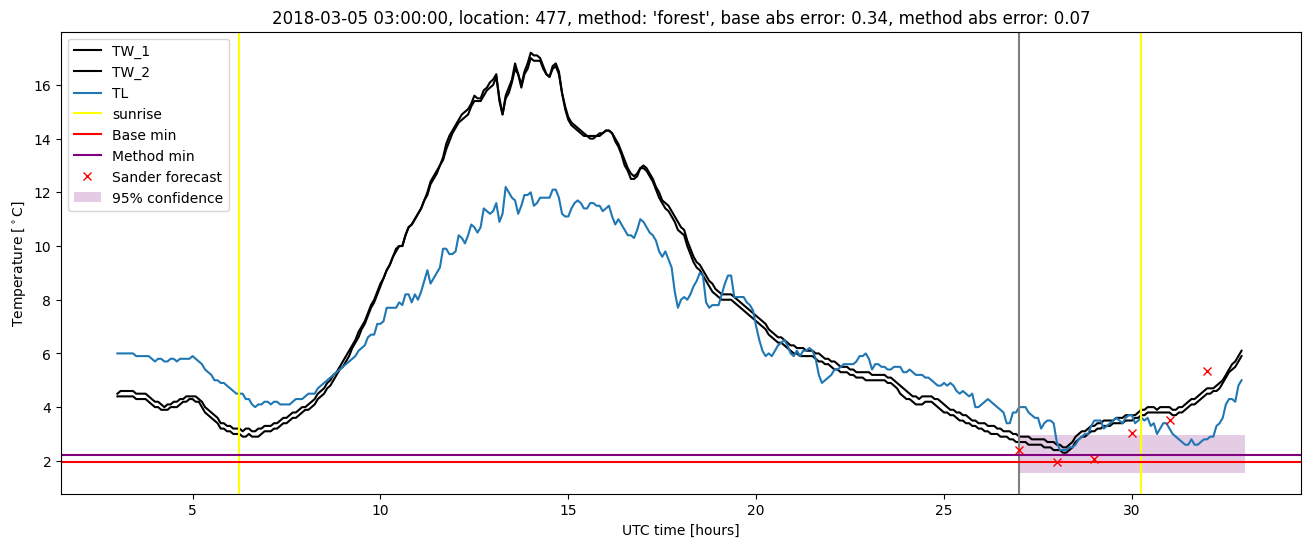
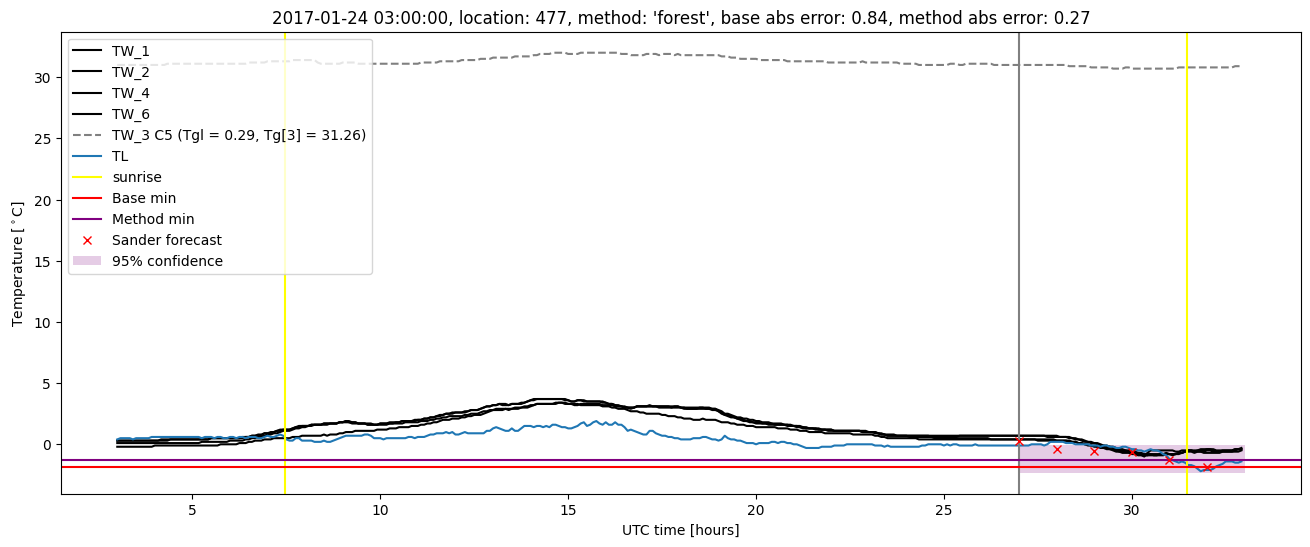
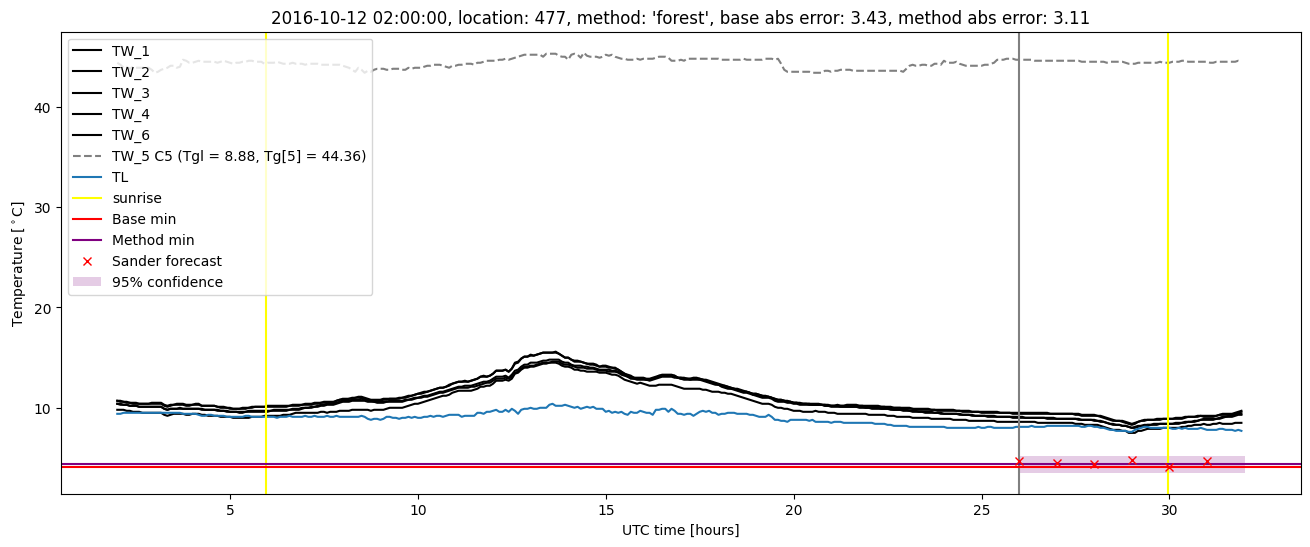
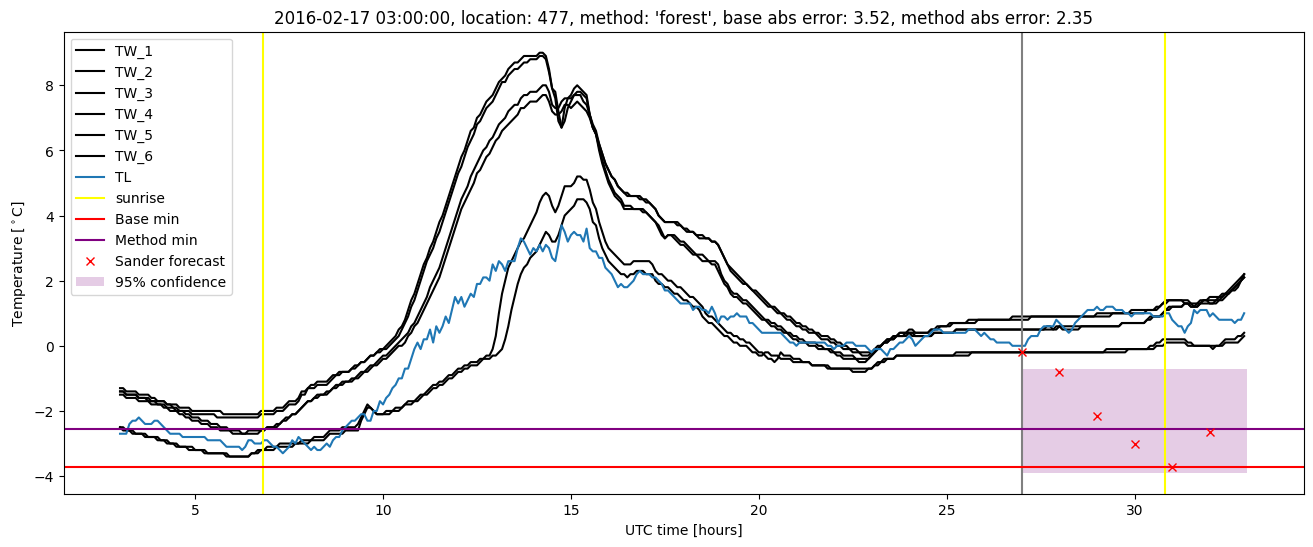
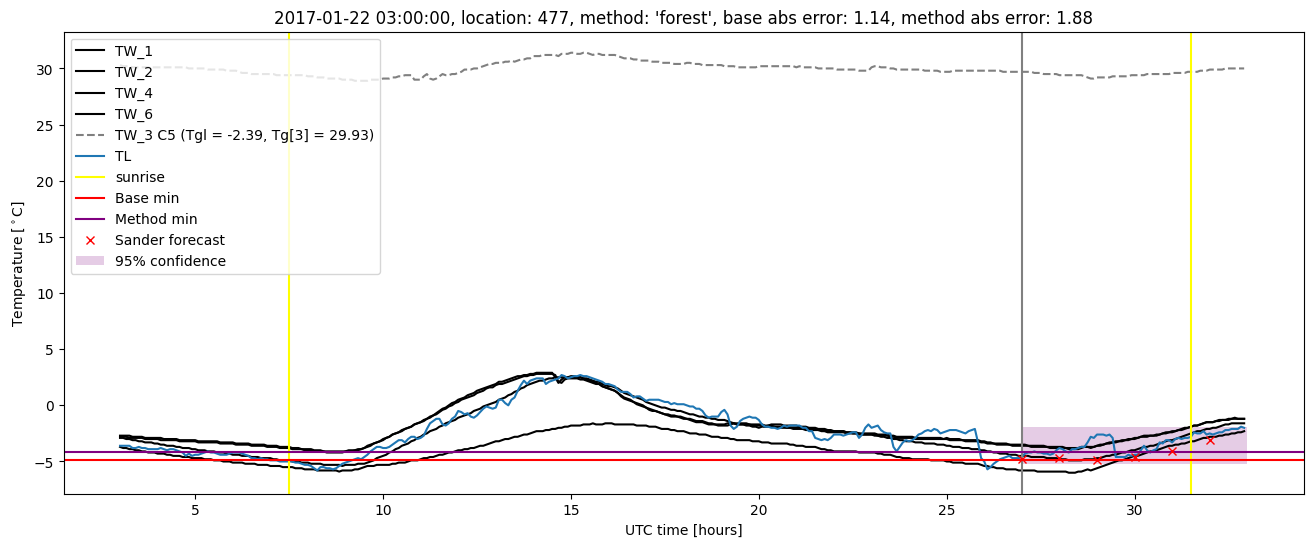
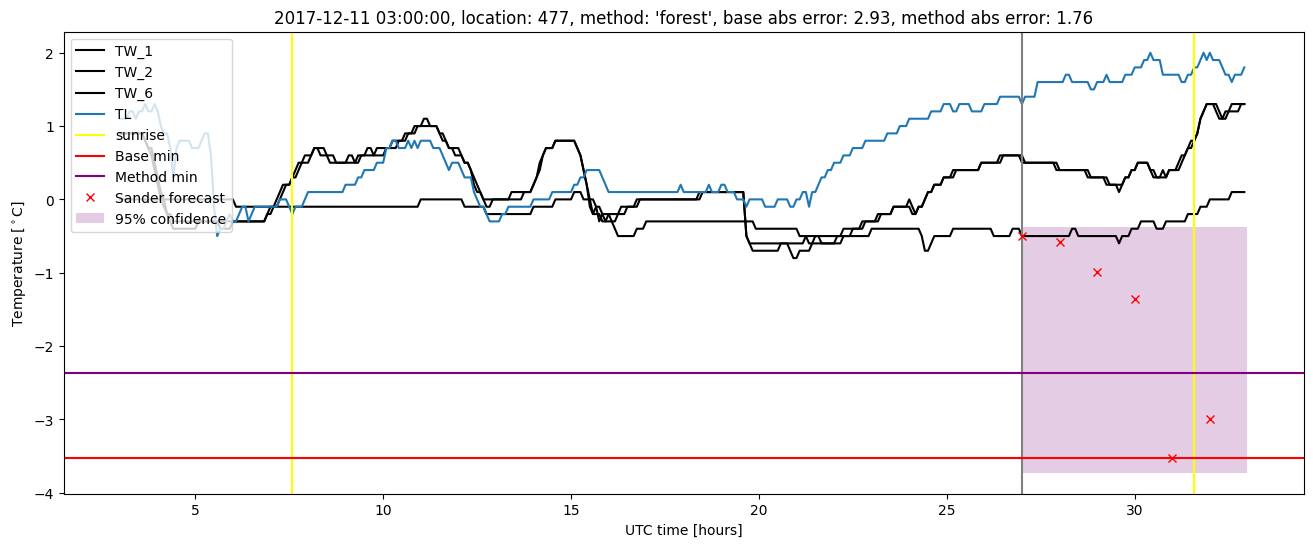
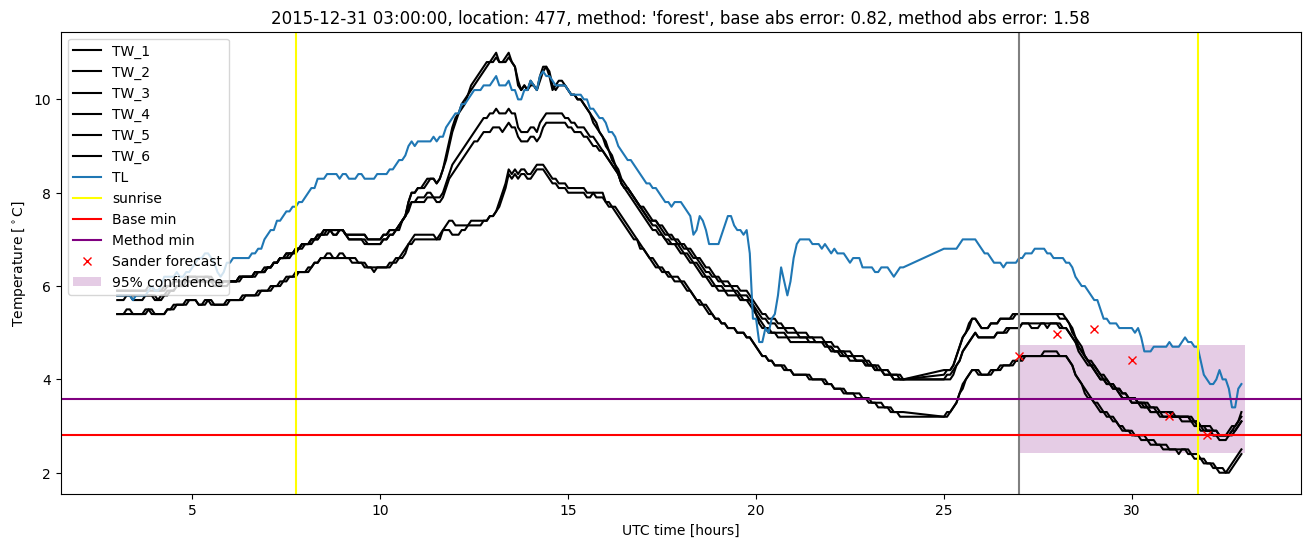
Random forest results
| names |
period |
power |
significance |
meanSquareError |
absError |
maxError |
CRPS |
IGN |
| baseline |
winter 2016 |
0.970 |
0.083 |
0.531 |
0.532 |
3.523 |
NaN |
NaN |
| forest |
winter 2016 |
0.982 |
0.000e+00 |
0.265 |
0.378 |
2.347 |
0.429 |
3.809 |
| baseline |
winter 2017 |
0.973 |
0.071 |
0.743 |
0.619 |
3.426 |
NaN |
NaN |
| forest |
winter 2017 |
0.991 |
0.095 |
0.398 |
0.459 |
3.110 |
0.442 |
4.394 |
| baseline |
winter 2018 |
0.985 |
0.088 |
0.575 |
0.558 |
2.926 |
NaN |
NaN |
| forest |
winter 2018 |
0.985 |
0.176 |
0.317 |
0.428 |
1.764 |
0.438 |
3.743 |
| baseline |
winter 2019 |
0.963 |
0.000e+00 |
0.566 |
0.525 |
3.154 |
NaN |
NaN |
| forest |
winter 2019 |
0.993 |
0.000e+00 |
0.237 |
0.356 |
1.527 |
0.424 |
3.226 |
| baseline |
all |
0.973 |
0.069 |
0.599 |
0.557 |
3.523 |
NaN |
NaN |
| forest |
all |
0.987 |
0.086 |
0.302 |
0.404 |
3.110 |
0.433 |
3.792 |
Random forest plots
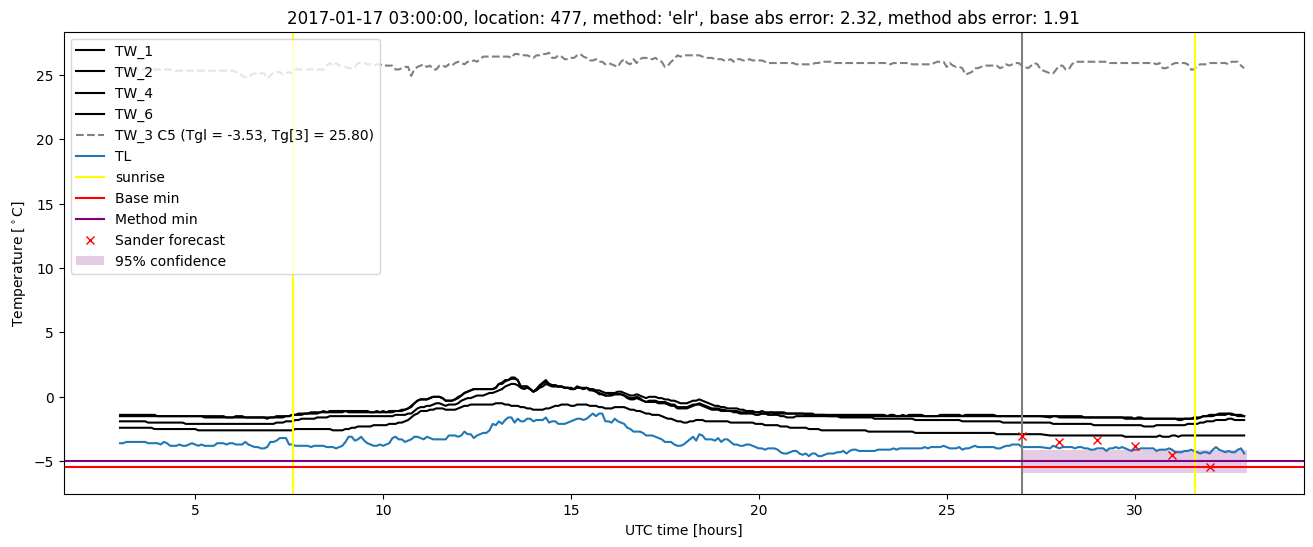
Extended logistic regression results
| names |
period |
power |
significance |
meanSquareError |
absError |
maxError |
CRPS |
IGN |
| baseline |
winter 2016 |
0.970 |
0.083 |
0.531 |
0.532 |
3.523 |
NaN |
NaN |
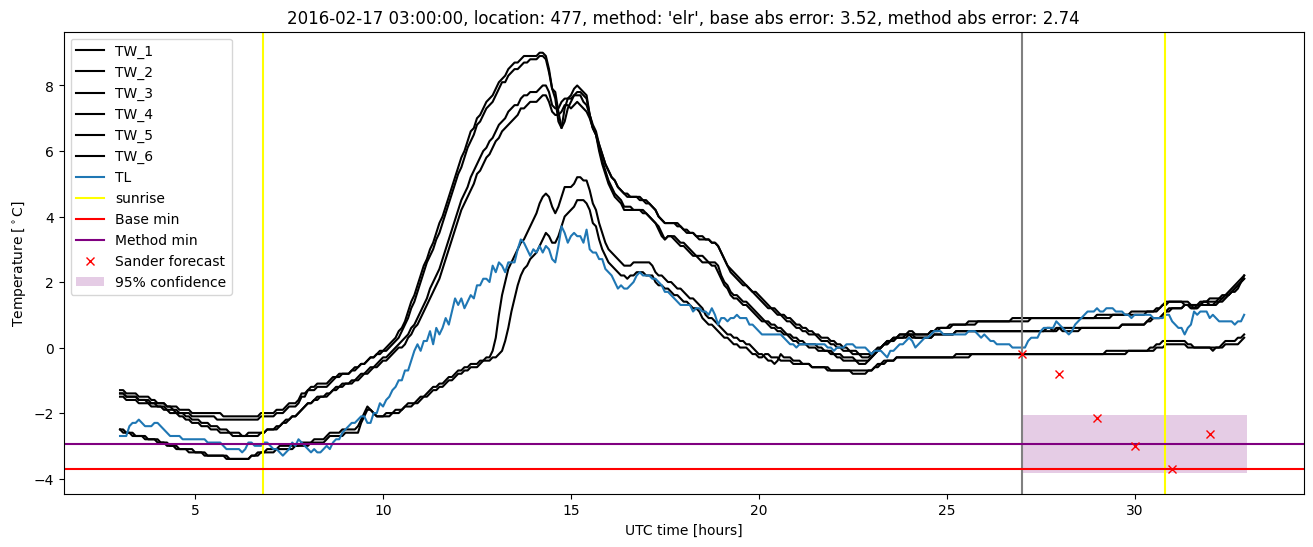
| elr |
winter 2016 |
0.970 |
0.000e+00 |
0.353 |
0.459 |
2.742 |
0.531 |
4.016 |
| baseline |
winter 2017 |
0.973 |
0.071 |
0.743 |
0.619 |
3.426 |
NaN |
NaN |
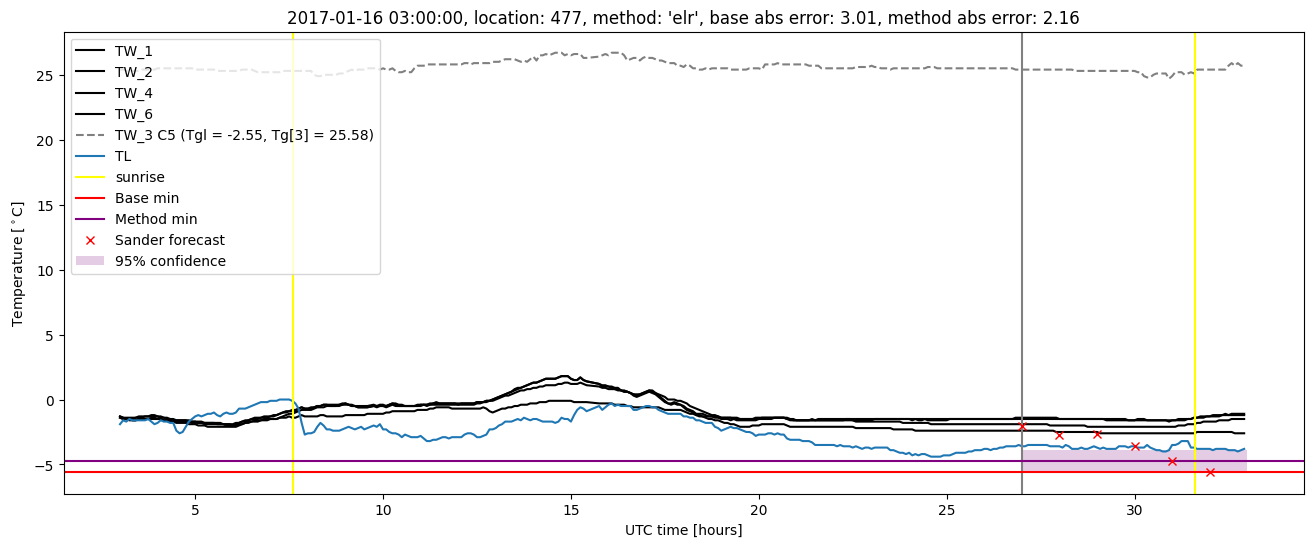
| elr |
winter 2017 |
0.991 |
0.048 |
0.421 |
0.472 |
3.071 |
0.496 |
3.535 |
| baseline |
winter 2018 |
0.985 |
0.088 |
0.575 |
0.558 |
2.926 |
NaN |
NaN |
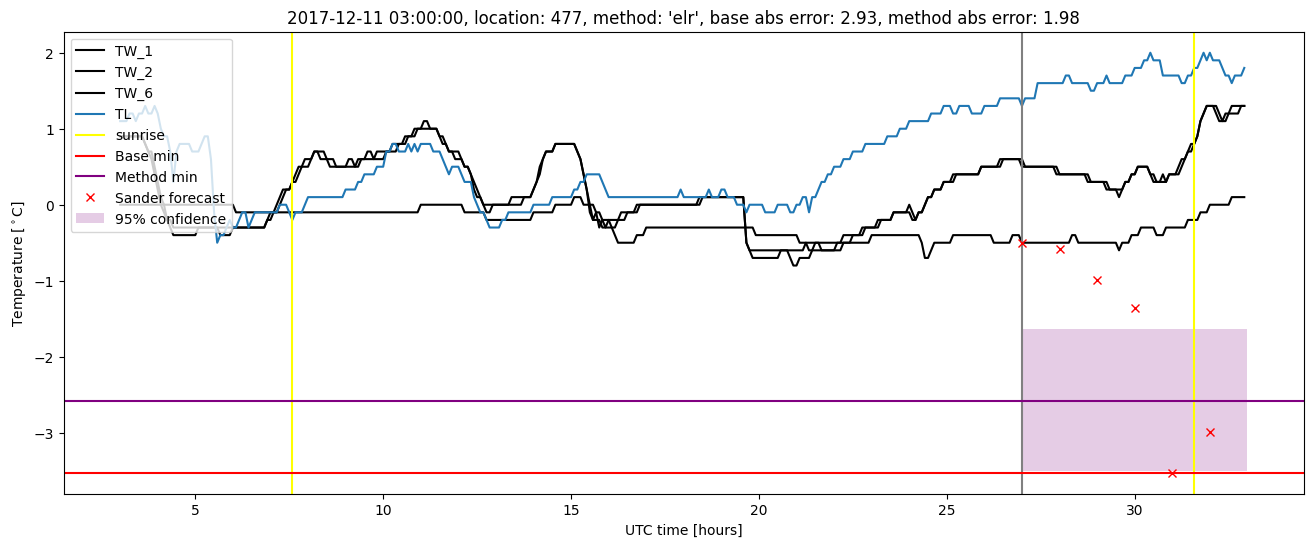
| elr |
winter 2018 |
0.985 |
0.118 |
0.345 |
0.440 |
1.979 |
0.531 |
3.393 |
| baseline |
winter 2019 |
0.963 |
0.000e+00 |
0.566 |
0.525 |
3.154 |
NaN |
NaN |
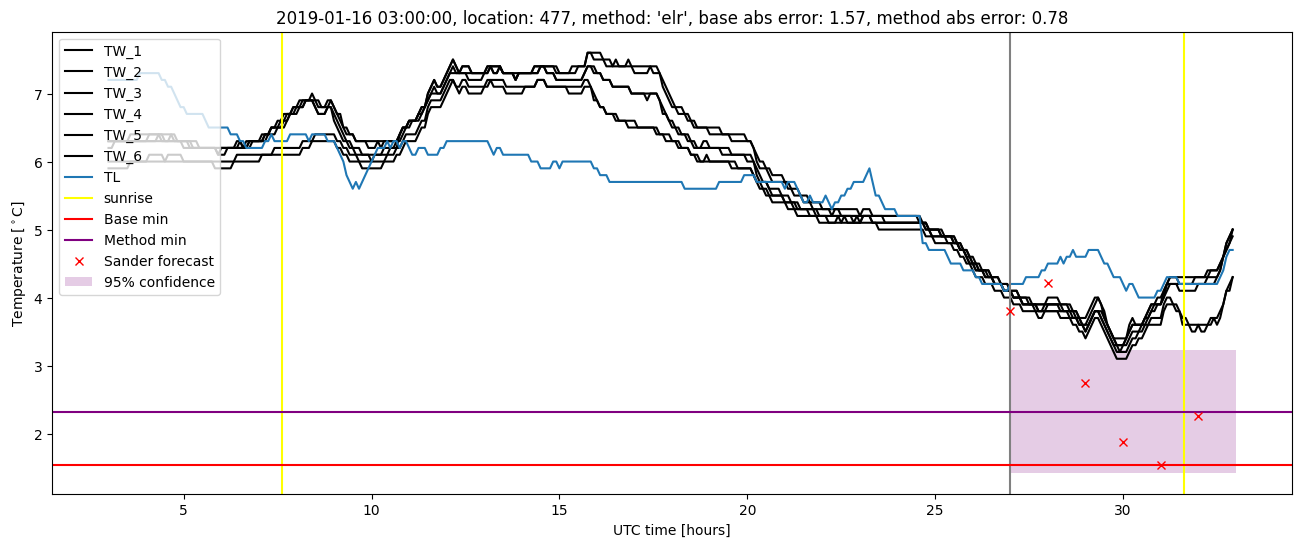
| elr |
winter 2019 |
0.993 |
0.062 |
0.307 |
0.420 |
1.771 |
0.523 |
3.607 |
| baseline |
all |
0.973 |
0.069 |
0.599 |
0.557 |
3.523 |
NaN |
NaN |
| elr |
all |
0.984 |
0.060 |
0.356 |
0.448 |
3.071 |
0.521 |
3.655 |
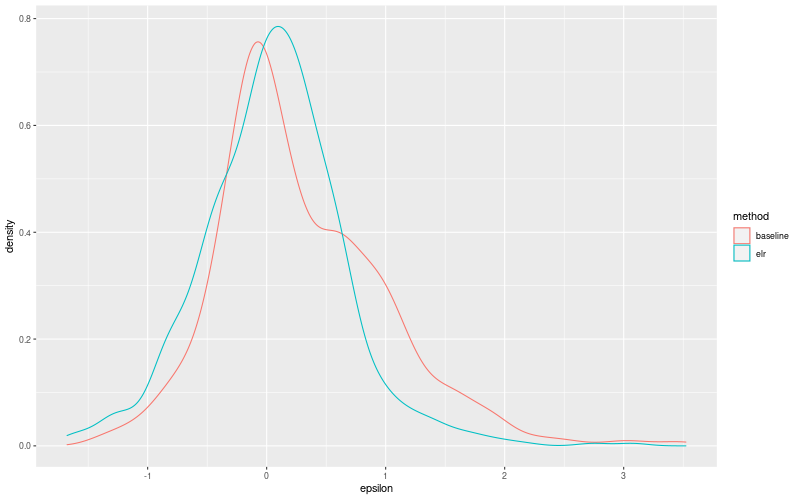
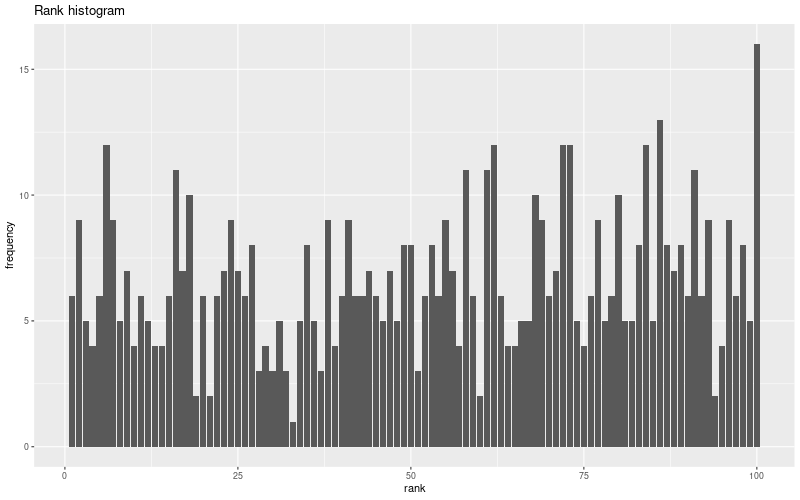
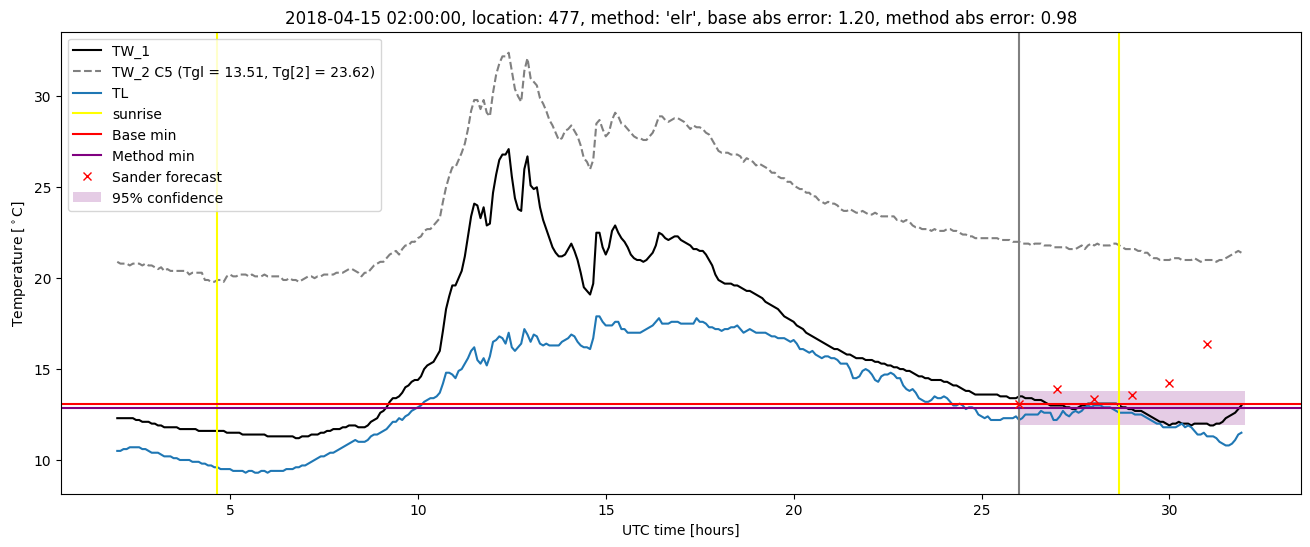
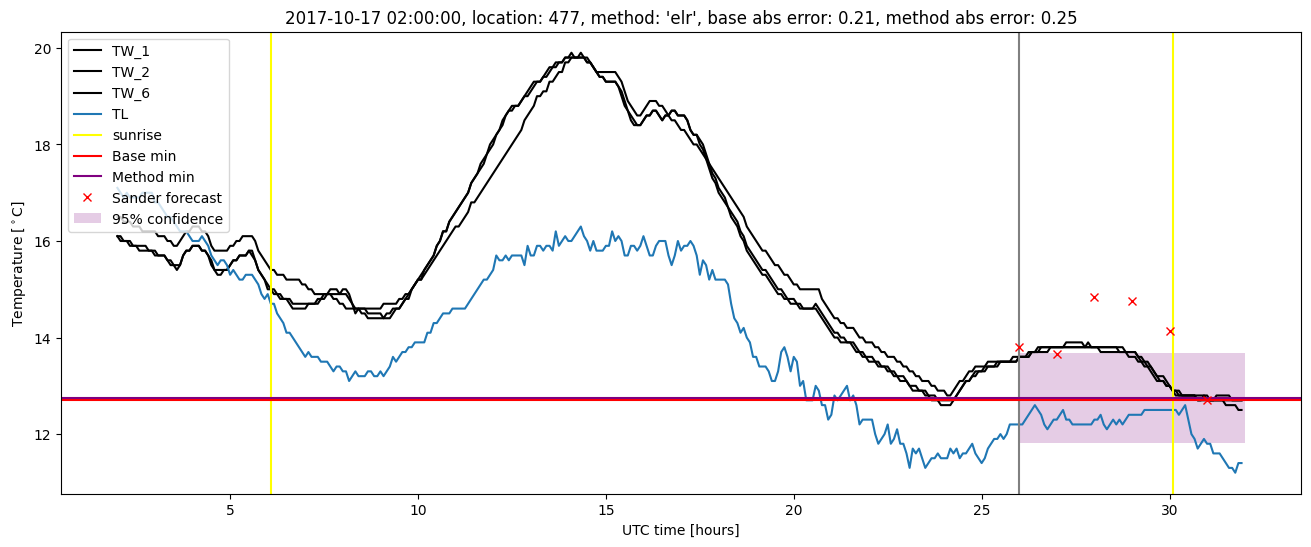
Extended logistic regression plots