GMS location: 476
Random forest results
| names |
period |
power |
significance |
meanSquareError |
absError |
maxError |
CRPS |
IGN |
| baseline |
winter 2016 |
0.983 |
0.059 |
0.483 |
0.495 |
2.802 |
NaN |
NaN |
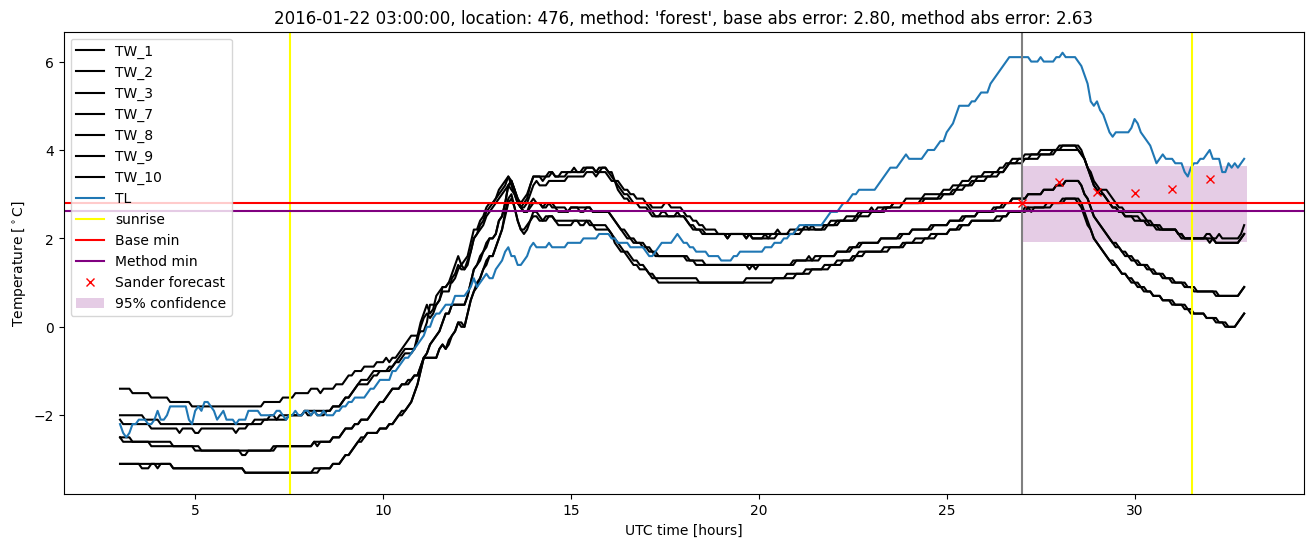
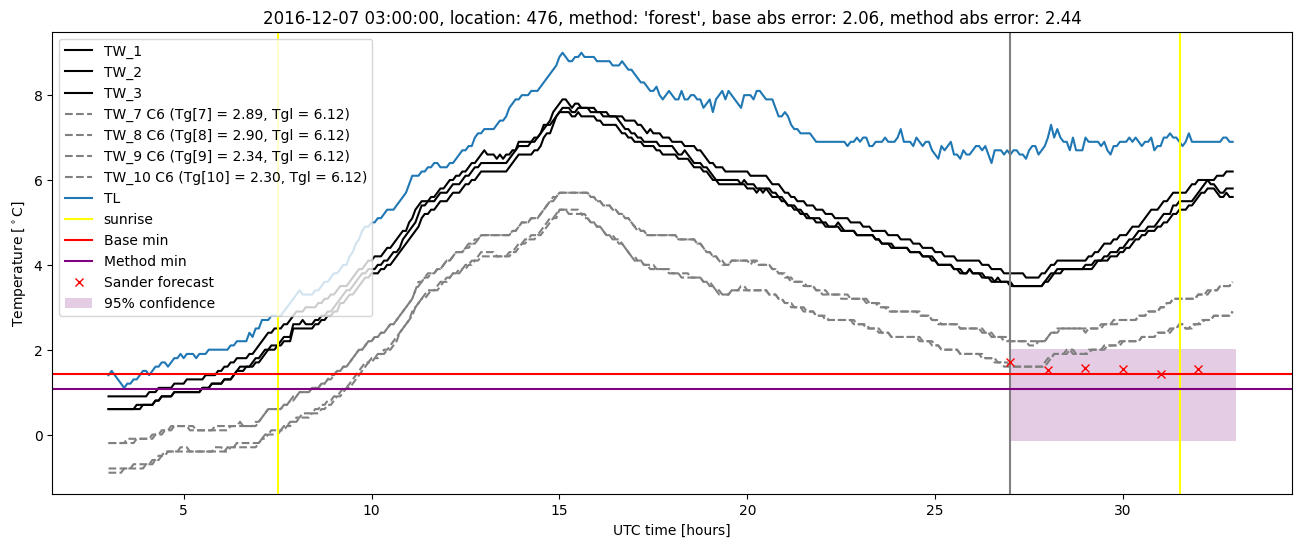
| forest |
winter 2016 |
0.977 |
0.118 |
0.372 |
0.428 |
2.631 |
0.476 |
3.271 |
| baseline |
winter 2017 |
0.965 |
0.103 |
0.395 |
0.461 |
2.313 |
NaN |
NaN |
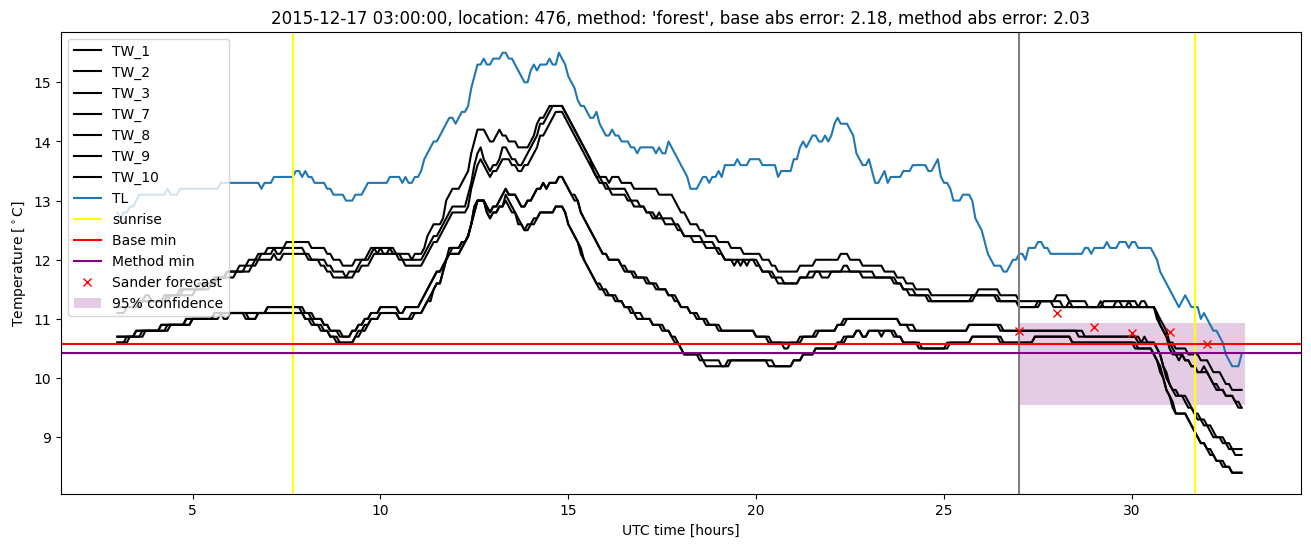
| forest |
winter 2017 |
0.956 |
0.103 |
0.315 |
0.413 |
2.438 |
0.473 |
2.384 |
| baseline |
winter 2018 |
0.986 |
0.111 |
0.353 |
0.429 |
2.141 |
NaN |
NaN |
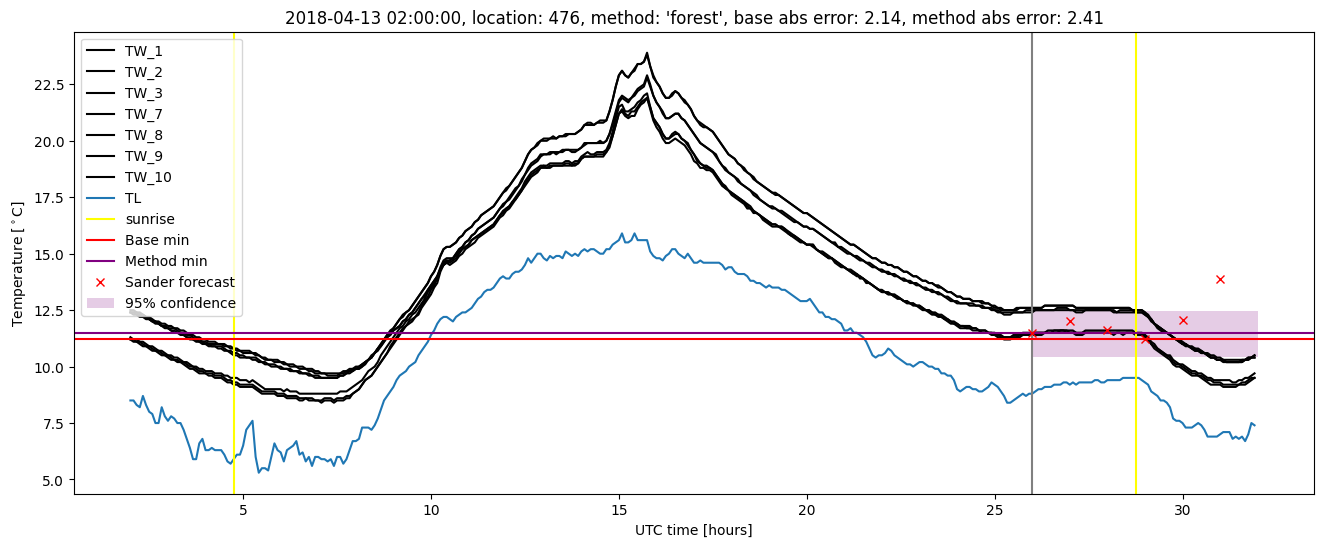
| forest |
winter 2018 |
0.993 |
0.083 |
0.320 |
0.405 |
2.408 |
0.460 |
2.014 |
| baseline |
winter 2019 |
0.985 |
0.000e+00 |
0.321 |
0.408 |
2.016 |
NaN |
NaN |
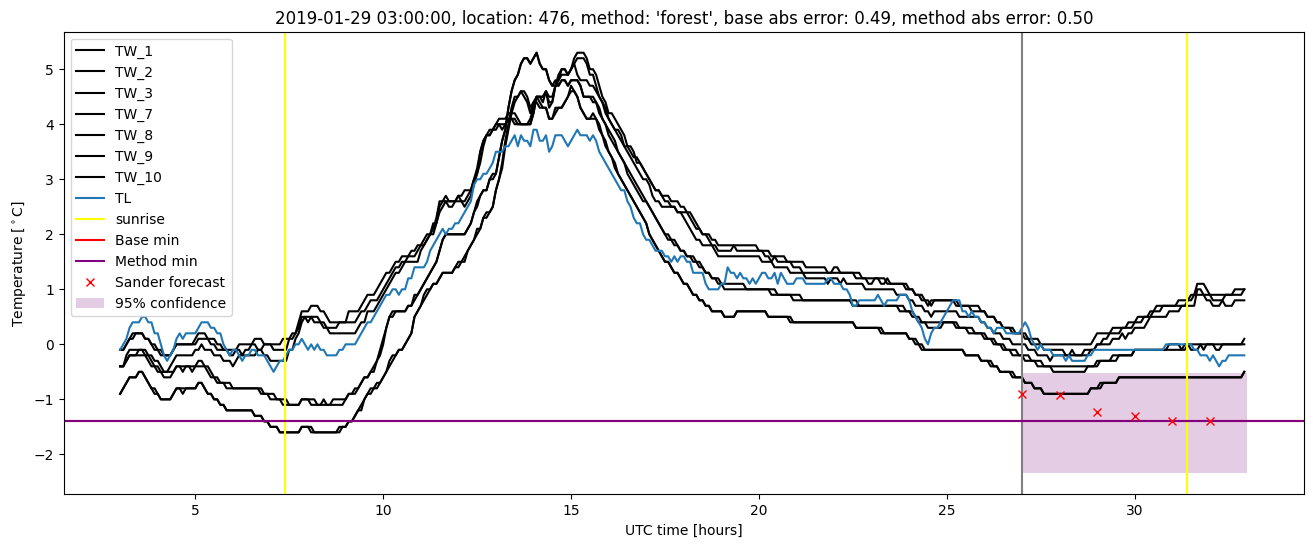
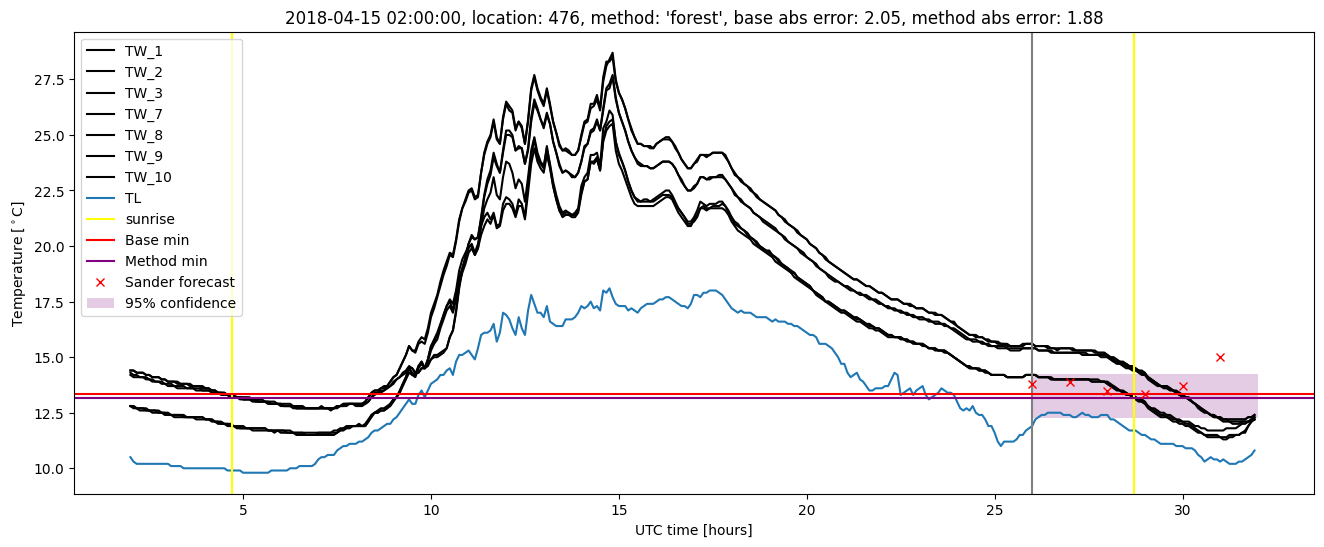
| forest |
winter 2019 |
0.977 |
0.000e+00 |
0.255 |
0.391 |
1.380 |
0.457 |
1.950 |
| baseline |
all |
0.980 |
0.085 |
0.393 |
0.451 |
2.802 |
NaN |
NaN |
| forest |
all |
0.977 |
0.085 |
0.320 |
0.410 |
2.631 |
0.467 |
2.446 |
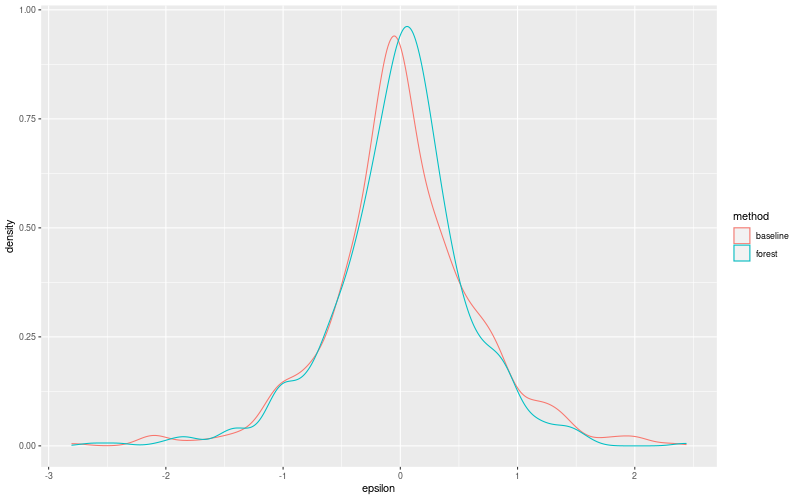
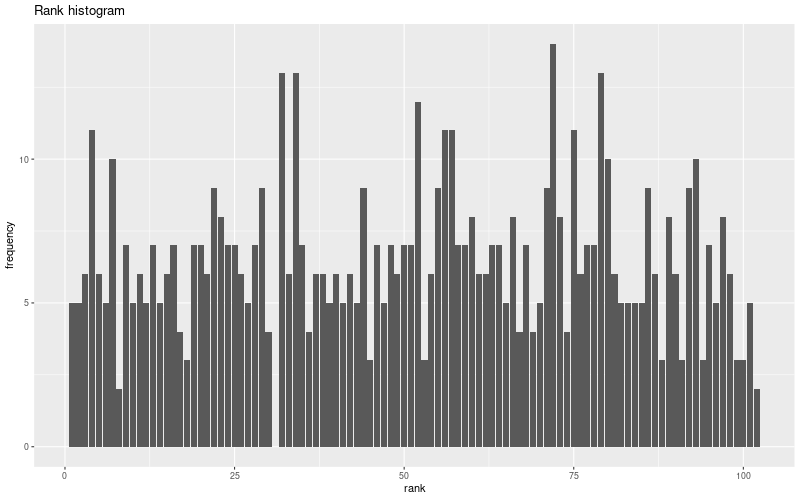
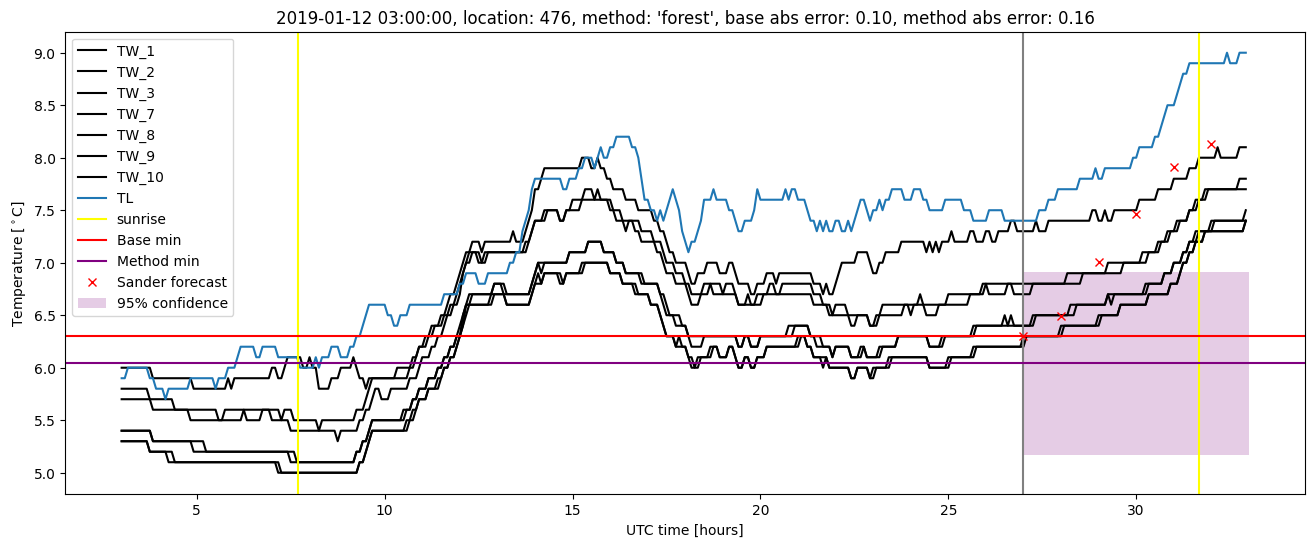
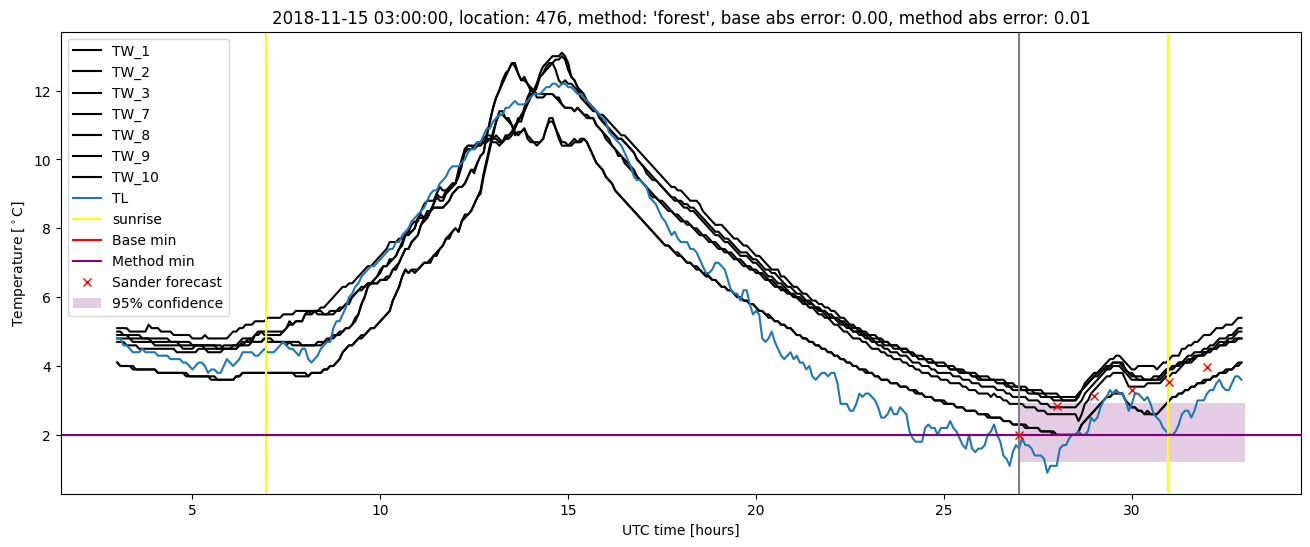
Random forest plots
Extended logistic regression results
| names |
period |
power |
significance |
meanSquareError |
absError |
maxError |
CRPS |
IGN |
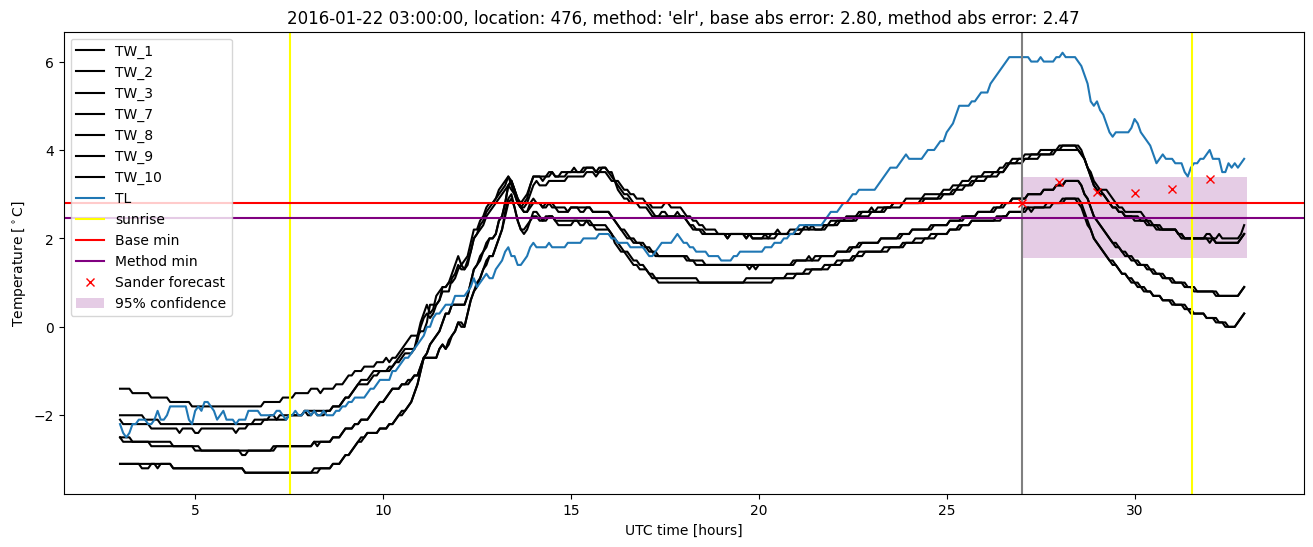
| baseline |
winter 2016 |
0.983 |
0.059 |
0.483 |
0.495 |
2.802 |
NaN |
NaN |
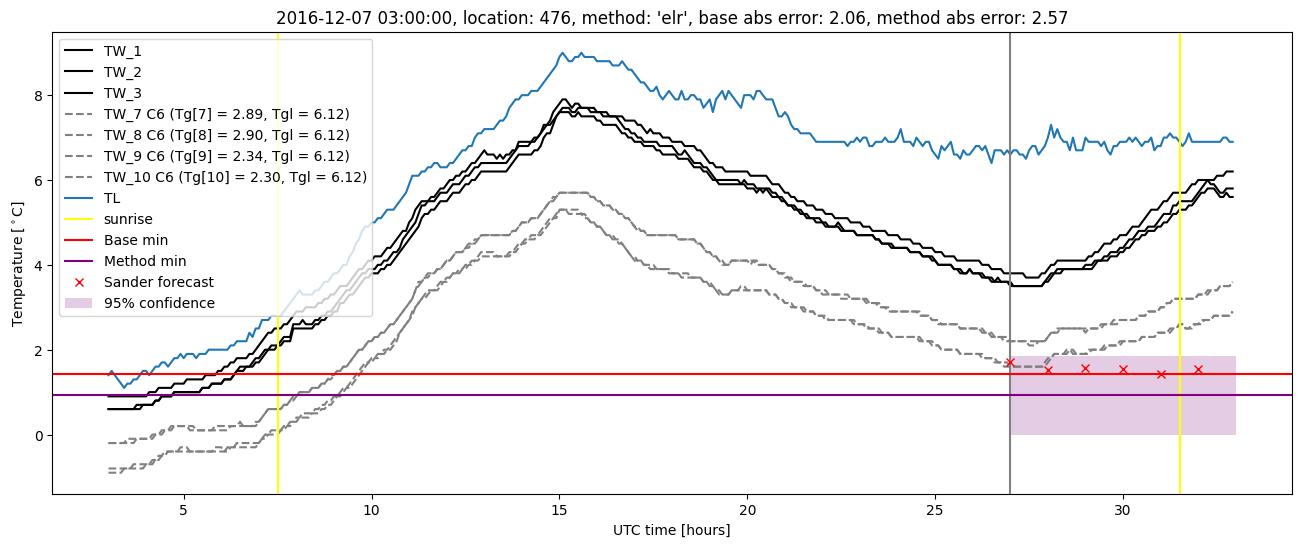
| elr |
winter 2016 |
0.983 |
0.059 |
0.408 |
0.477 |
2.469 |
0.517 |
3.424 |
| baseline |
winter 2017 |
0.965 |
0.103 |
0.395 |
0.461 |
2.313 |
NaN |
NaN |
| elr |
winter 2017 |
0.965 |
0.103 |
0.337 |
0.441 |
2.568 |
0.538 |
3.476 |
| baseline |
winter 2018 |
0.986 |
0.111 |
0.353 |
0.429 |
2.141 |
NaN |
NaN |
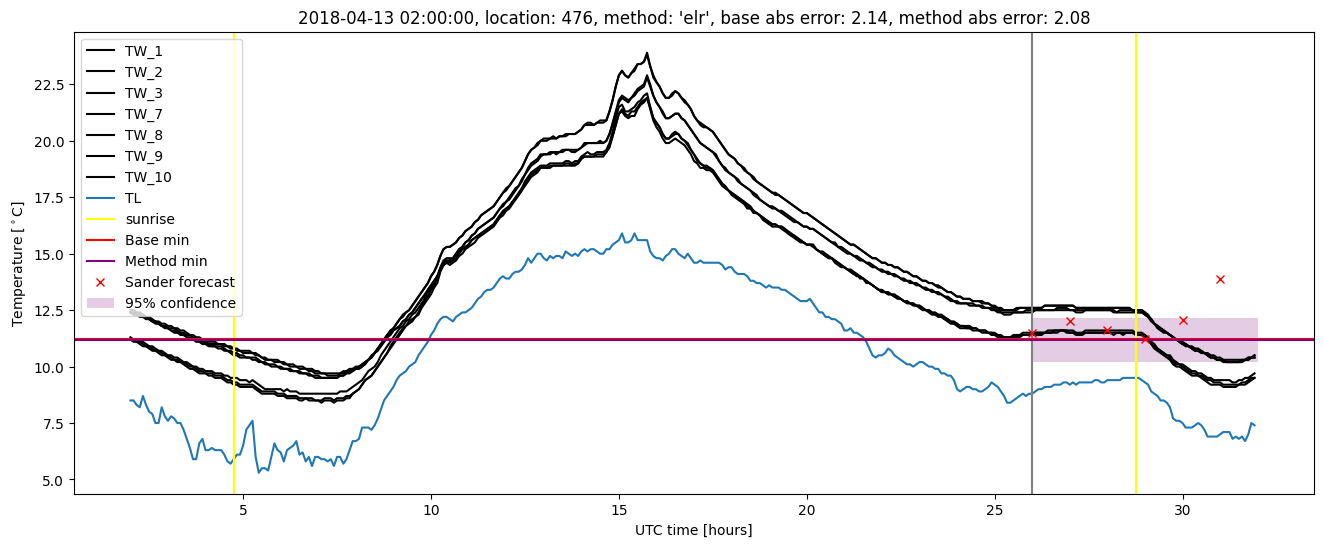
| elr |
winter 2018 |
0.993 |
0.139 |
0.337 |
0.437 |
2.083 |
0.518 |
2.974 |
| baseline |
winter 2019 |
0.985 |
0.000e+00 |
0.321 |
0.408 |
2.016 |
NaN |
NaN |
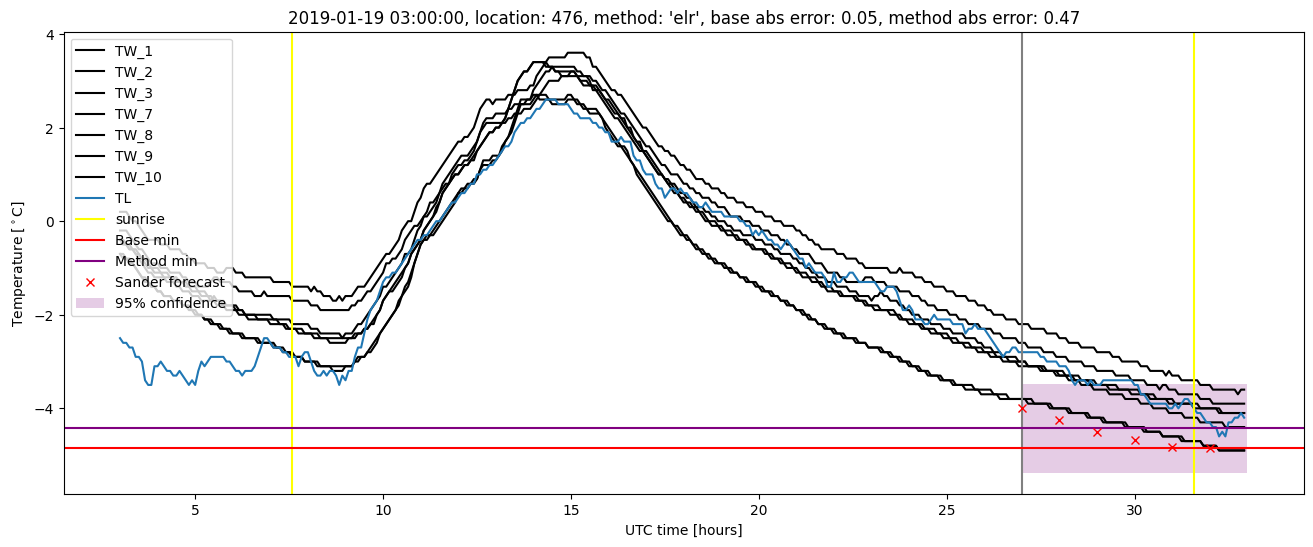
| elr |
winter 2019 |
0.977 |
0.000e+00 |
0.269 |
0.407 |
1.334 |
0.512 |
2.971 |
| baseline |
all |
0.980 |
0.085 |
0.393 |
0.451 |
2.802 |
NaN |
NaN |
| elr |
all |
0.980 |
0.094 |
0.342 |
0.443 |
2.568 |
0.521 |
3.218 |
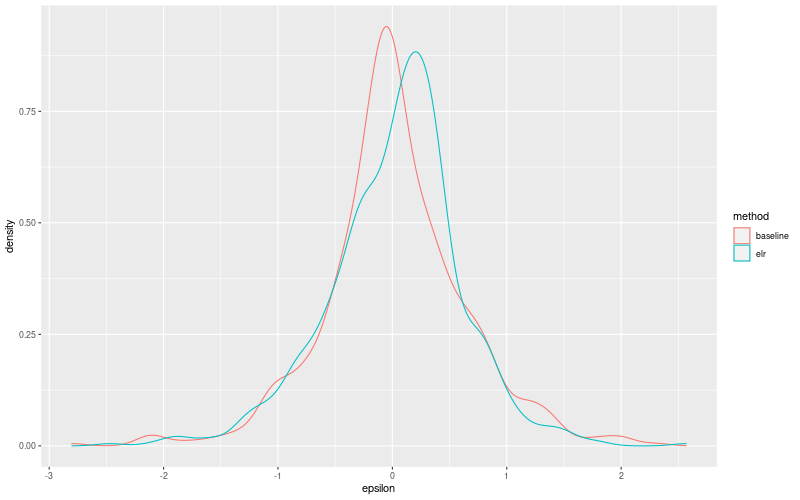
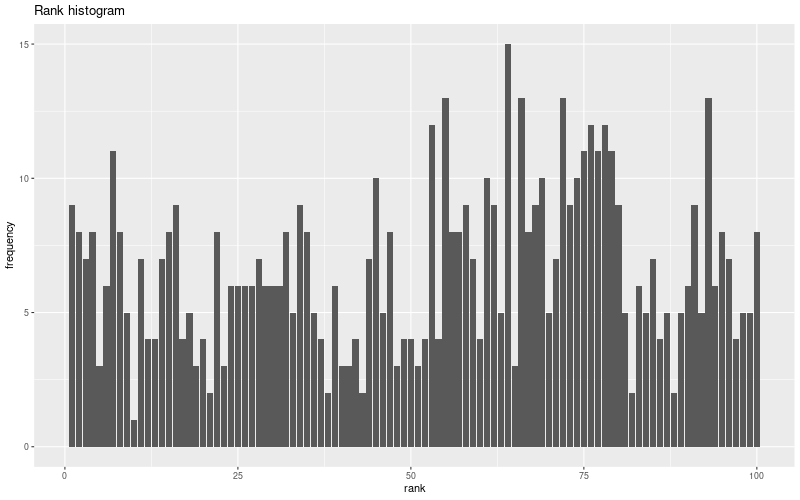
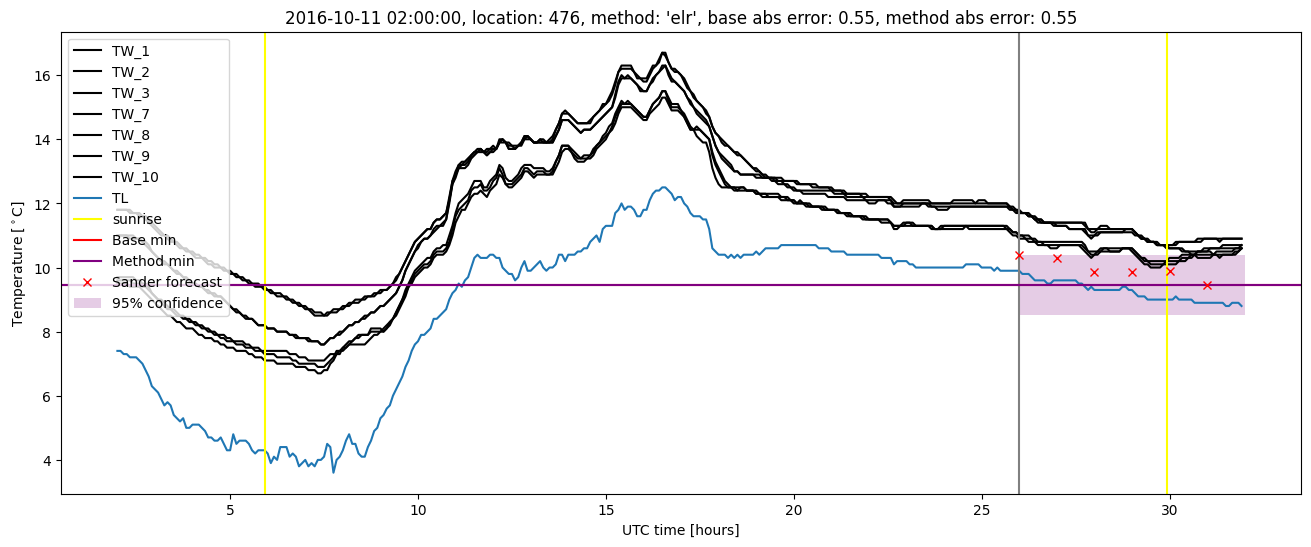
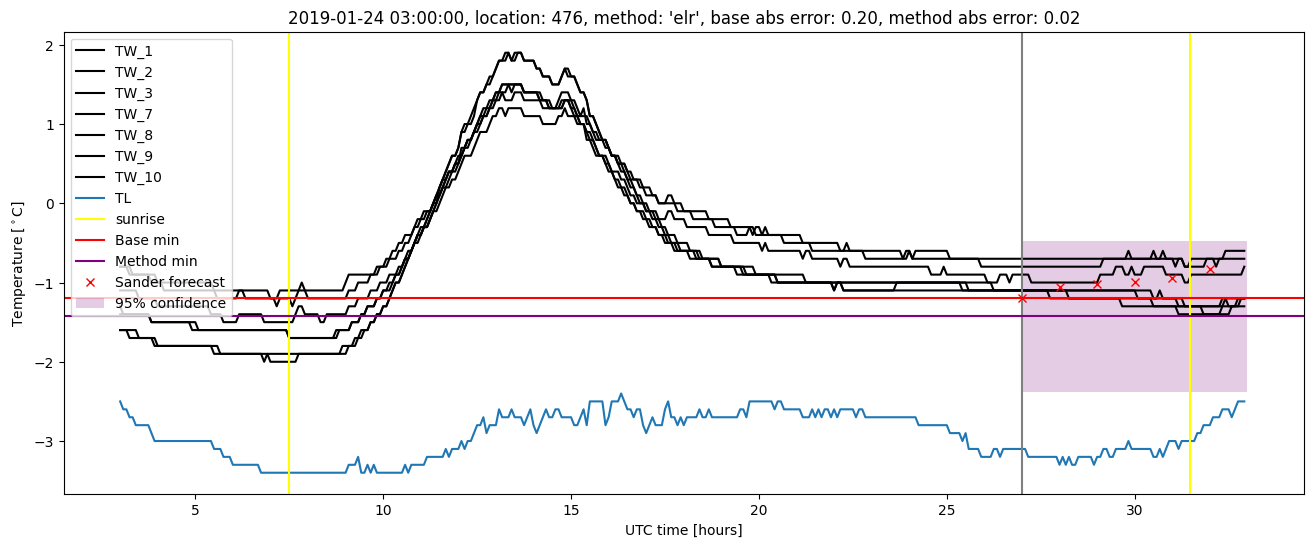
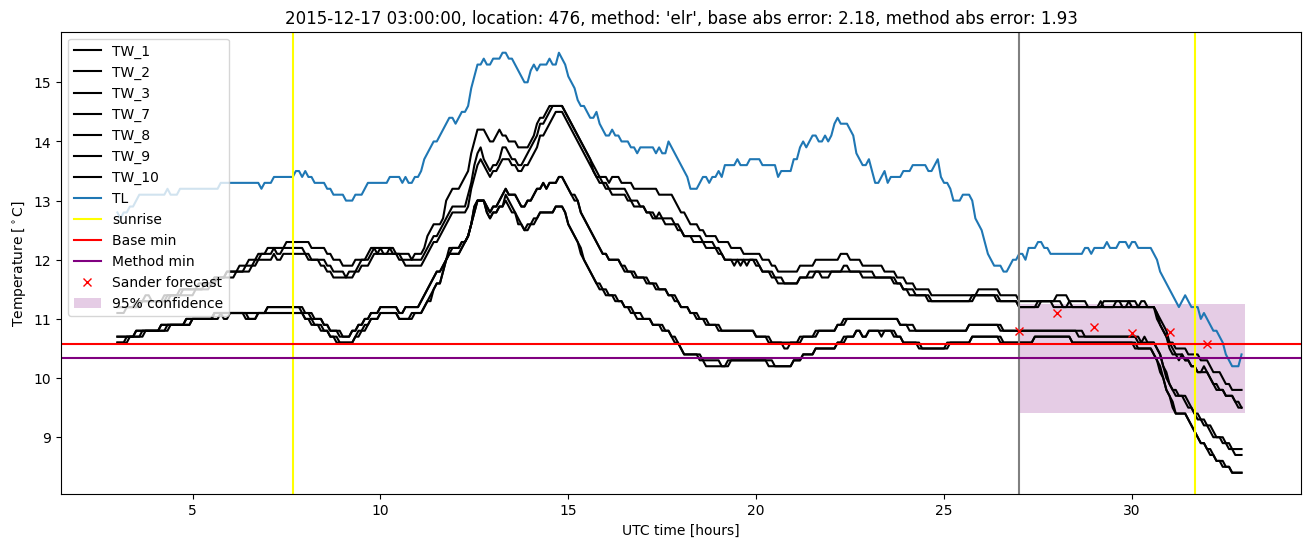
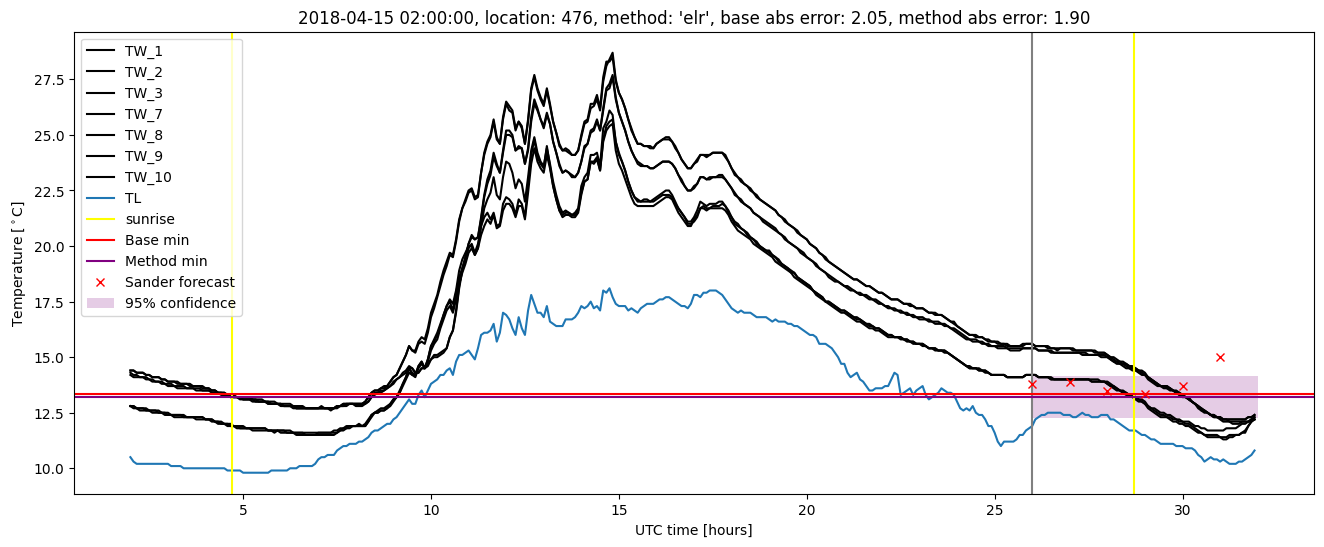
Extended logistic regression plots