GMS location: 475
Random forest results
| names |
period |
power |
significance |
meanSquareError |
absError |
maxError |
CRPS |
IGN |
| baseline |
winter 2016 |
0.975 |
0.167 |
0.814 |
0.680 |
3.332 |
NaN |
NaN |
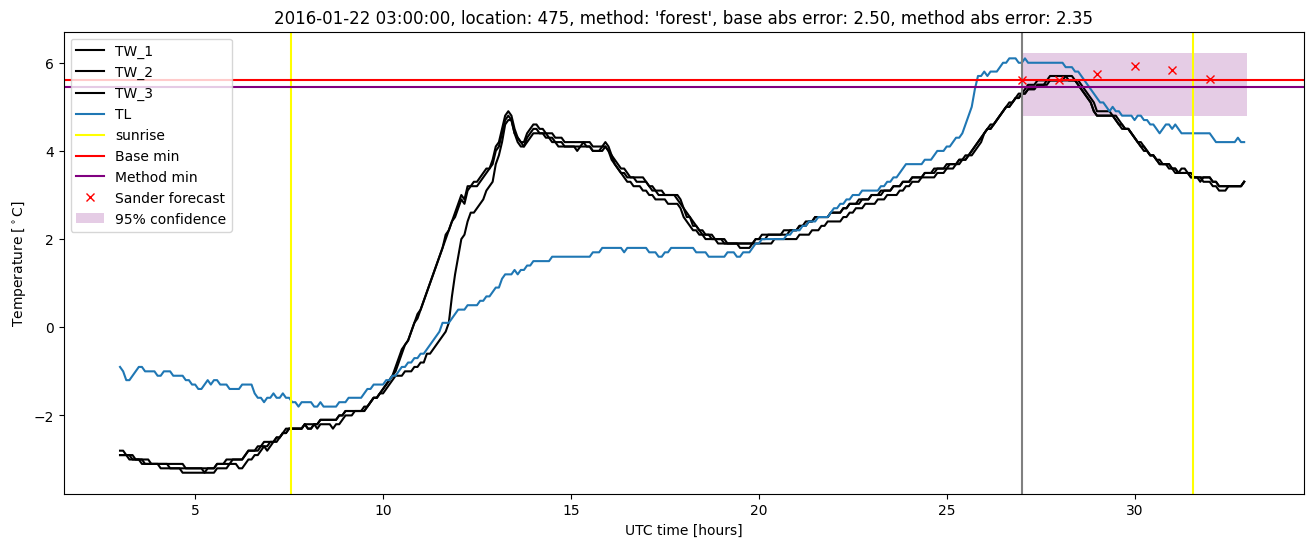
| forest |
winter 2016 |
0.981 |
0.133 |
0.475 |
0.512 |
2.630 |
0.421 |
2.875 |
| baseline |
winter 2017 |
0.936 |
0.000e+00 |
0.872 |
0.680 |
3.267 |
NaN |
NaN |
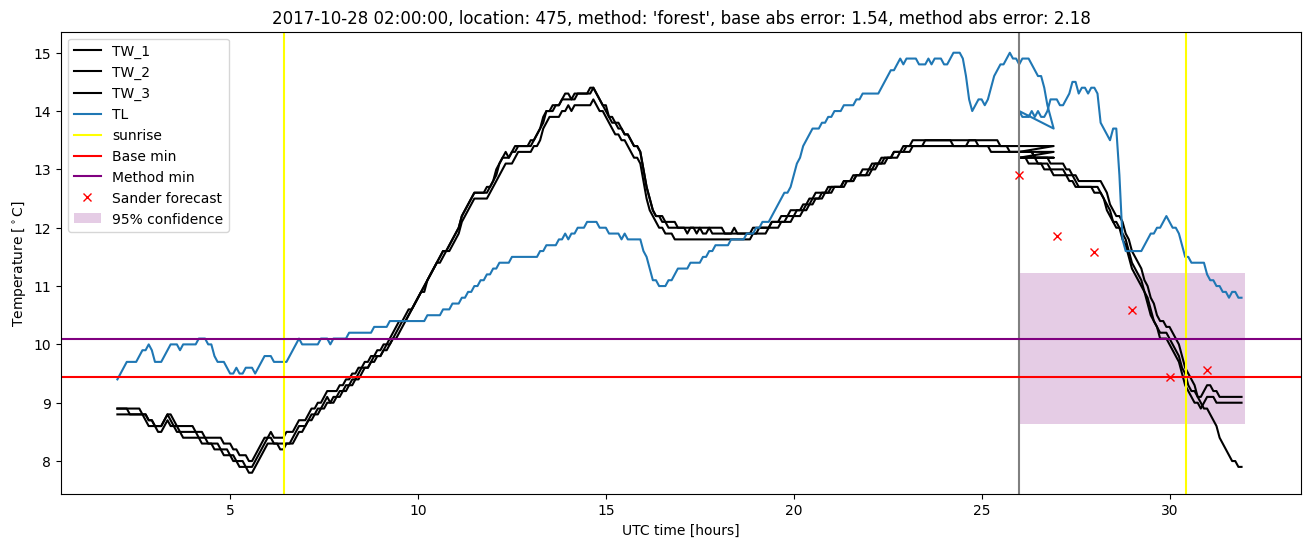
| forest |
winter 2017 |
0.963 |
0.000e+00 |
0.395 |
0.474 |
2.140 |
0.421 |
1.721 |
| baseline |
winter 2018 |
0.977 |
0.103 |
0.554 |
0.562 |
2.063 |
NaN |
NaN |
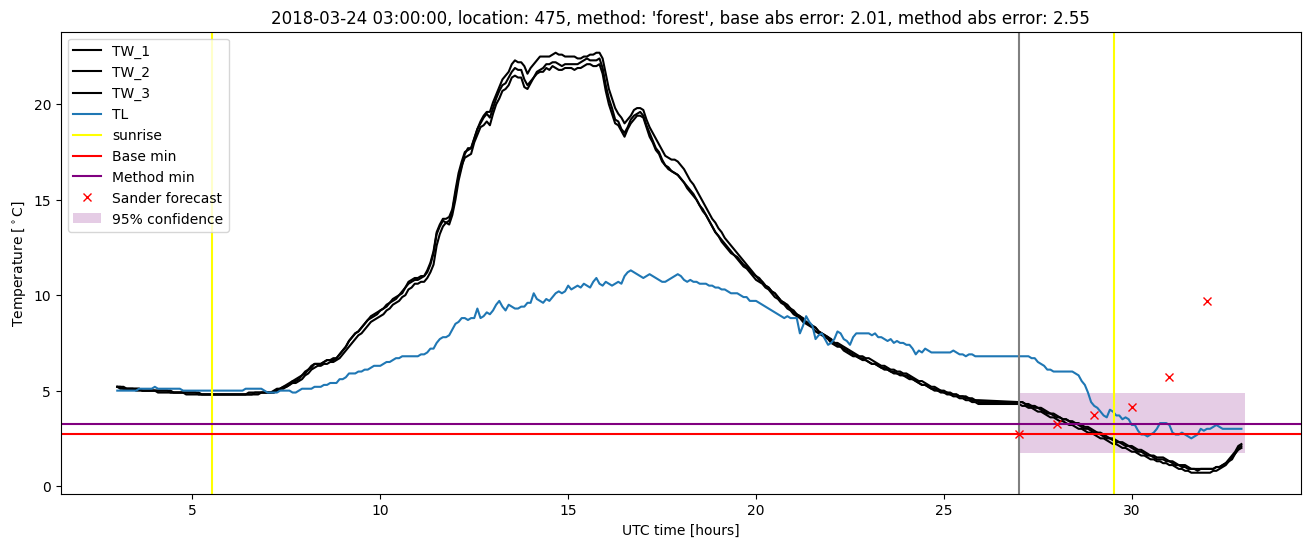
| forest |
winter 2018 |
0.992 |
0.128 |
0.425 |
0.483 |
2.553 |
0.422 |
1.812 |
| baseline |
winter 2019 |
0.969 |
0.056 |
0.722 |
0.596 |
3.205 |
NaN |
NaN |
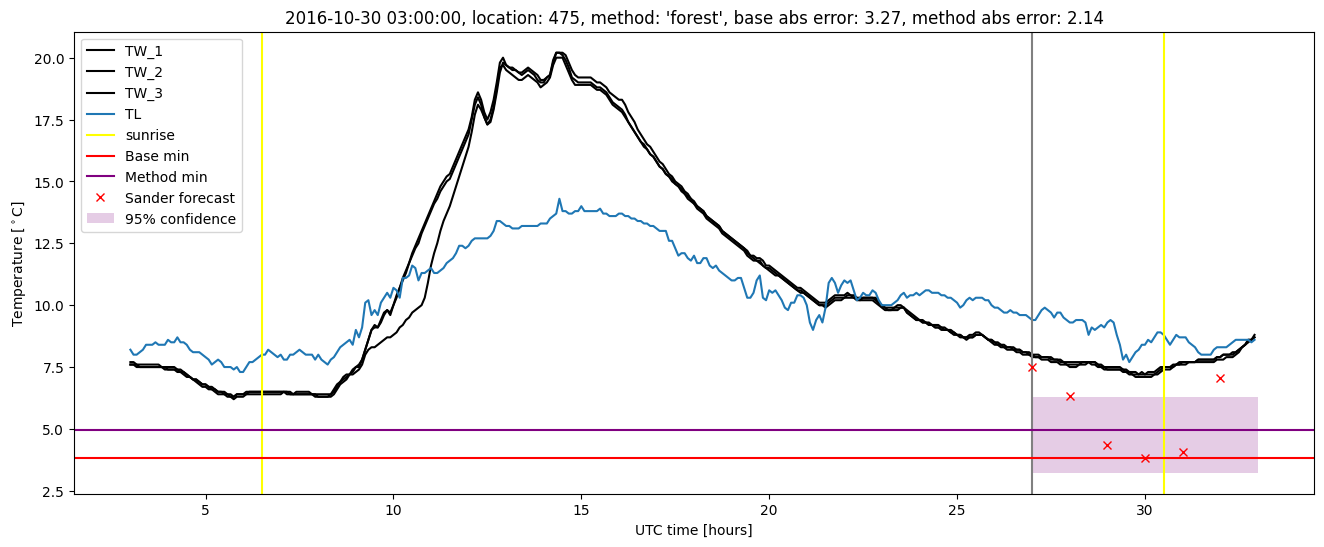
| forest |
winter 2019 |
0.992 |
0.111 |
0.384 |
0.463 |
1.882 |
0.421 |
1.664 |
| baseline |
all |
0.966 |
0.080 |
0.739 |
0.630 |
3.332 |
NaN |
NaN |
| forest |
all |
0.983 |
0.088 |
0.424 |
0.485 |
2.630 |
0.421 |
2.068 |
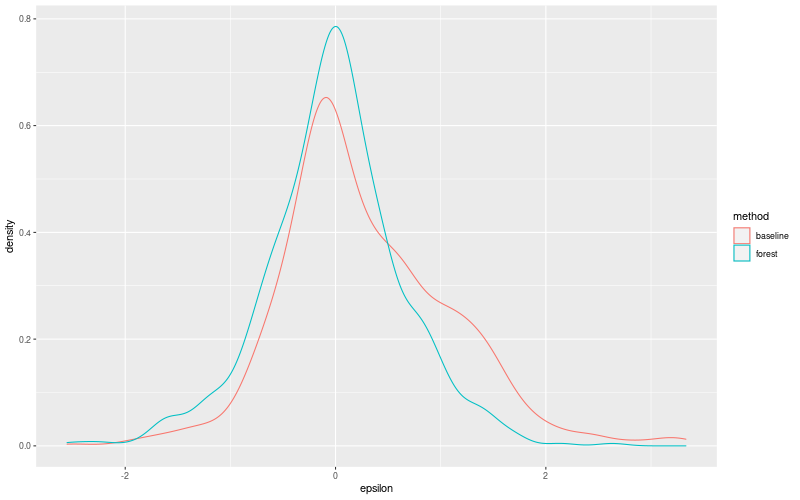
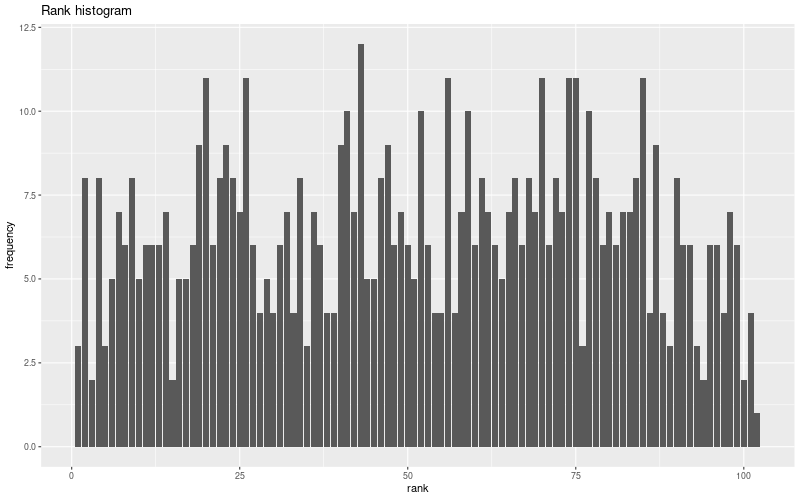
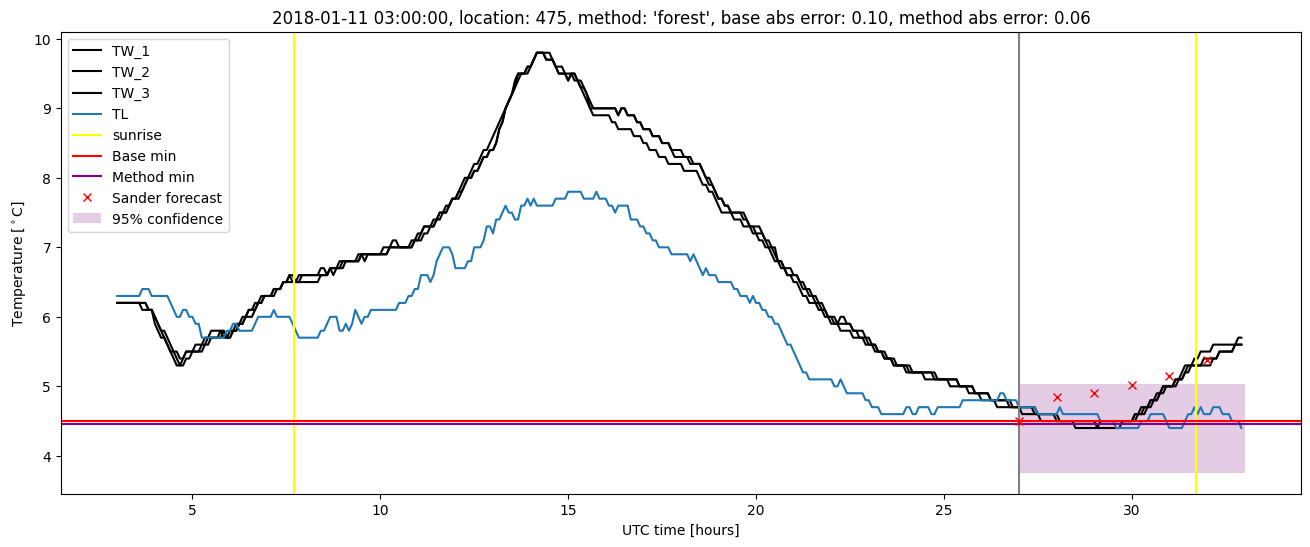
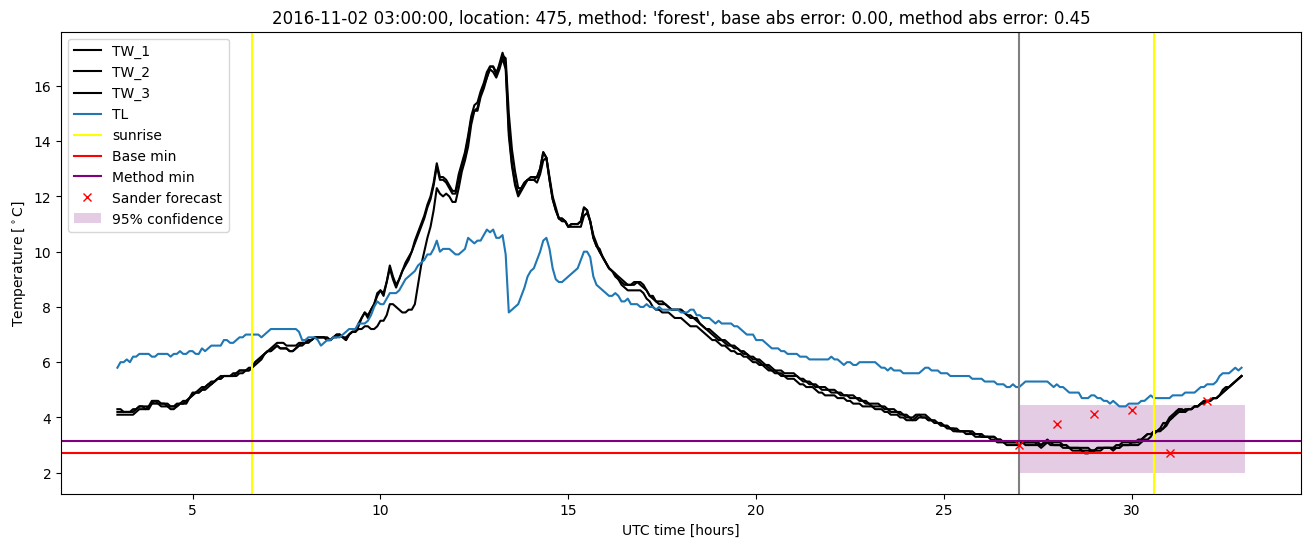
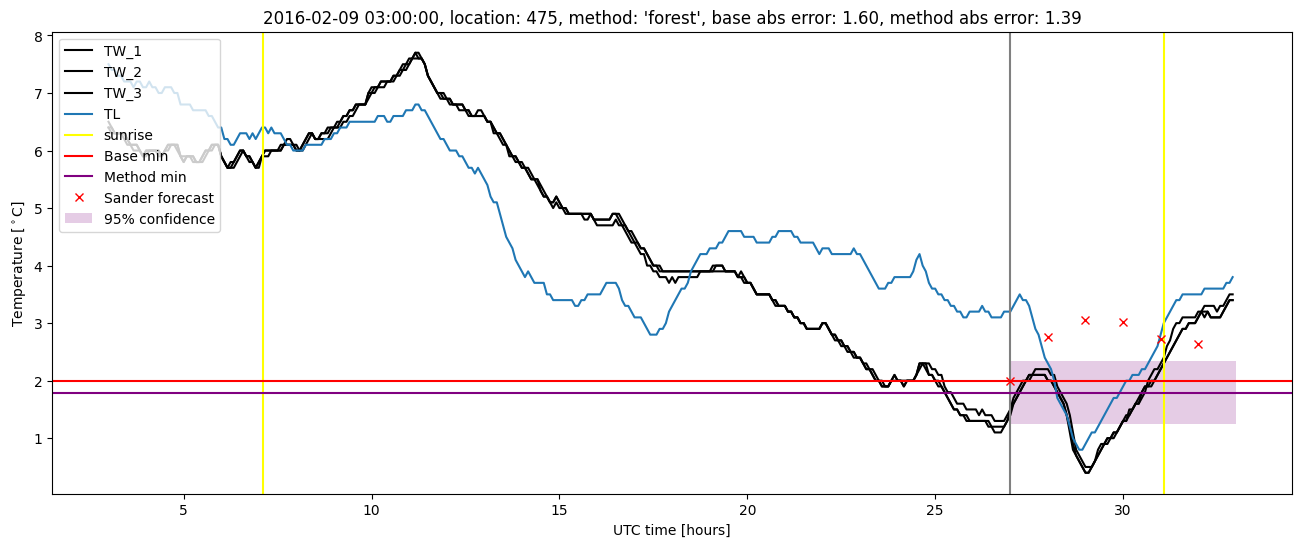
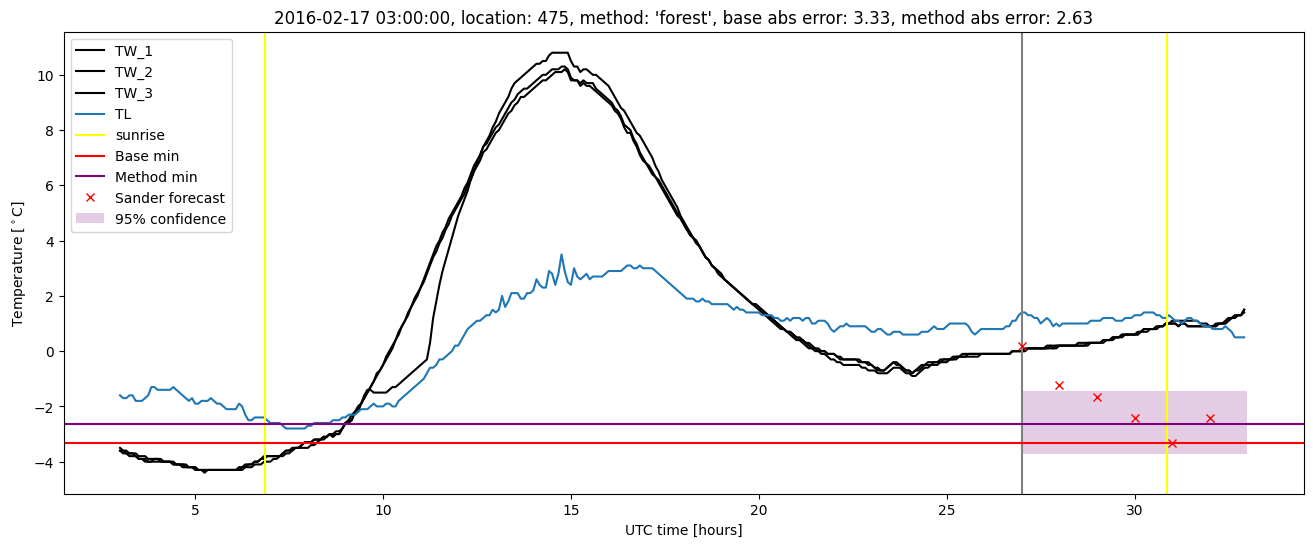
Random forest plots
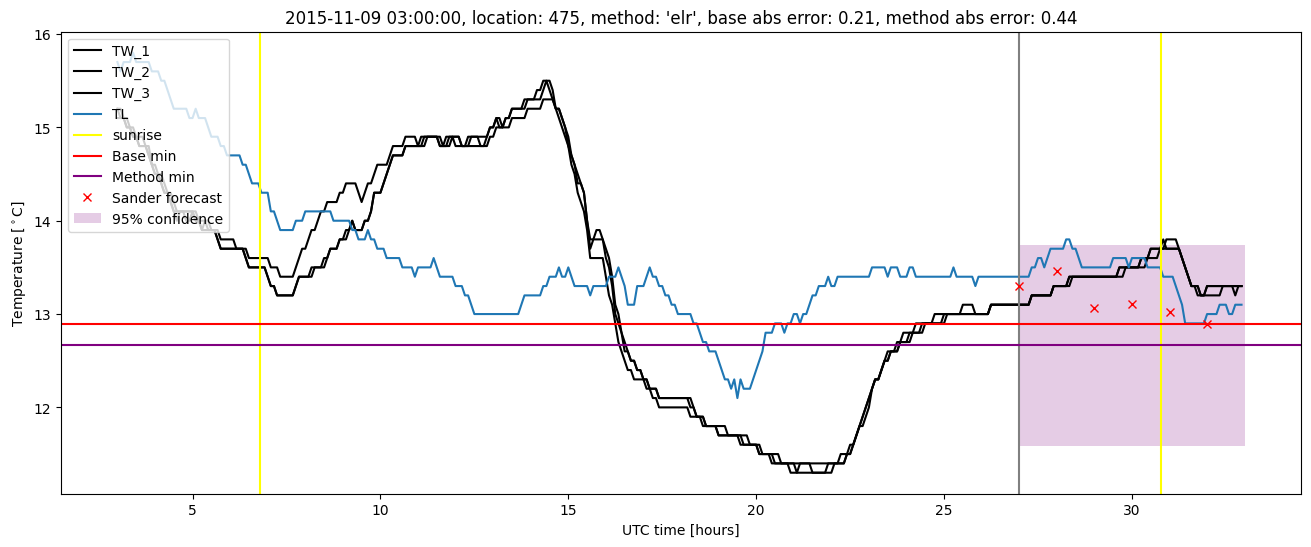
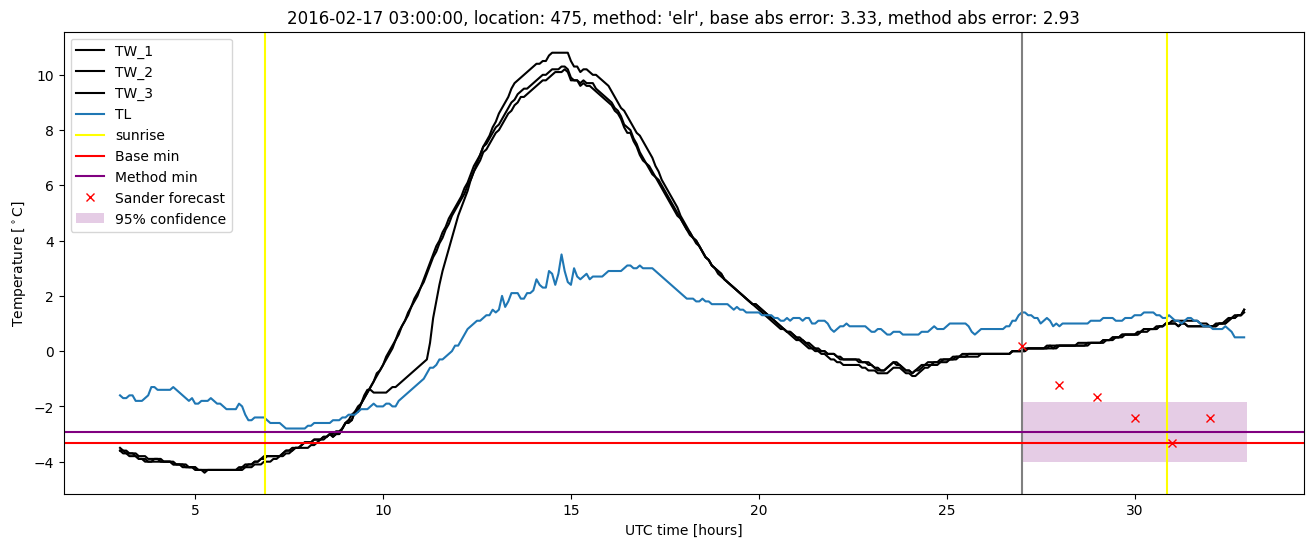
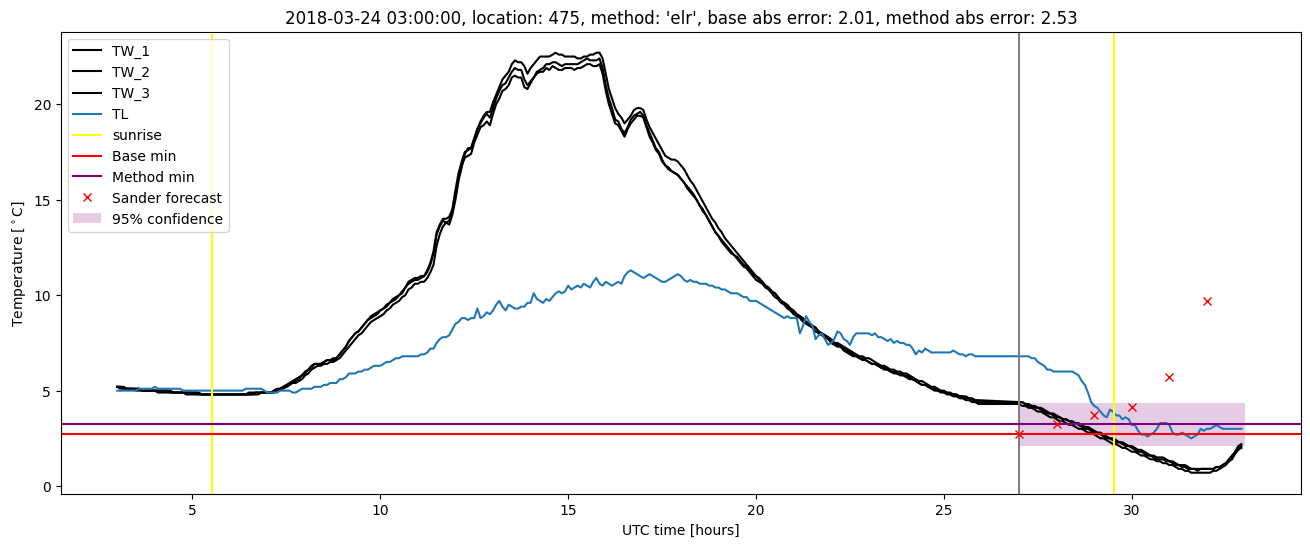
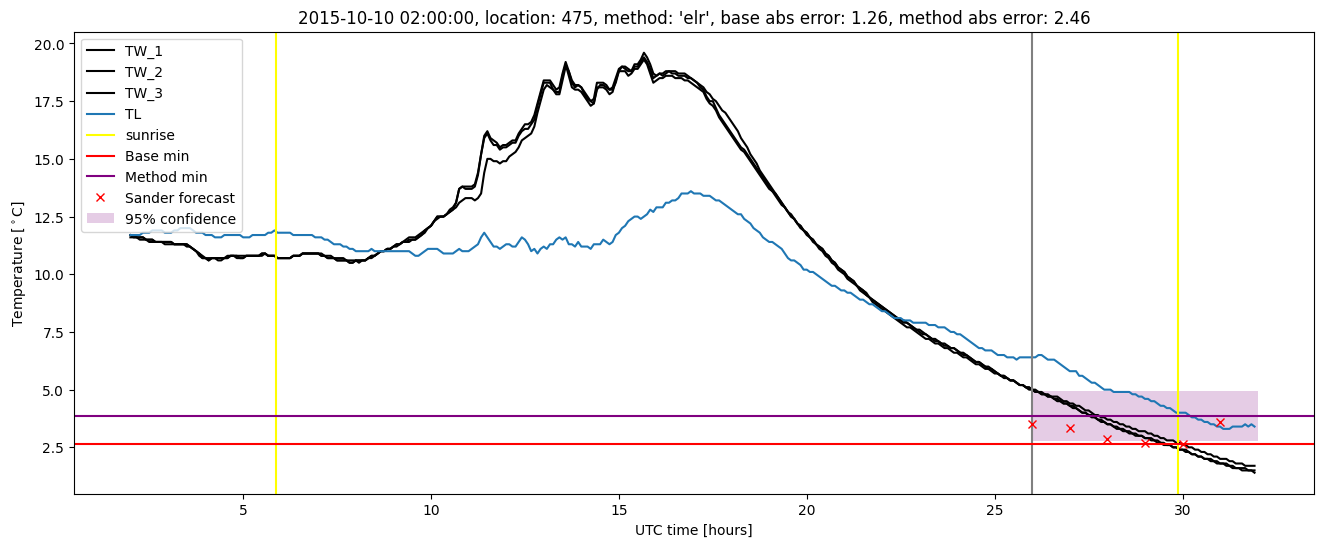
Extended logistic regression results
| names |
period |
power |
significance |
meanSquareError |
absError |
maxError |
CRPS |
IGN |
| baseline |
winter 2016 |
0.975 |
0.167 |
0.814 |
0.680 |
3.332 |
NaN |
NaN |
| elr |
winter 2016 |
0.975 |
0.133 |
0.555 |
0.561 |
2.927 |
0.467 |
1.801 |
| baseline |
winter 2017 |
0.936 |
0.000e+00 |
0.872 |
0.680 |
3.267 |
NaN |
NaN |
| elr |
winter 2017 |
0.963 |
0.026 |
0.476 |
0.509 |
2.167 |
0.424 |
1.441 |
| baseline |
winter 2018 |
0.977 |
0.103 |
0.554 |
0.562 |
2.063 |
NaN |
NaN |
| elr |
winter 2018 |
0.985 |
0.154 |
0.460 |
0.502 |
2.528 |
0.486 |
1.783 |
| baseline |
winter 2019 |
0.969 |
0.056 |
0.722 |
0.596 |
3.205 |
NaN |
NaN |
| elr |
winter 2019 |
0.992 |
0.167 |
0.410 |
0.481 |
2.410 |
0.462 |
1.583 |
| baseline |
all |
0.966 |
0.080 |
0.739 |
0.630 |
3.332 |
NaN |
NaN |
| elr |
all |
0.979 |
0.112 |
0.480 |
0.516 |
2.927 |
0.461 |
1.667 |
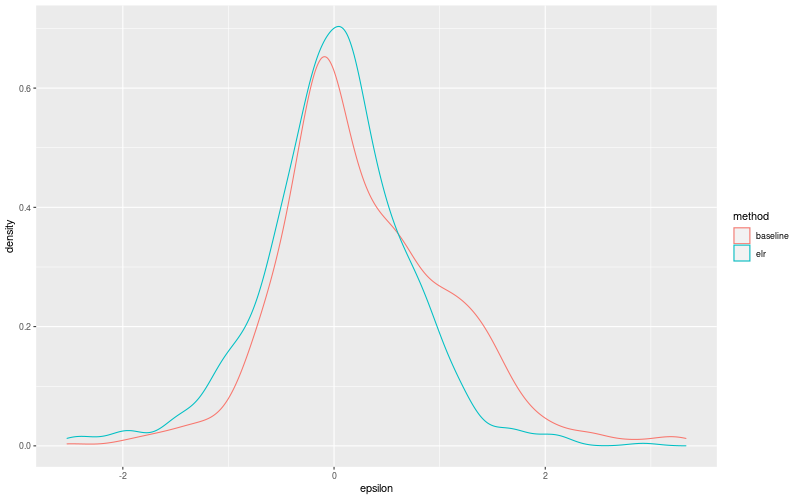
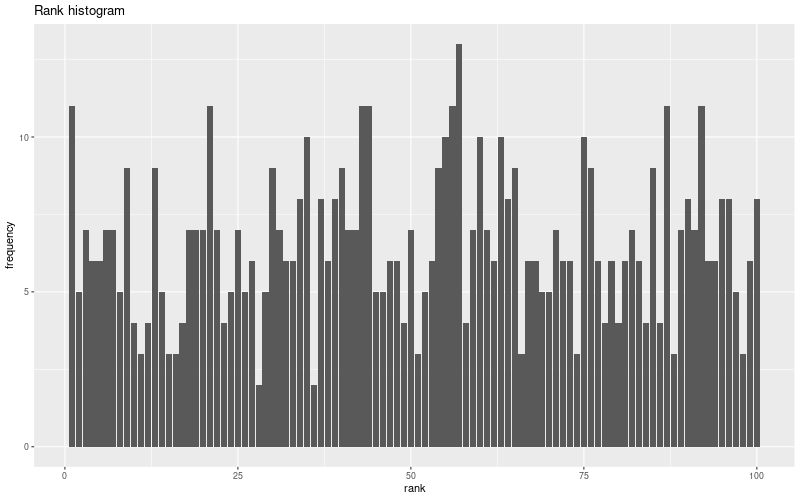
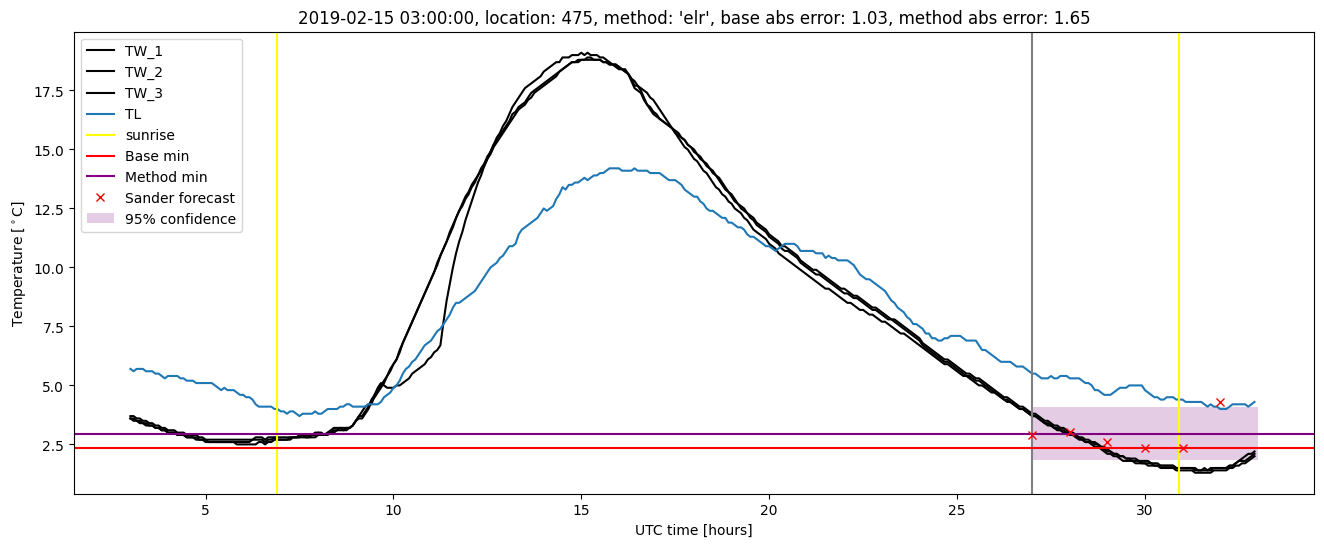
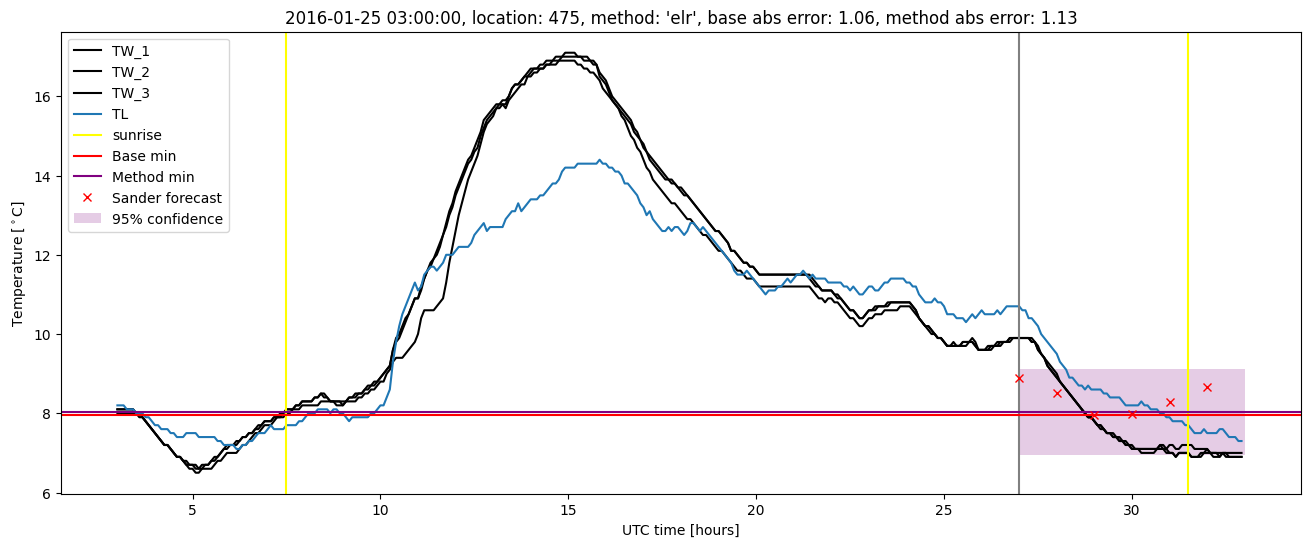
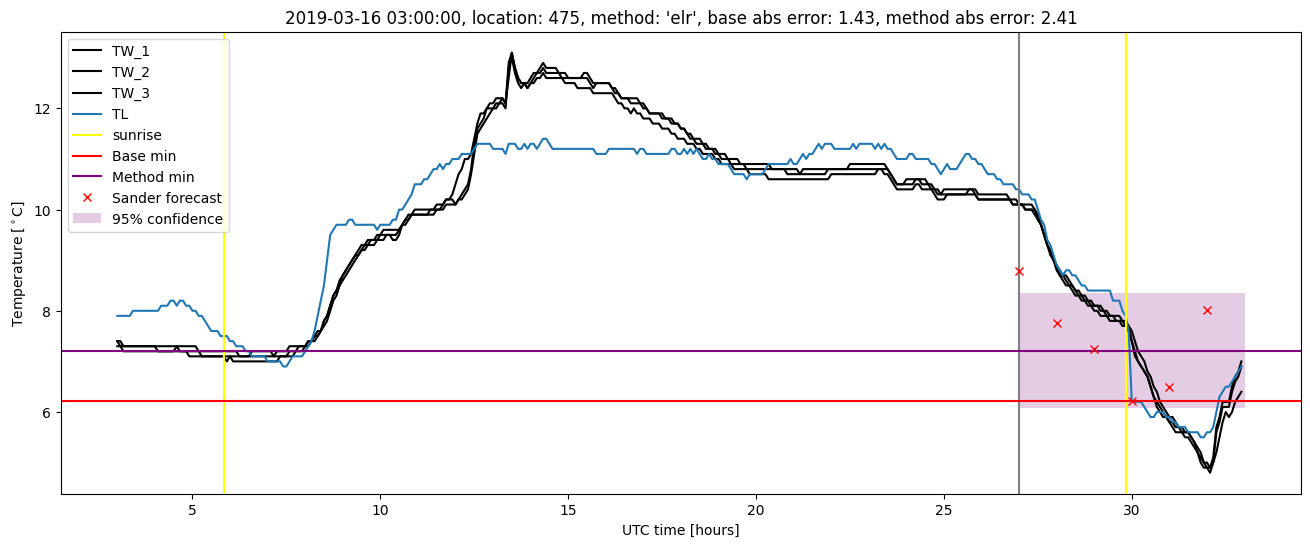
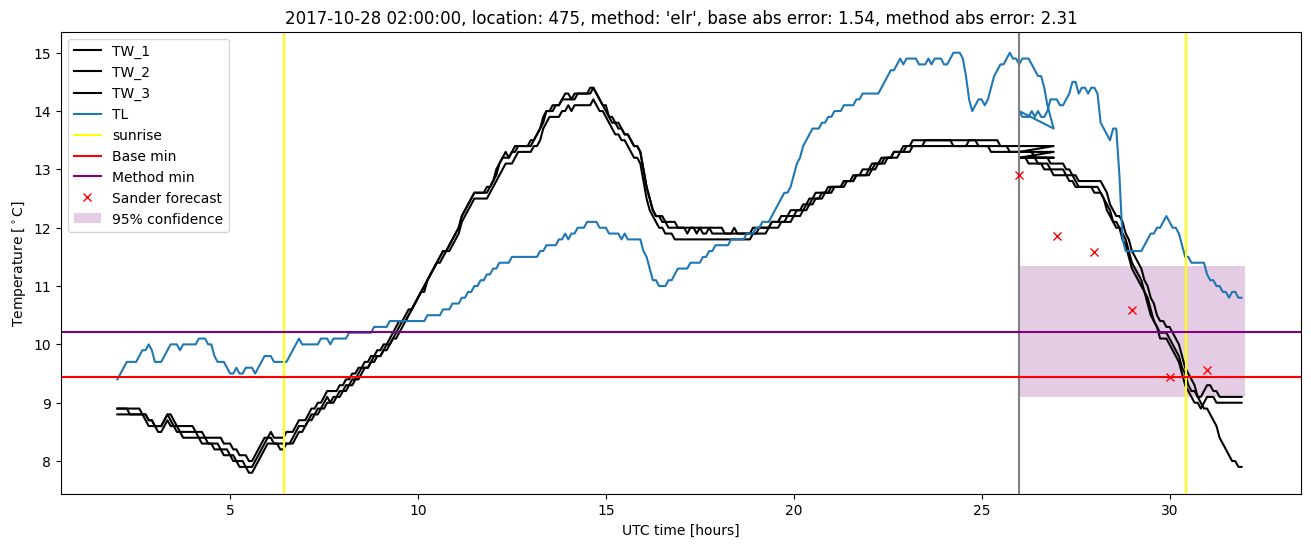
Extended logistic regression plots