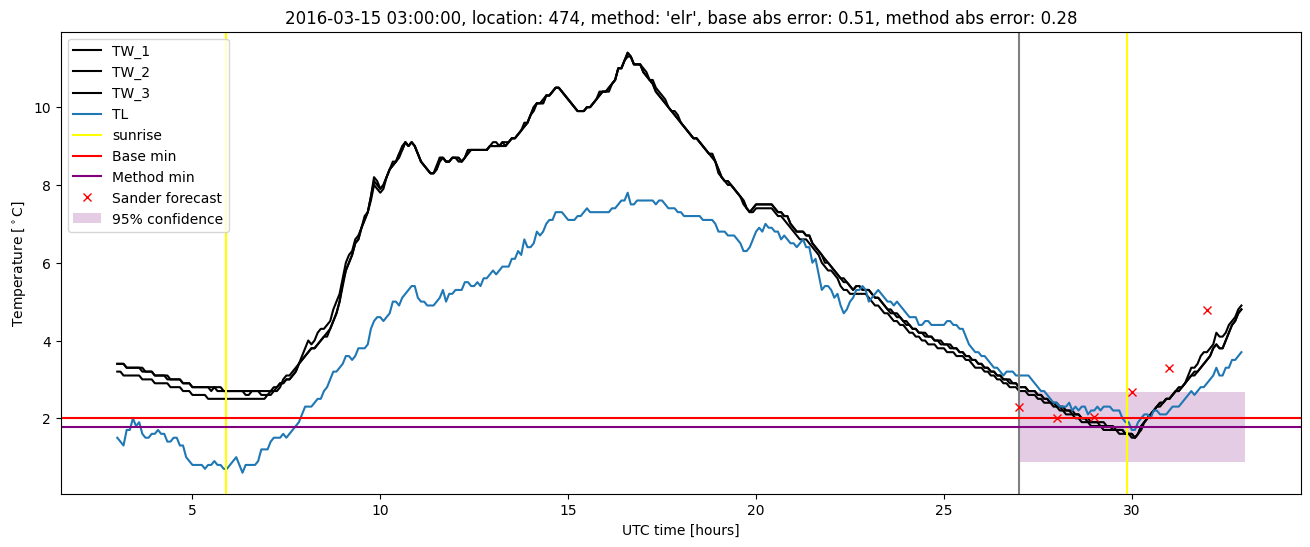
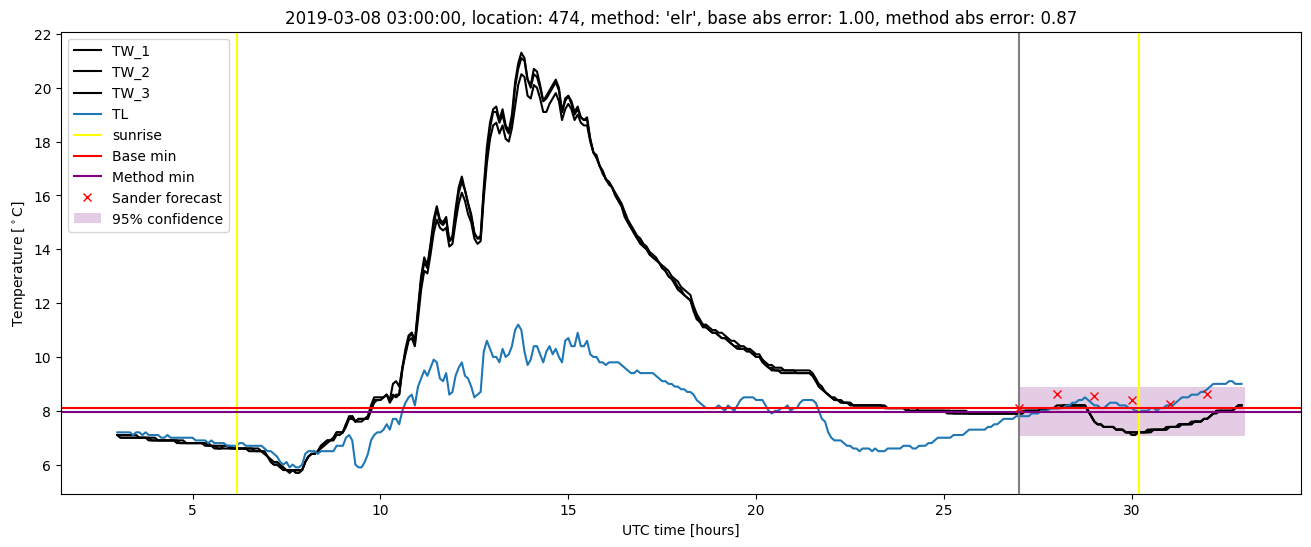
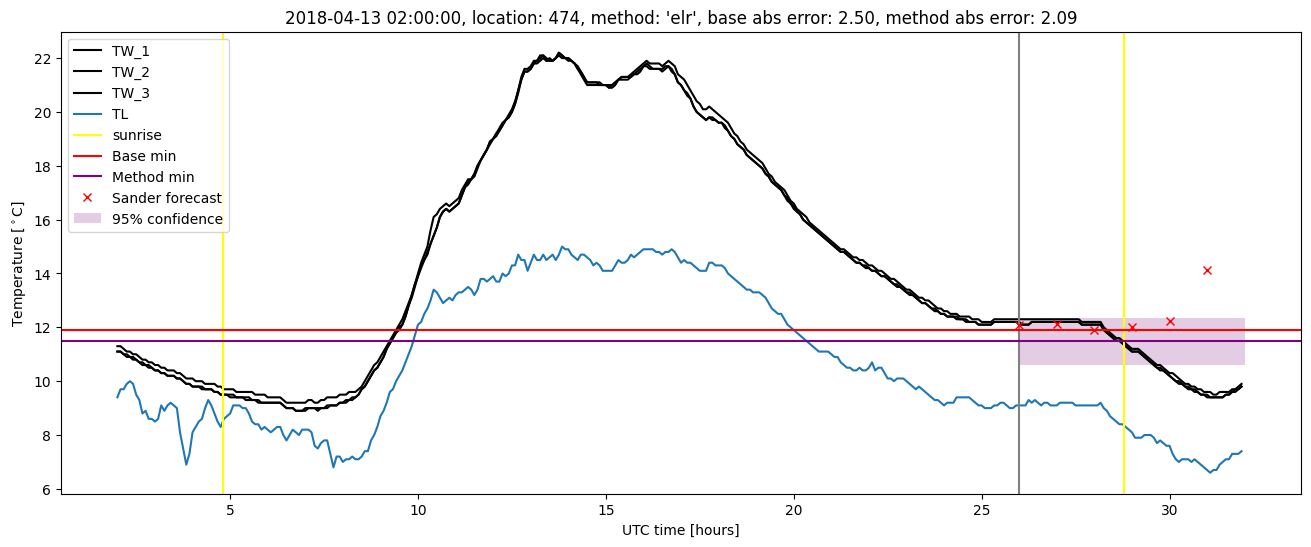
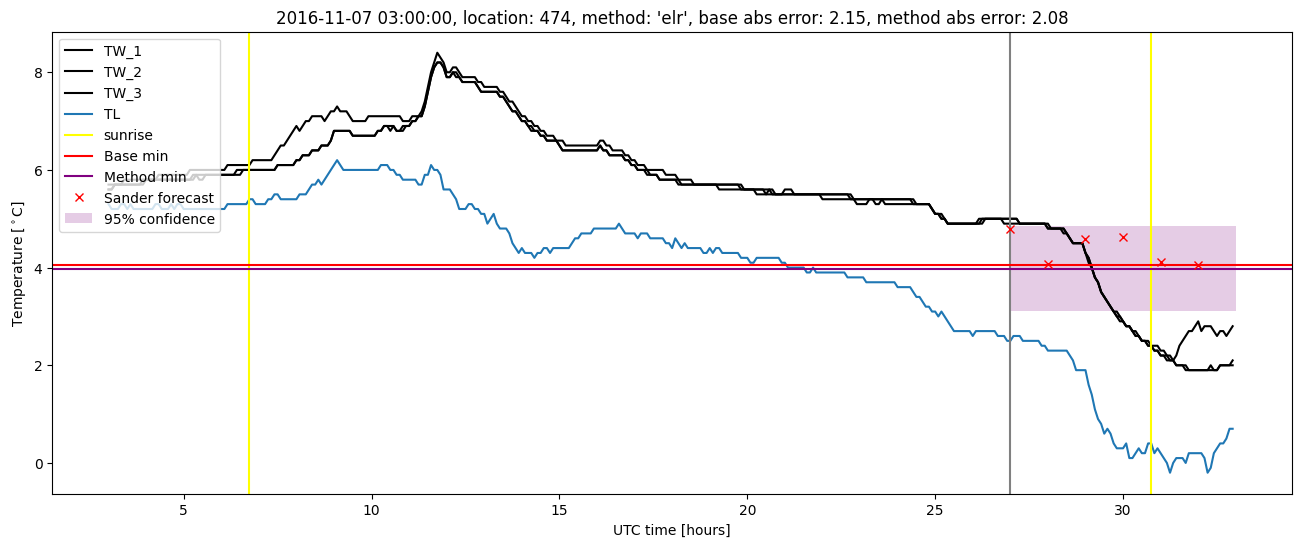
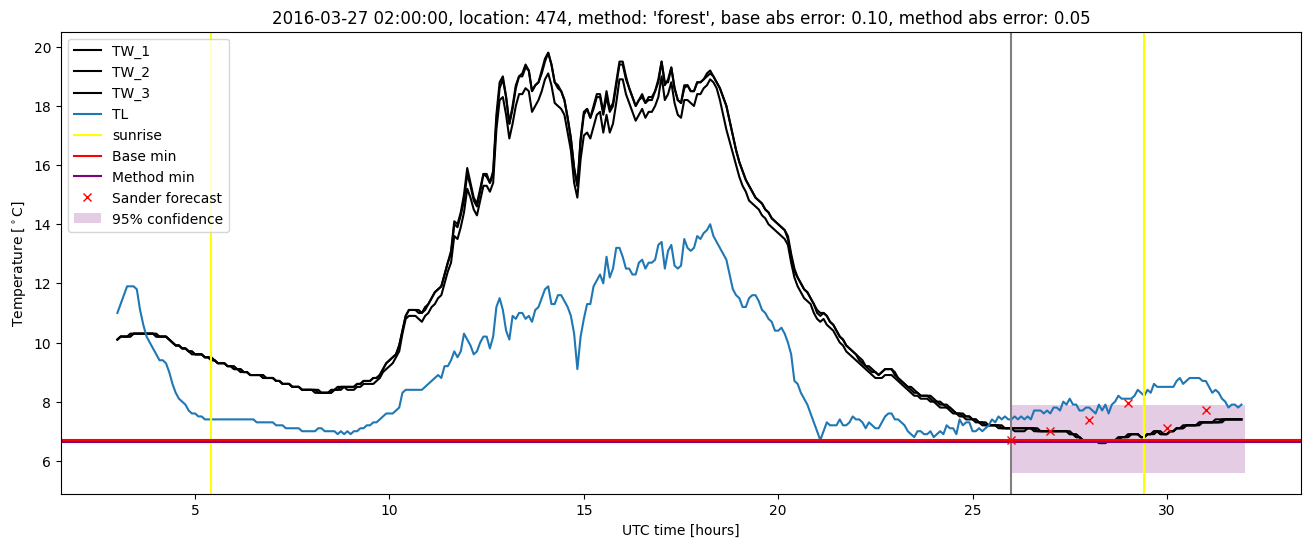
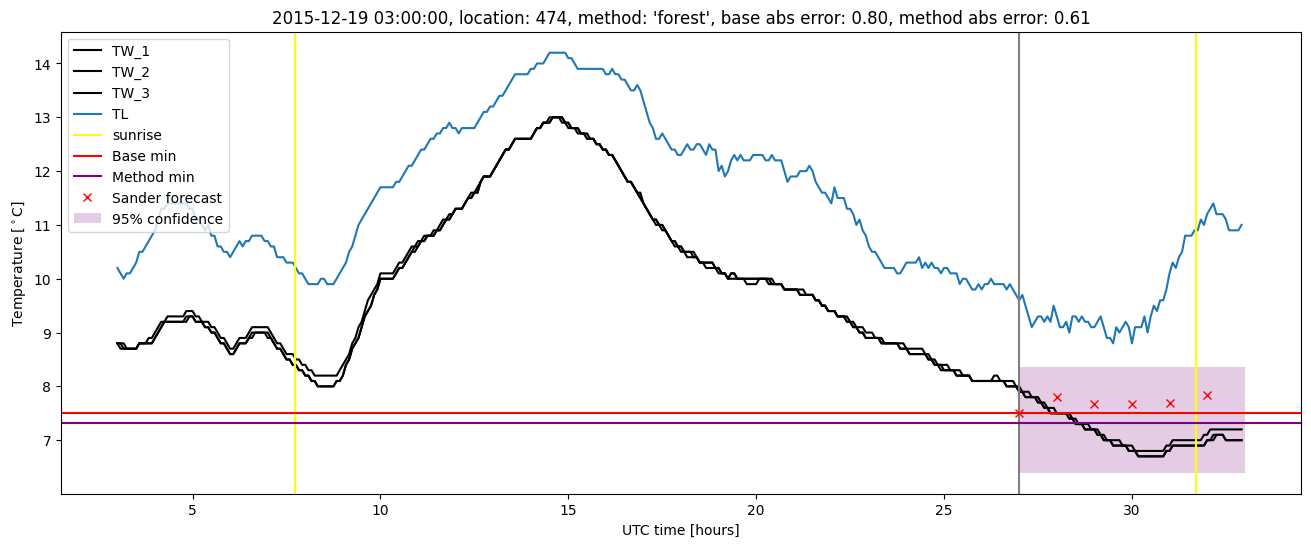
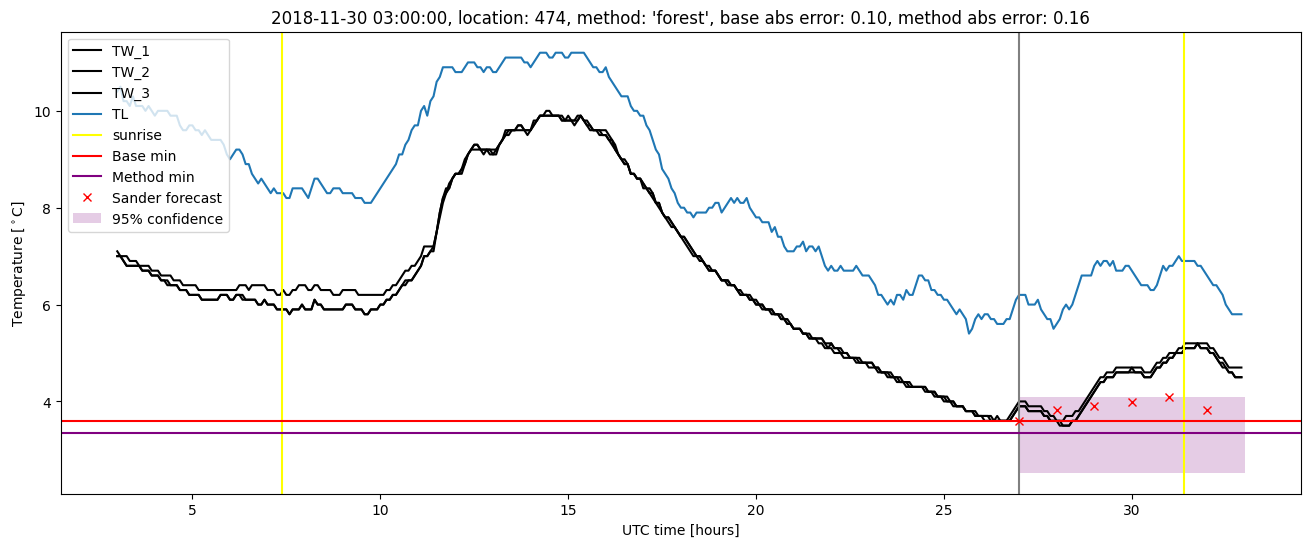
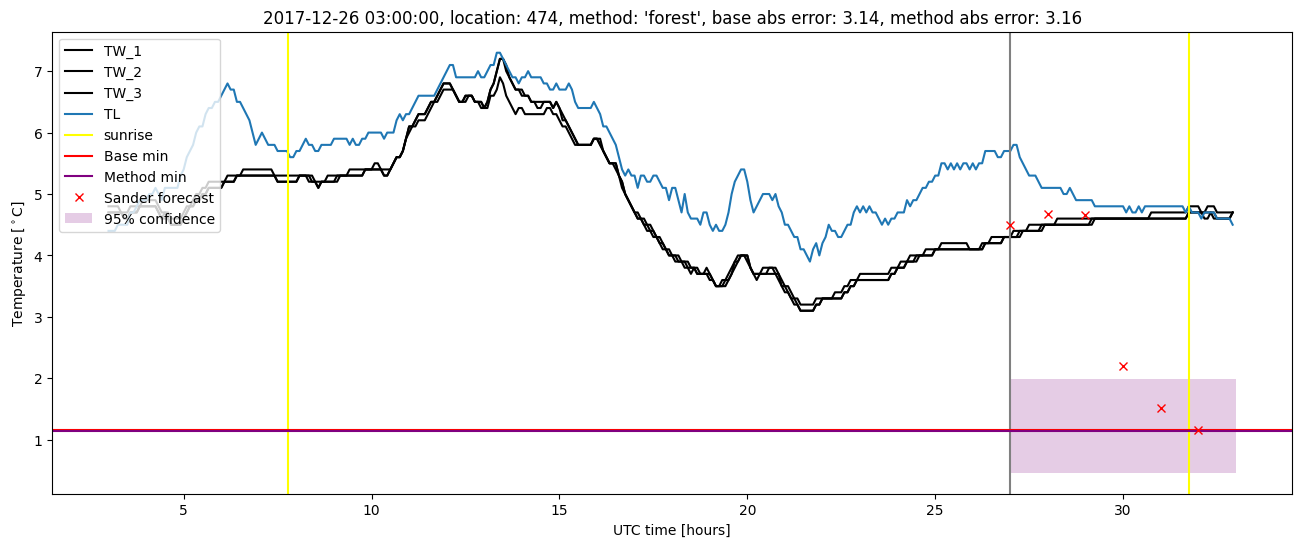
GMS location: 474
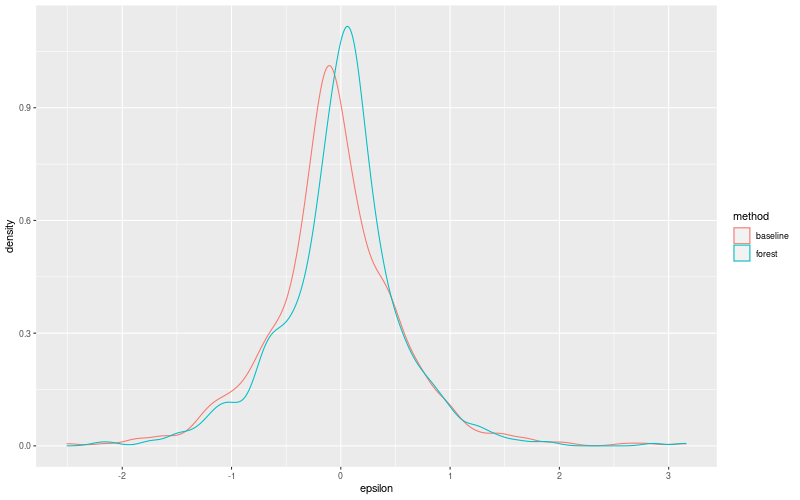
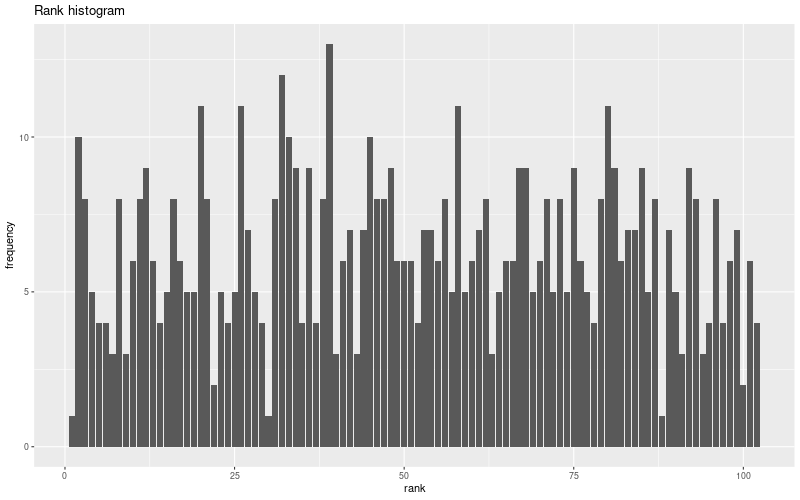
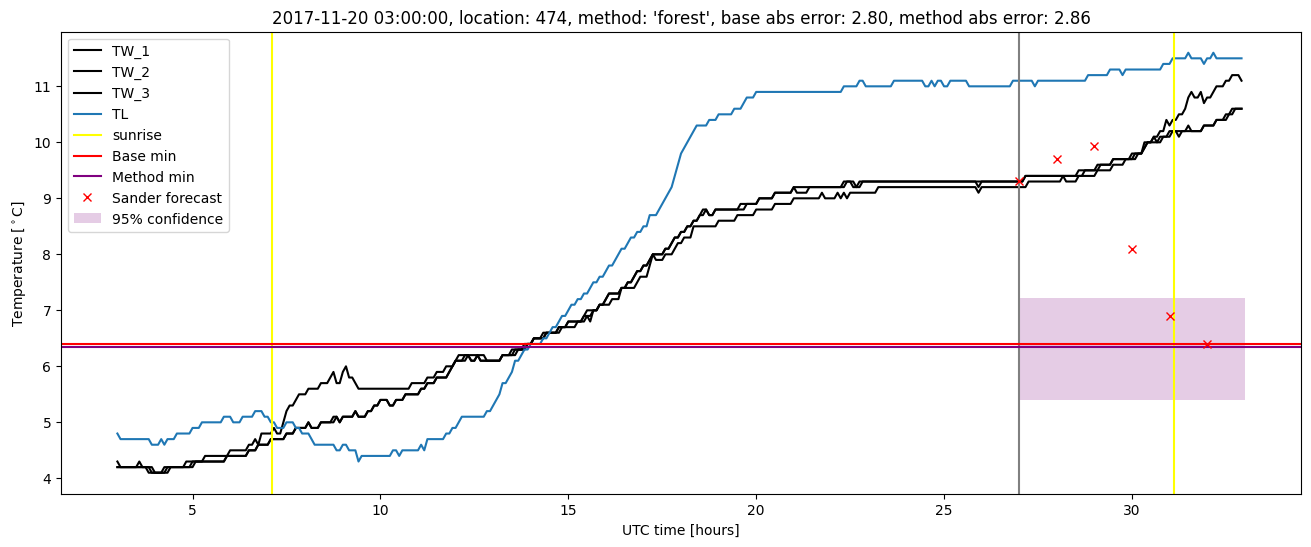
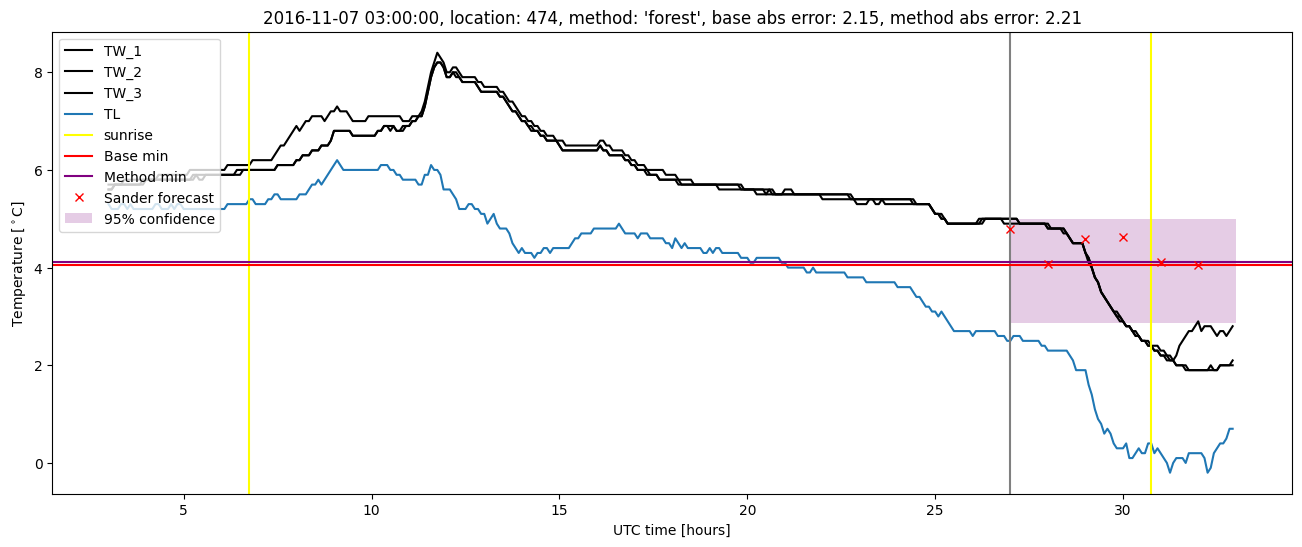
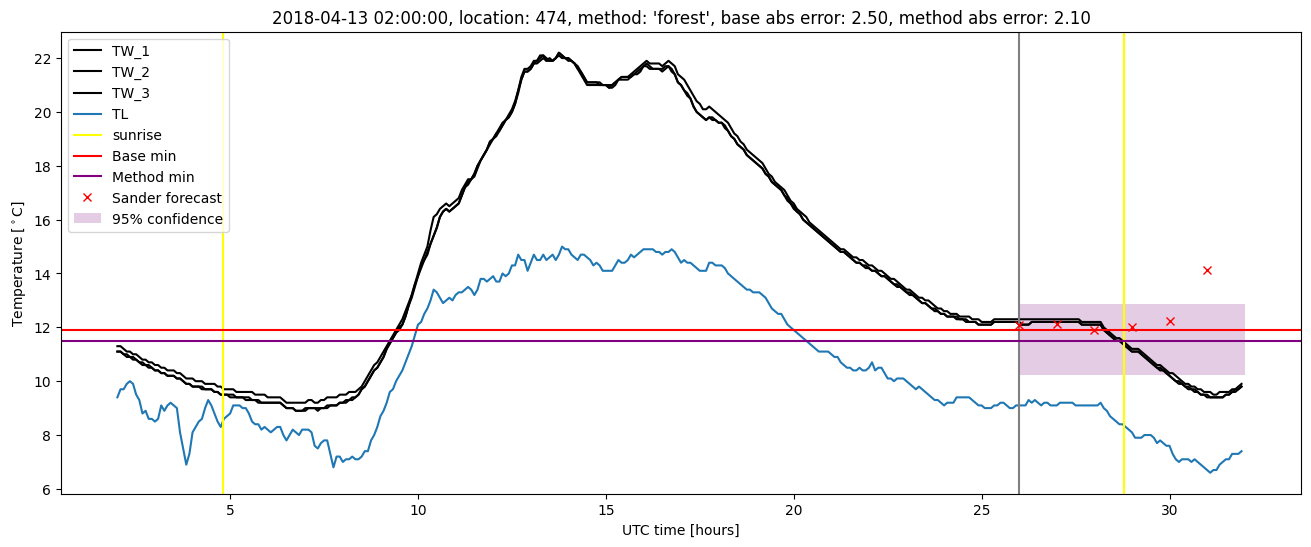
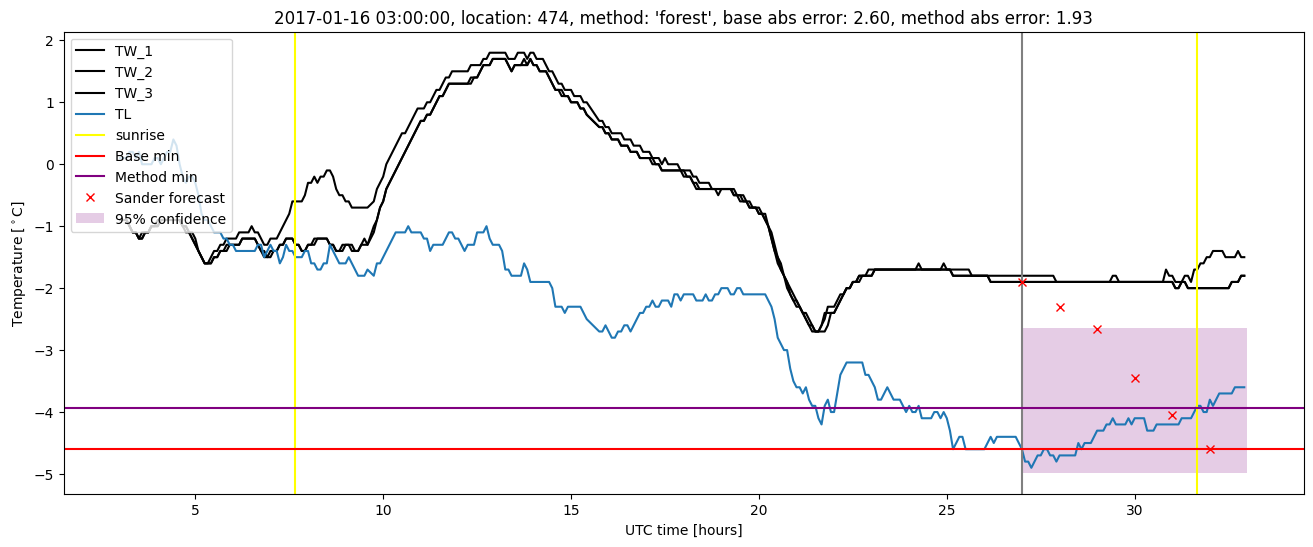
Random forest results
| names |
period |
power |
significance |
meanSquareError |
absError |
maxError |
CRPS |
IGN |
| baseline |
winter 2016 |
1.000 |
0.111 |
0.353 |
0.445 |
1.895 |
NaN |
NaN |
| forest |
winter 2016 |
1.000 |
0.111 |
0.288 |
0.397 |
1.750 |
0.508 |
2.813 |
| baseline |
winter 2017 |
0.964 |
0.073 |
0.424 |
0.476 |
2.595 |
NaN |
NaN |
| forest |
winter 2017 |
0.964 |
0.049 |
0.361 |
0.431 |
2.215 |
0.494 |
3.535 |
| baseline |
winter 2018 |
0.985 |
0.111 |
0.426 |
0.437 |
3.137 |
NaN |
NaN |
| forest |
winter 2018 |
0.977 |
0.074 |
0.381 |
0.409 |
3.158 |
0.506 |
3.079 |
| baseline |
winter 2019 |
0.985 |
0.000e+00 |
0.285 |
0.378 |
2.057 |
NaN |
NaN |
| forest |
winter 2019 |
0.985 |
0.000e+00 |
0.231 |
0.339 |
1.540 |
0.492 |
2.378 |
| baseline |
all |
0.985 |
0.080 |
0.372 |
0.435 |
3.137 |
NaN |
NaN |
| forest |
all |
0.984 |
0.060 |
0.315 |
0.395 |
3.158 |
0.500 |
2.949 |
Random forest plots
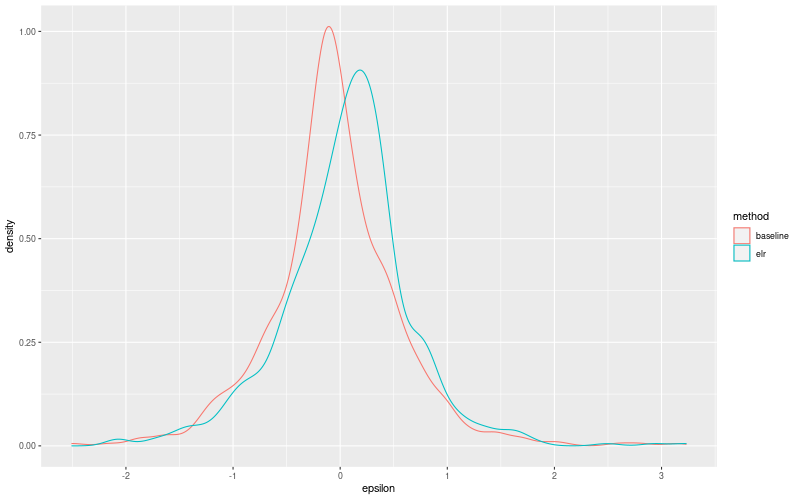
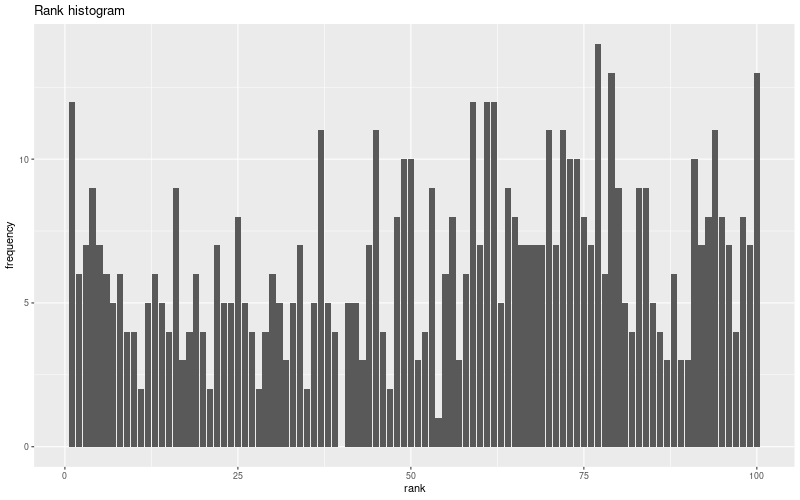
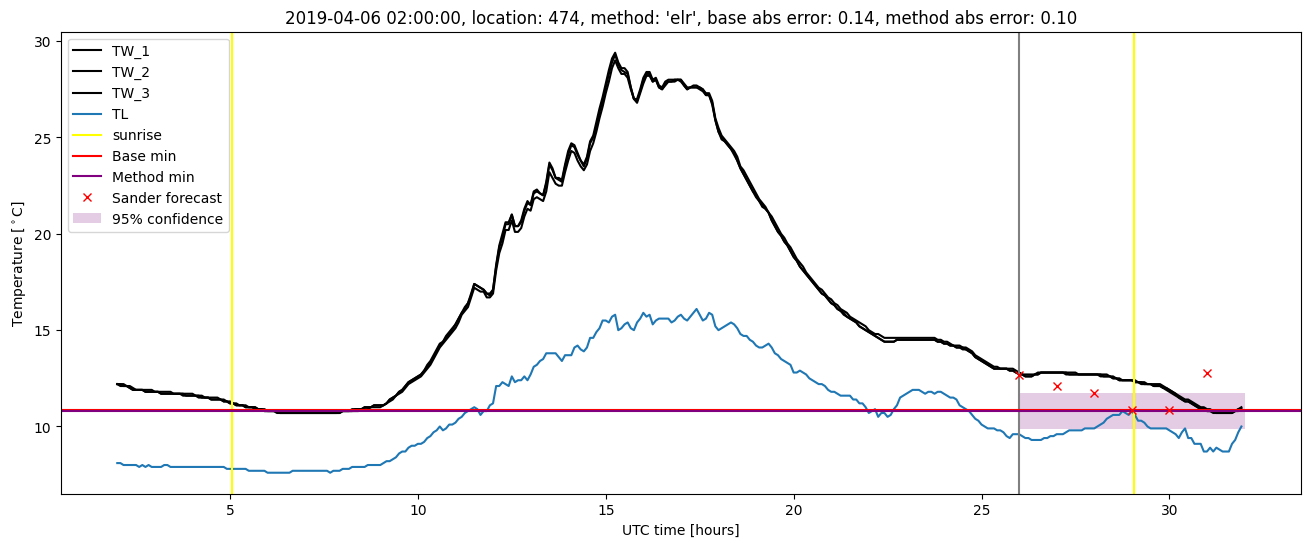
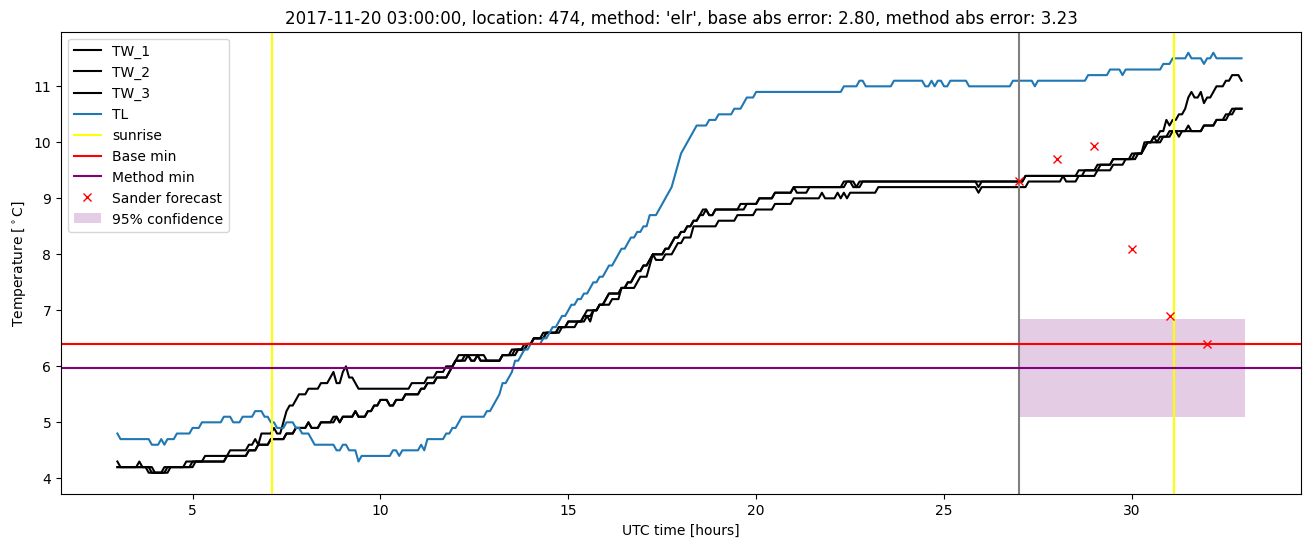
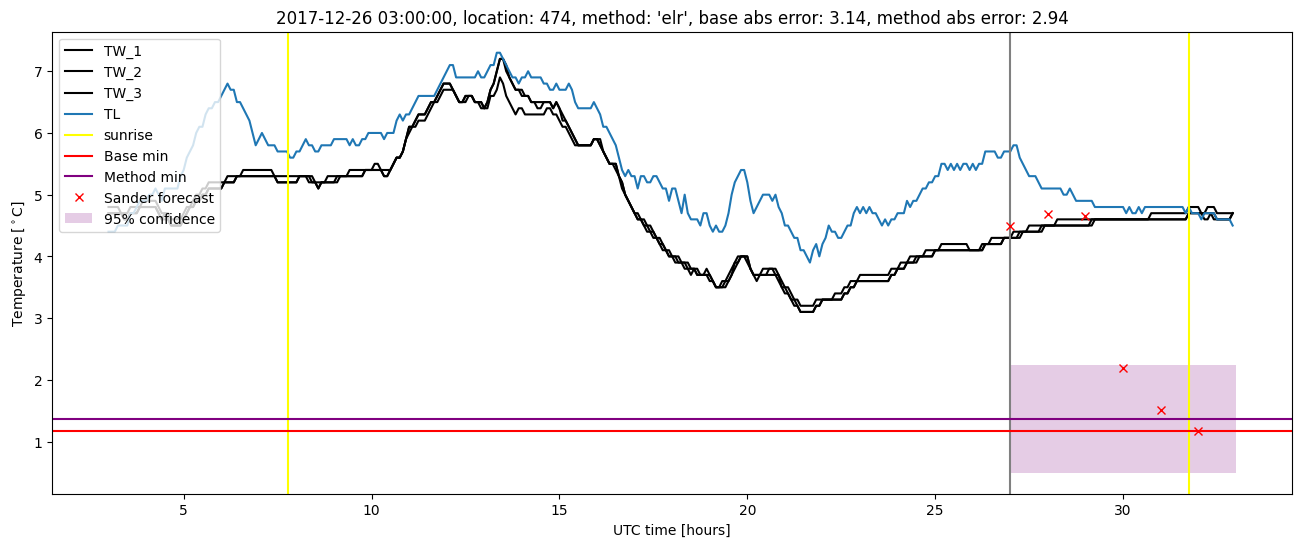
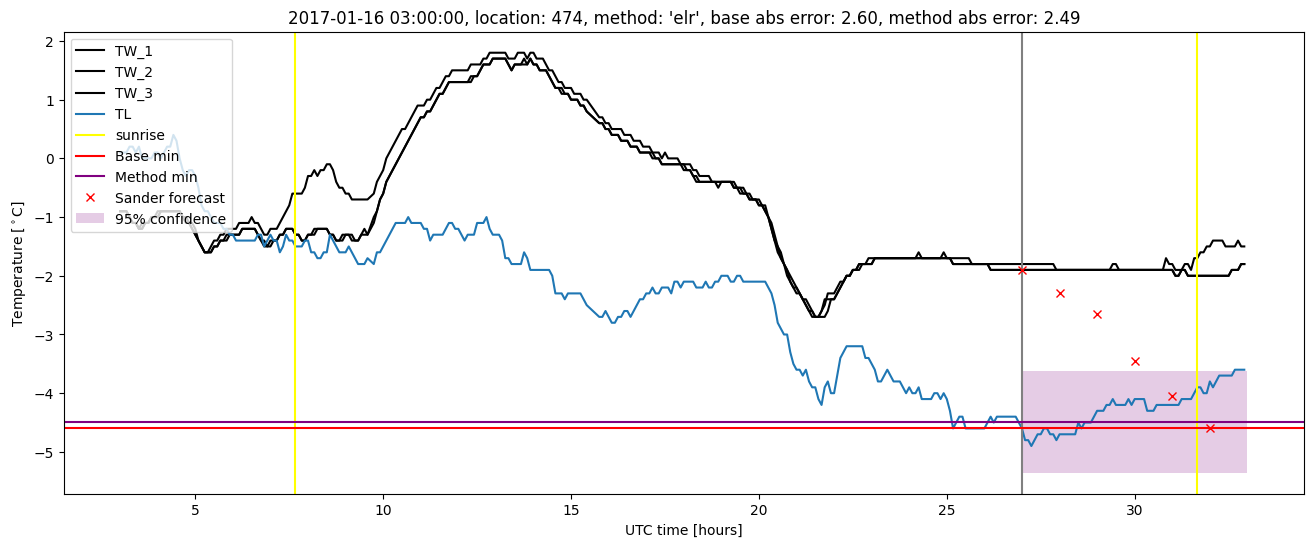
Extended logistic regression results
| names |
period |
power |
significance |
meanSquareError |
absError |
maxError |
CRPS |
IGN |
| baseline |
winter 2016 |
1.000 |
0.111 |
0.353 |
0.445 |
1.895 |
NaN |
NaN |
| elr |
winter 2016 |
1.000 |
0.111 |
0.398 |
0.480 |
2.053 |
0.587 |
4.563 |
| baseline |
winter 2017 |
0.964 |
0.073 |
0.424 |
0.476 |
2.595 |
NaN |
NaN |
| elr |
winter 2017 |
0.955 |
0.049 |
0.401 |
0.474 |
2.490 |
0.583 |
5.235 |
| baseline |
winter 2018 |
0.985 |
0.111 |
0.426 |
0.437 |
3.137 |
NaN |
NaN |
| elr |
winter 2018 |
0.985 |
0.074 |
0.405 |
0.427 |
3.230 |
0.602 |
5.312 |
| baseline |
winter 2019 |
0.985 |
0.000e+00 |
0.285 |
0.378 |
2.057 |
NaN |
NaN |
| elr |
winter 2019 |
0.985 |
0.000e+00 |
0.273 |
0.389 |
1.727 |
0.567 |
4.113 |
| baseline |
all |
0.985 |
0.080 |
0.372 |
0.435 |
3.137 |
NaN |
NaN |
| elr |
all |
0.984 |
0.060 |
0.372 |
0.445 |
3.230 |
0.585 |
4.802 |
Extended logistic regression plots