GMS location: 473
Random forest results
| names |
period |
power |
significance |
meanSquareError |
absError |
maxError |
CRPS |
IGN |
| baseline |
winter 2016 |
0.989 |
0.120 |
0.520 |
0.526 |
3.324 |
NaN |
NaN |
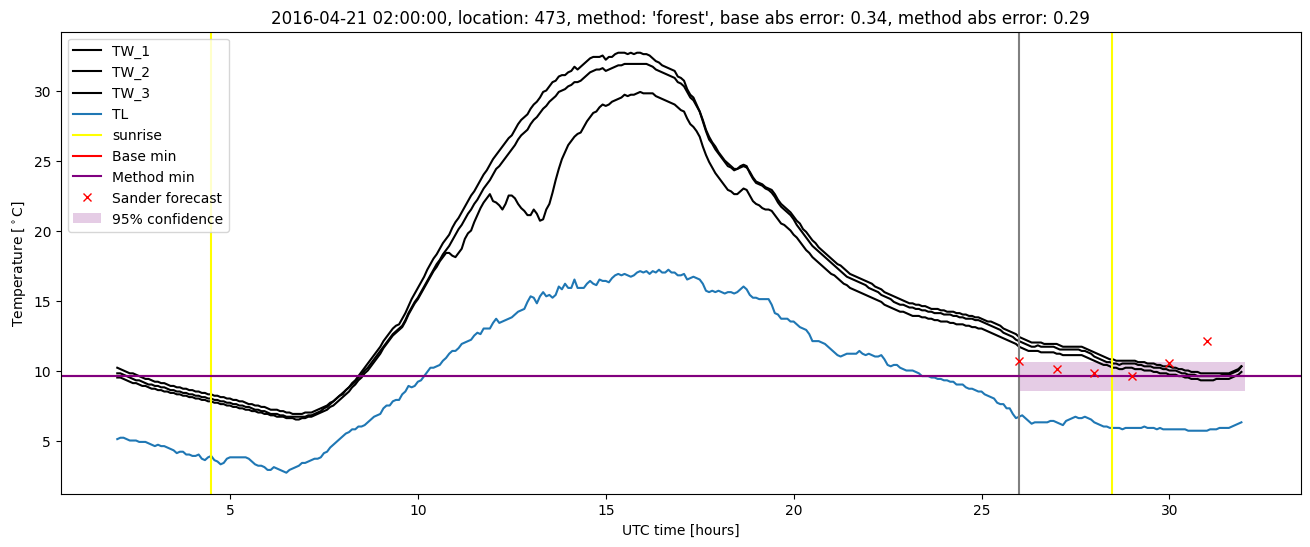
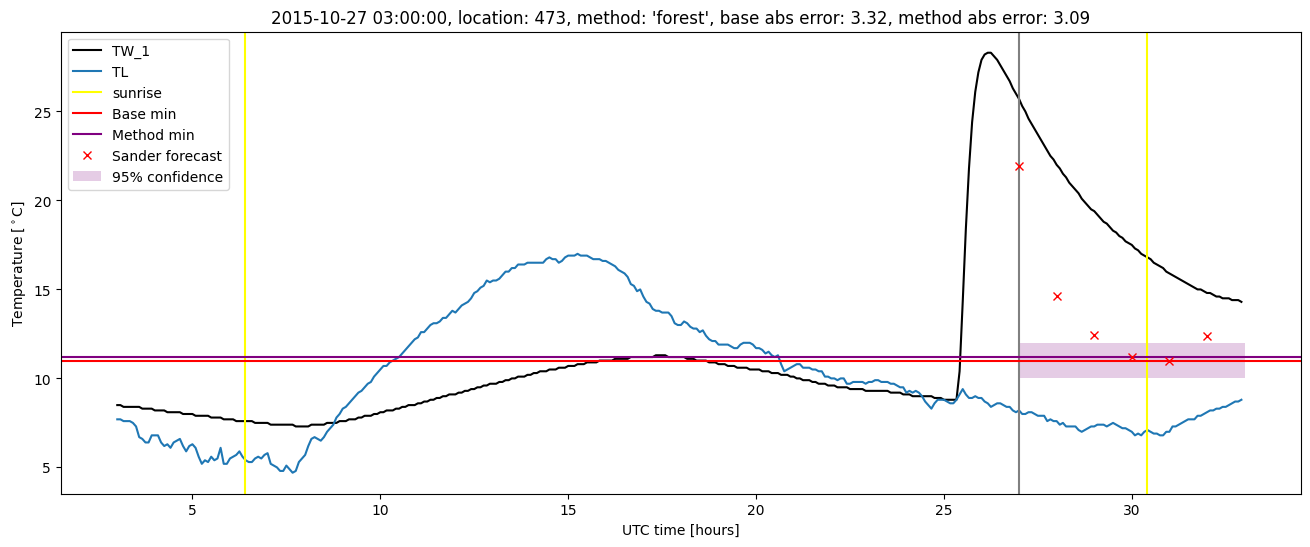
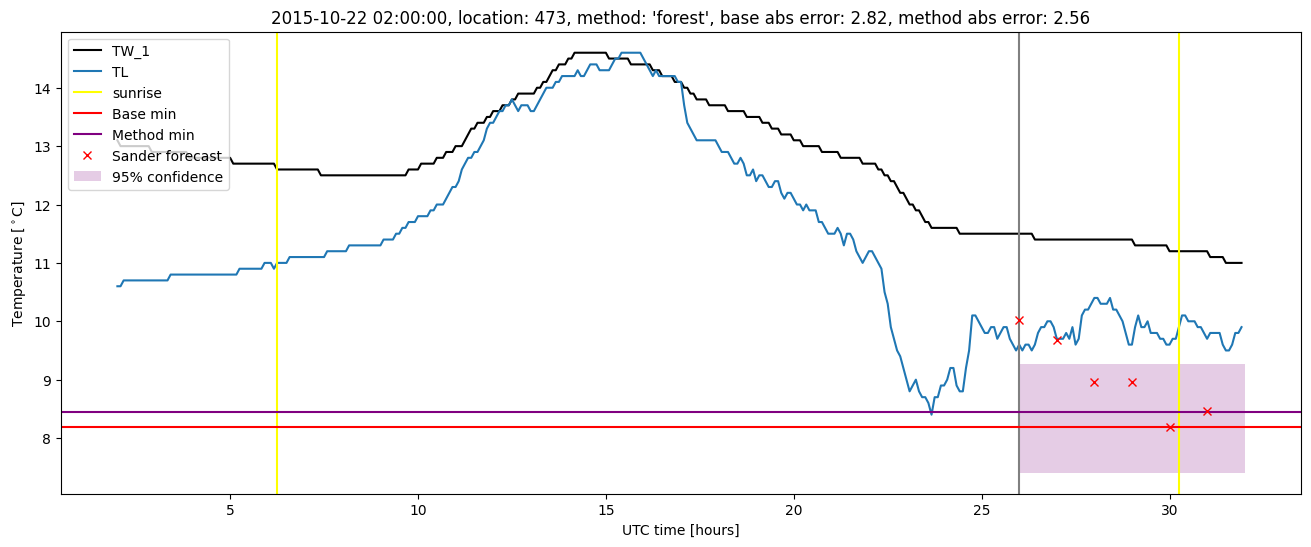
| forest |
winter 2016 |
0.989 |
0.120 |
0.428 |
0.467 |
3.090 |
0.478 |
4.555 |
| baseline |
winter 2017 |
0.990 |
0.075 |
0.395 |
0.466 |
2.392 |
NaN |
NaN |
| forest |
winter 2017 |
0.980 |
0.075 |
0.315 |
0.415 |
1.610 |
0.460 |
3.424 |
| baseline |
winter 2018 |
0.986 |
0.118 |
0.378 |
0.469 |
1.931 |
NaN |
NaN |
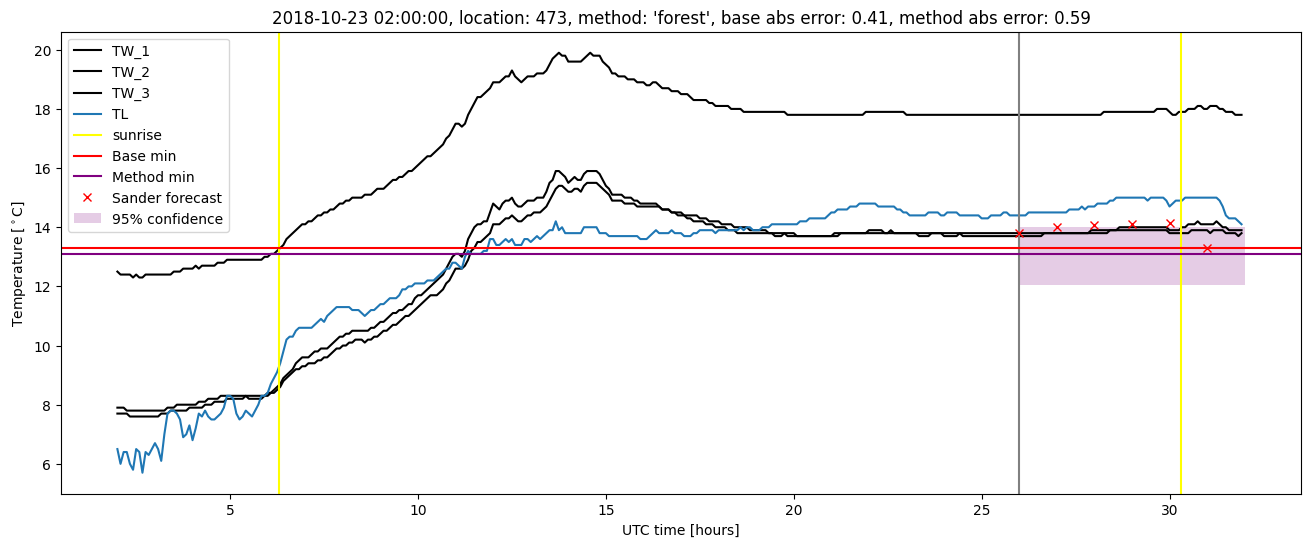
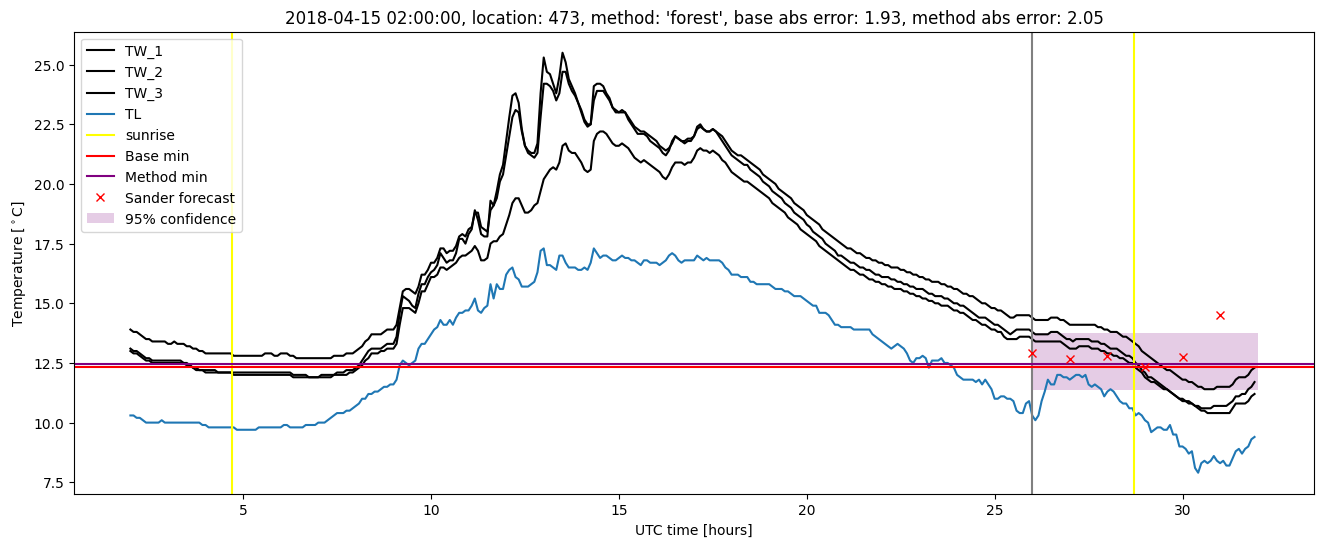
| forest |
winter 2018 |
0.972 |
0.147 |
0.325 |
0.416 |
2.045 |
0.457 |
2.741 |
| baseline |
winter 2019 |
0.993 |
0.000e+00 |
0.284 |
0.405 |
2.289 |
NaN |
NaN |
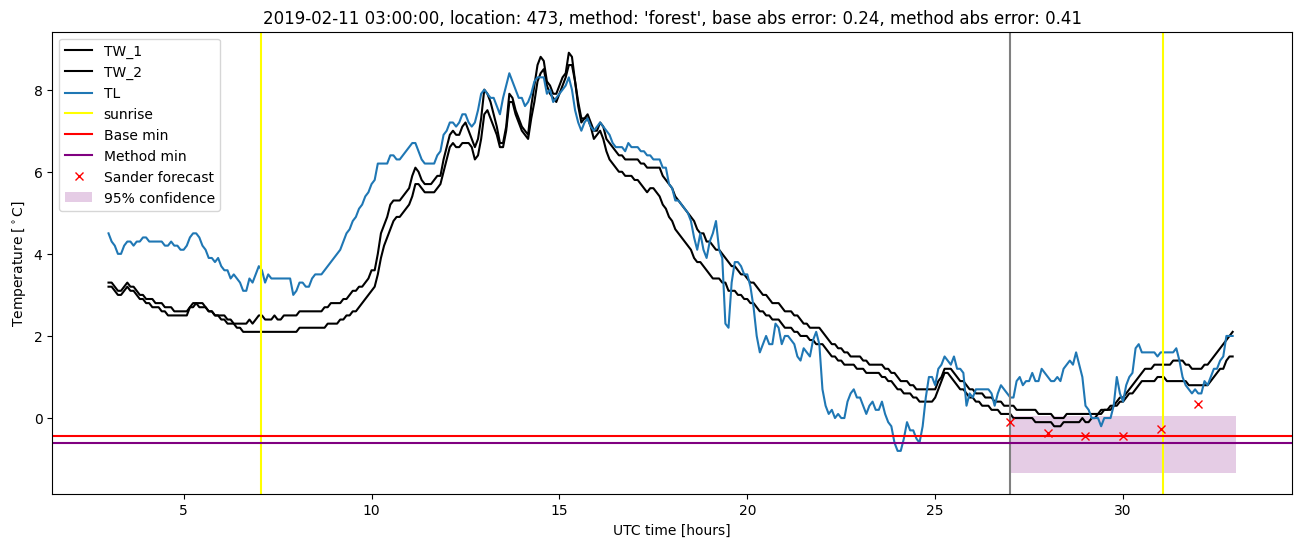
| forest |
winter 2019 |
0.993 |
0.000e+00 |
0.224 |
0.362 |
1.577 |
0.455 |
2.723 |
| baseline |
all |
0.990 |
0.086 |
0.400 |
0.470 |
3.324 |
NaN |
NaN |
| forest |
all |
0.984 |
0.095 |
0.329 |
0.418 |
3.090 |
0.463 |
3.409 |
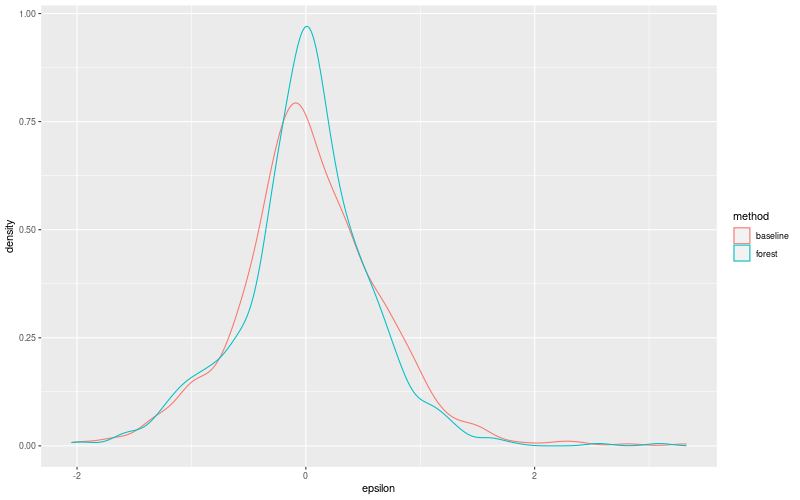
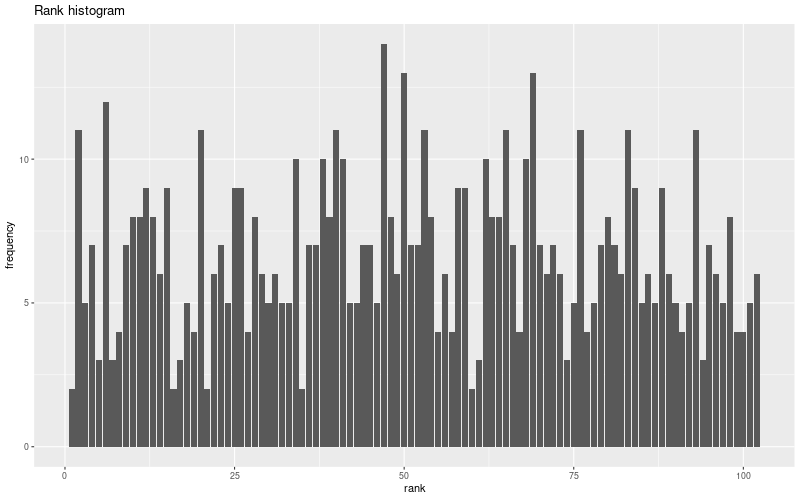
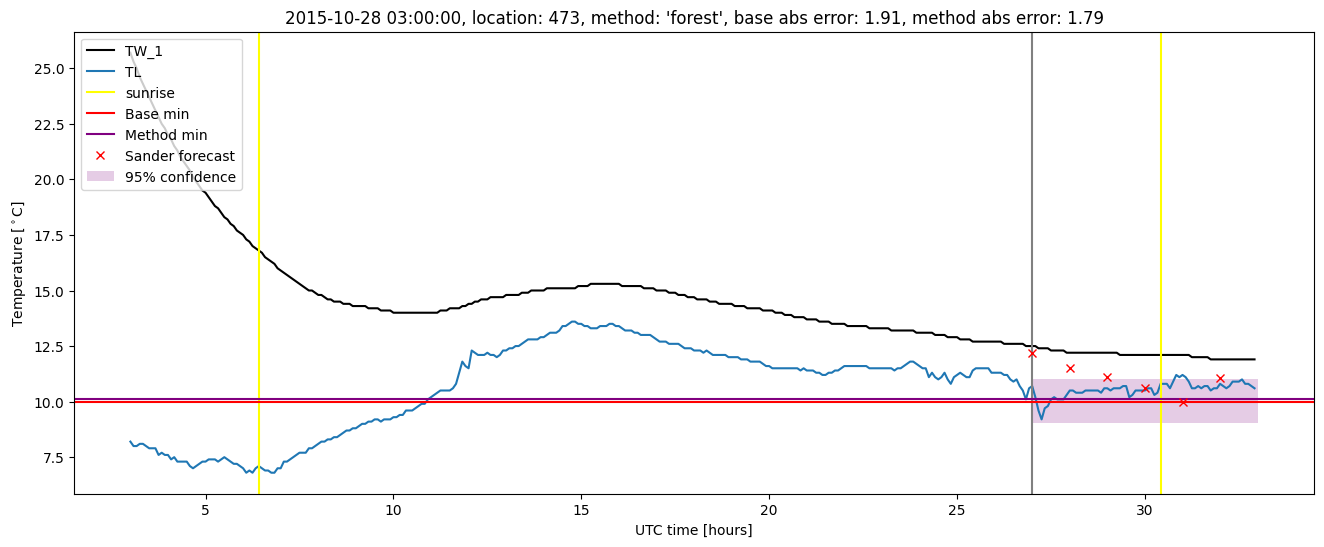
Random forest plots

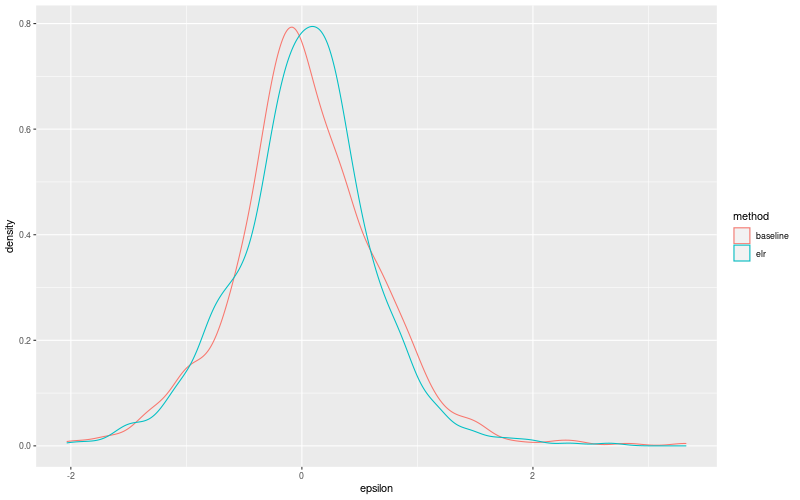
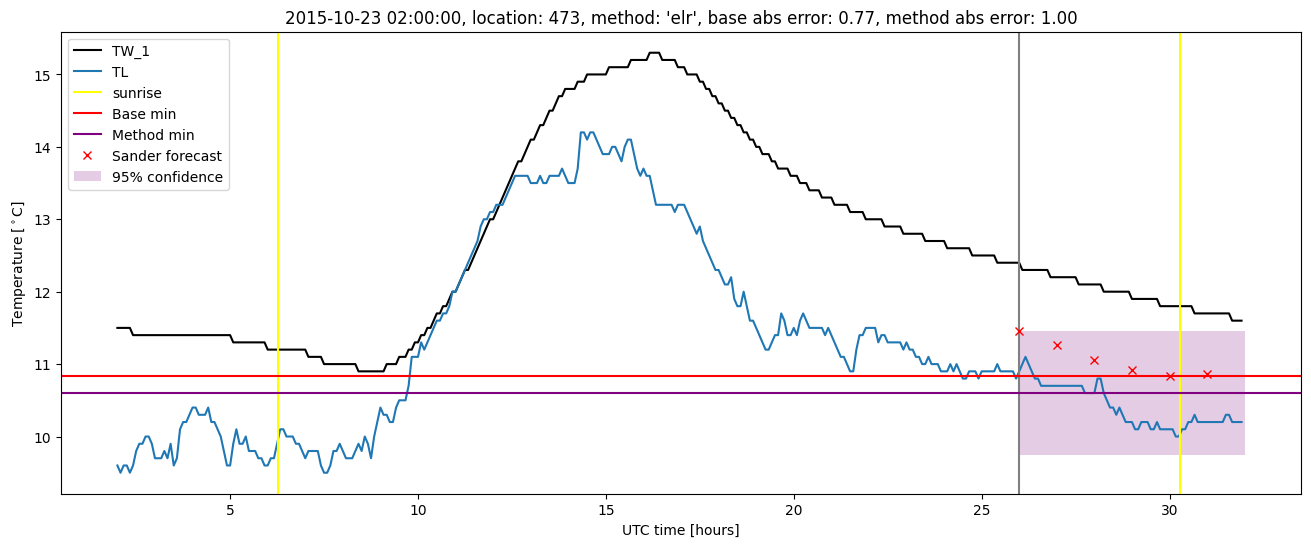
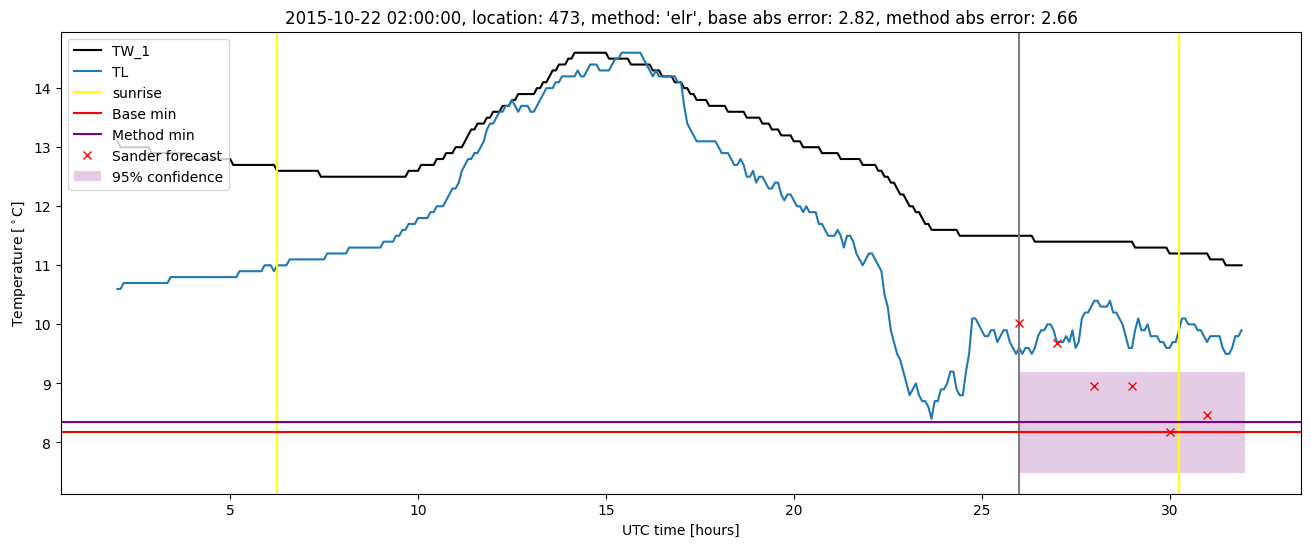
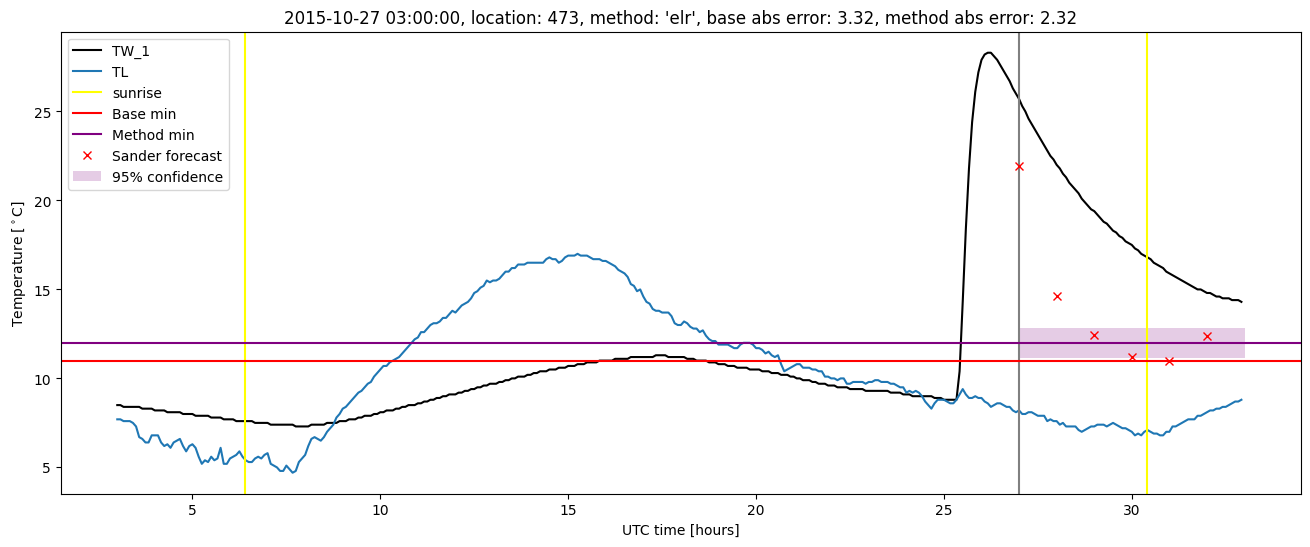
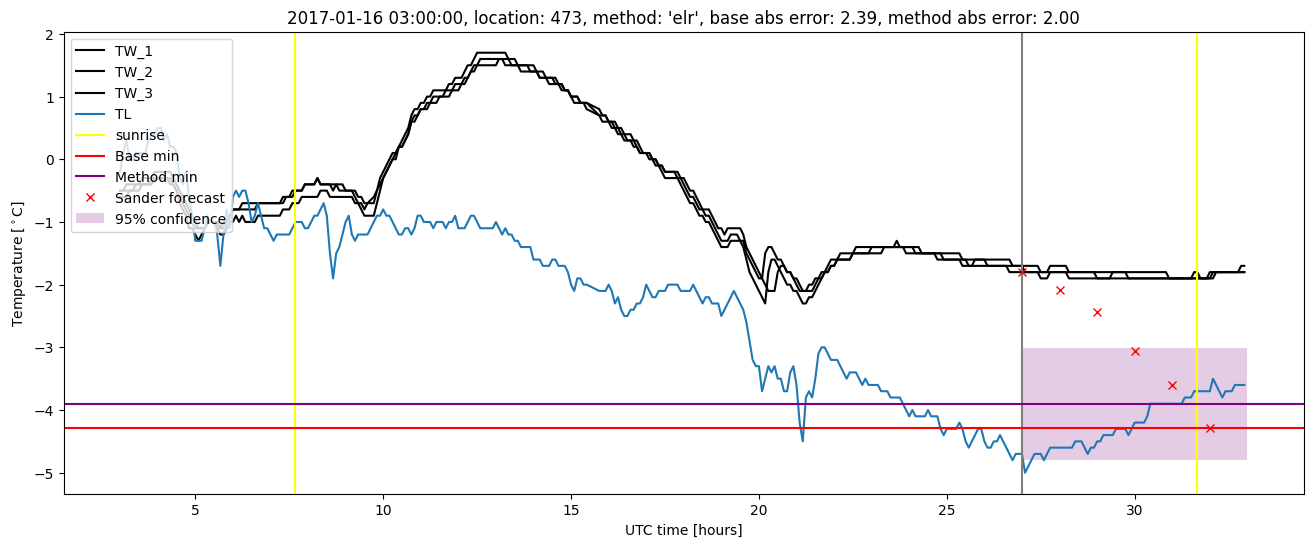
Extended logistic regression results
| names |
period |
power |
significance |
meanSquareError |
absError |
maxError |
CRPS |
IGN |
| baseline |
winter 2016 |
0.989 |
0.120 |
0.520 |
0.526 |
3.324 |
NaN |
NaN |
| elr |
winter 2016 |
0.989 |
0.080 |
0.456 |
0.505 |
2.661 |
0.536 |
4.715 |
| baseline |
winter 2017 |
0.990 |
0.075 |
0.395 |
0.466 |
2.392 |
NaN |
NaN |
| elr |
winter 2017 |
0.990 |
0.100 |
0.319 |
0.432 |
2.004 |
0.513 |
3.695 |
| baseline |
winter 2018 |
0.986 |
0.118 |
0.378 |
0.469 |
1.931 |
NaN |
NaN |
| elr |
winter 2018 |
0.972 |
0.176 |
0.316 |
0.419 |
1.825 |
0.519 |
3.601 |
| baseline |
winter 2019 |
0.993 |
0.000e+00 |
0.284 |
0.405 |
2.289 |
NaN |
NaN |
| elr |
winter 2019 |
0.993 |
0.059 |
0.262 |
0.406 |
1.445 |
0.519 |
3.579 |
| baseline |
all |
0.990 |
0.086 |
0.400 |
0.470 |
3.324 |
NaN |
NaN |
| elr |
all |
0.986 |
0.112 |
0.345 |
0.444 |
2.661 |
0.523 |
3.943 |
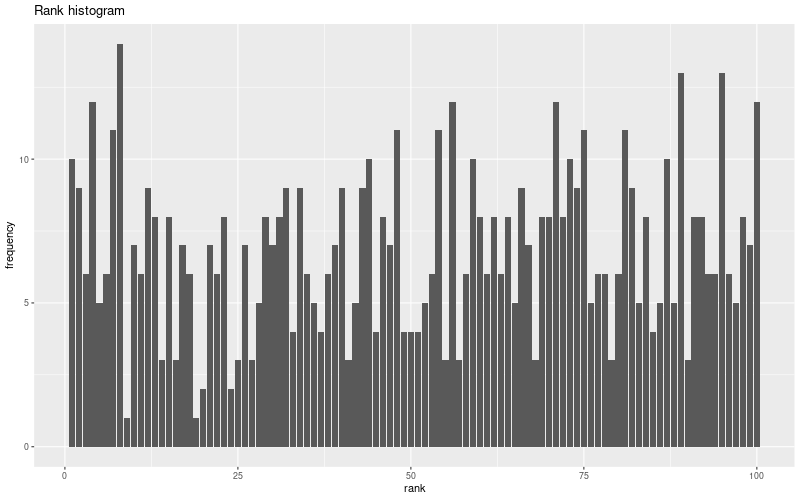
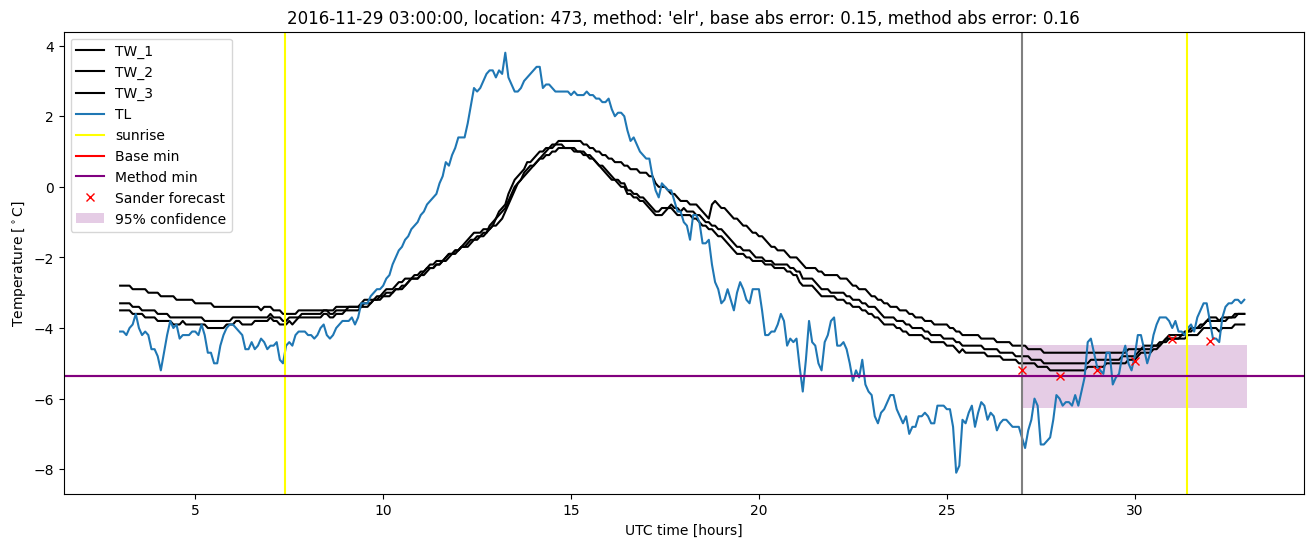
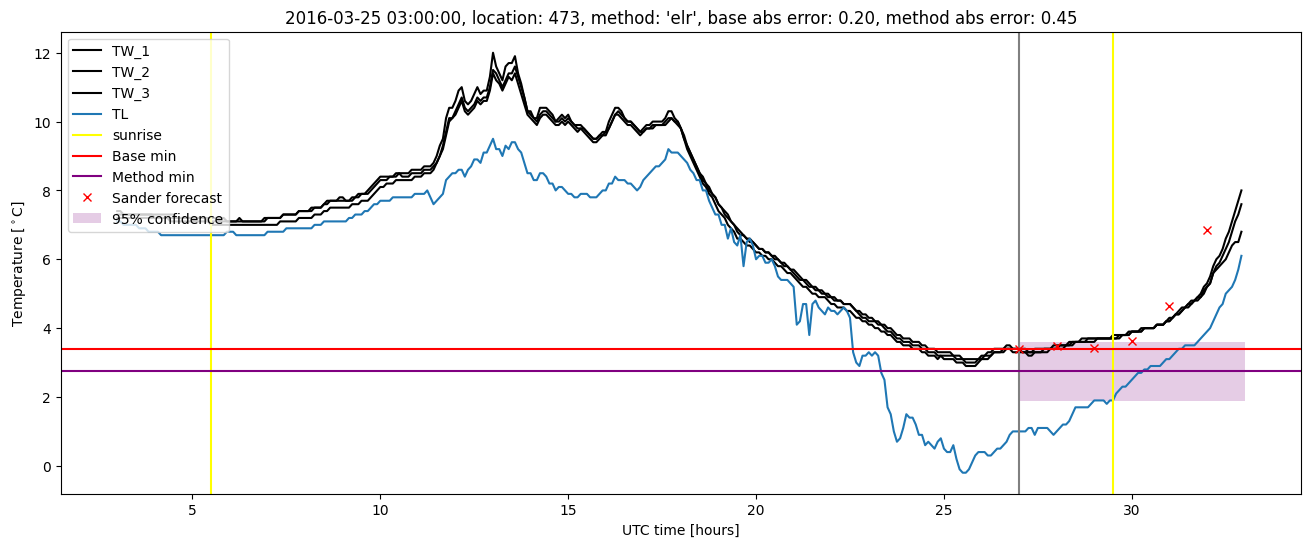
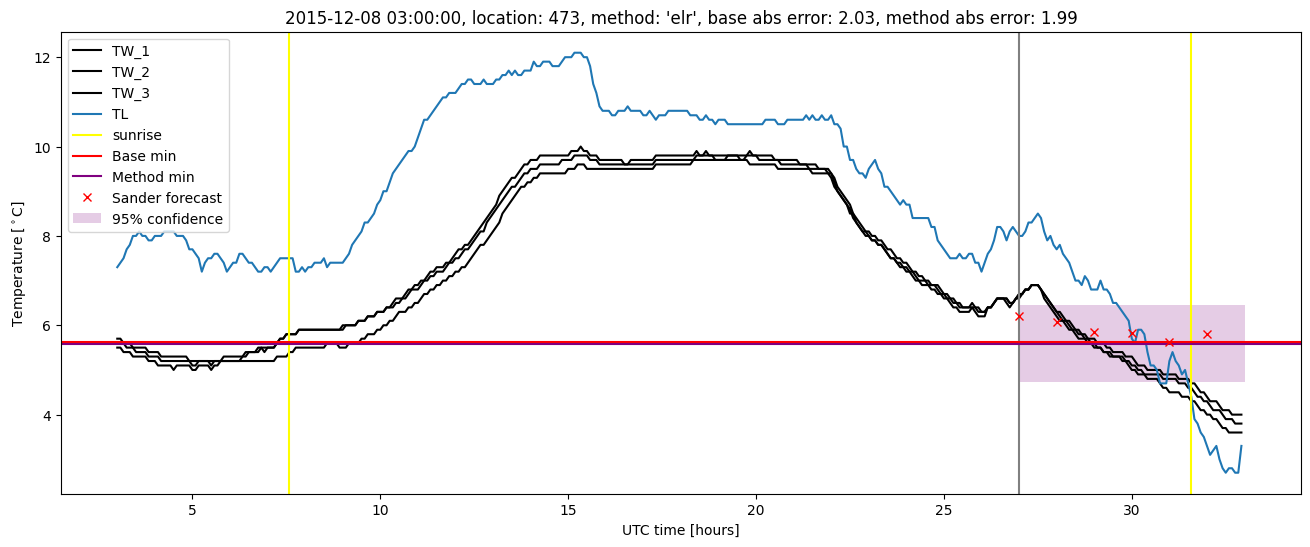
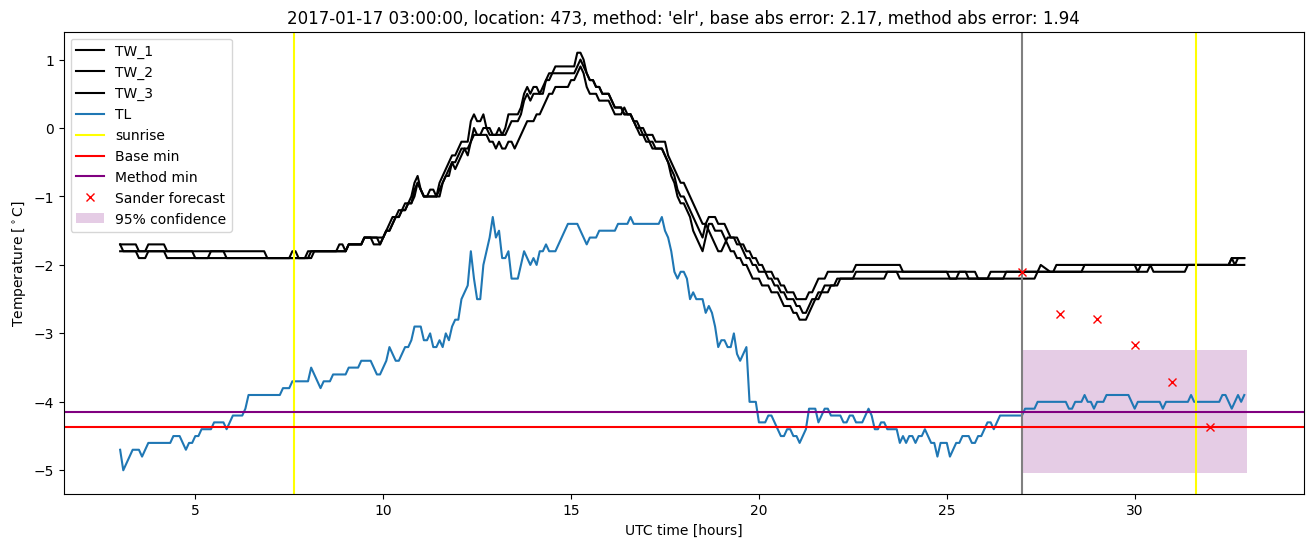
Extended logistic regression plots