GMS location: 472
Random forest results
| names |
period |
power |
significance |
meanSquareError |
absError |
maxError |
CRPS |
IGN |
| baseline |
winter 2016 |
0.988 |
0.077 |
0.366 |
0.457 |
1.590 |
NaN |
NaN |
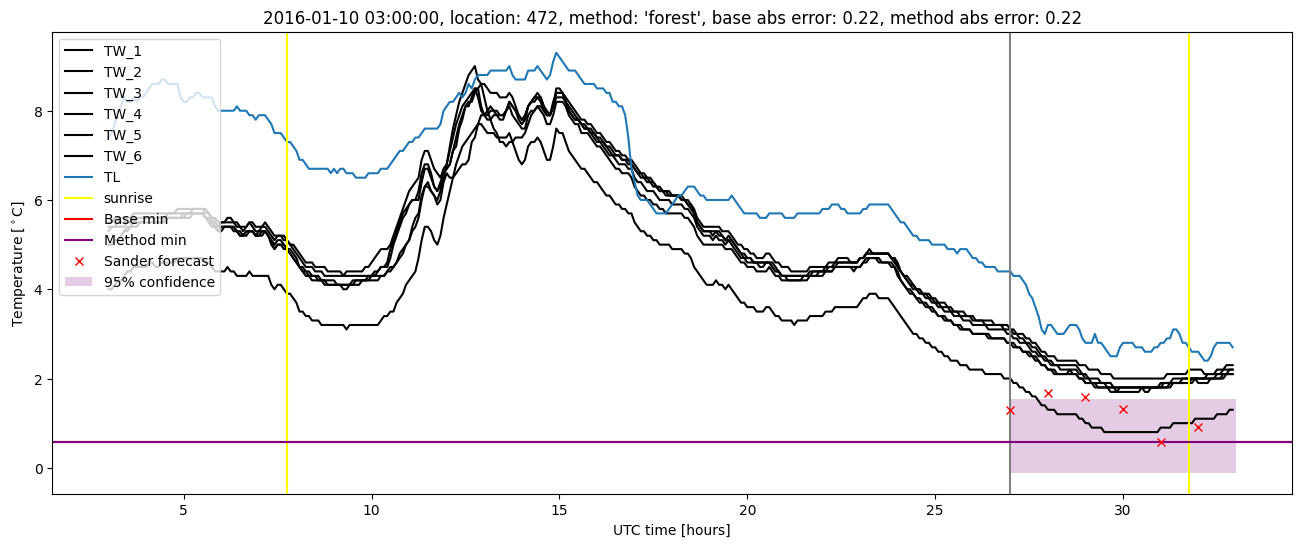
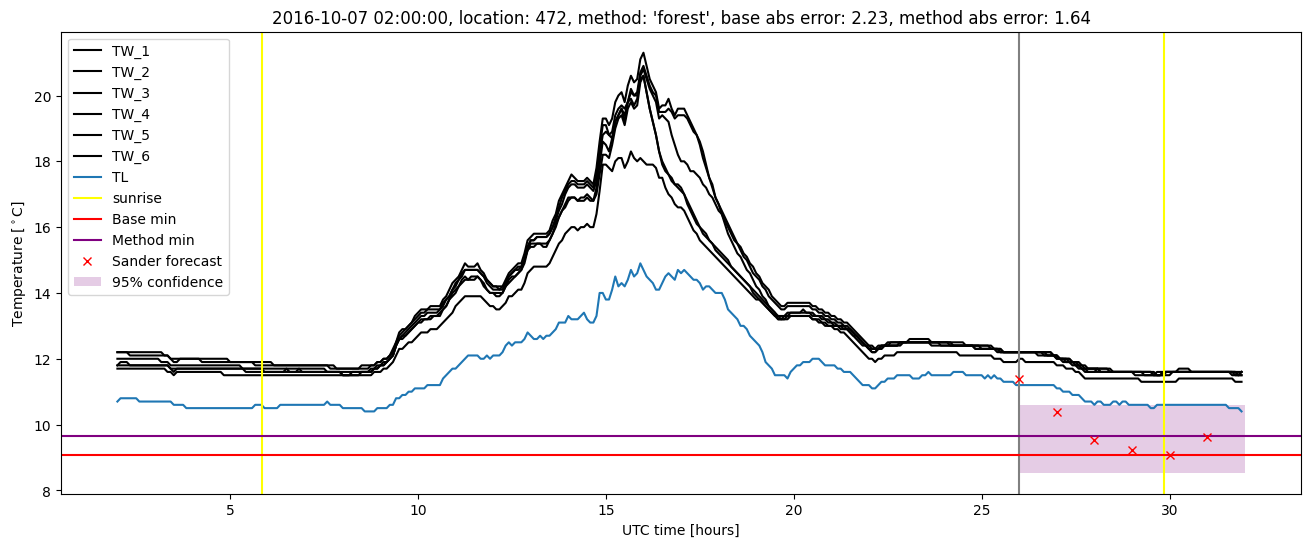
| forest |
winter 2016 |
0.982 |
0.115 |
0.303 |
0.415 |
1.483 |
0.473 |
4.789 |
| baseline |
winter 2017 |
0.973 |
0.000e+00 |
0.430 |
0.471 |
2.384 |
NaN |
NaN |
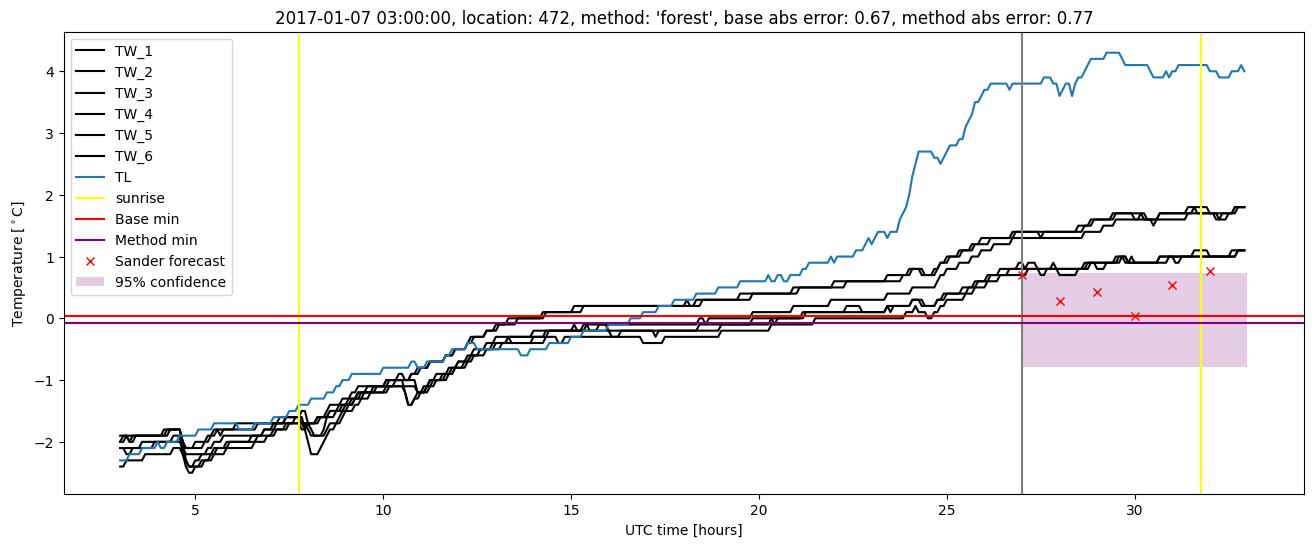
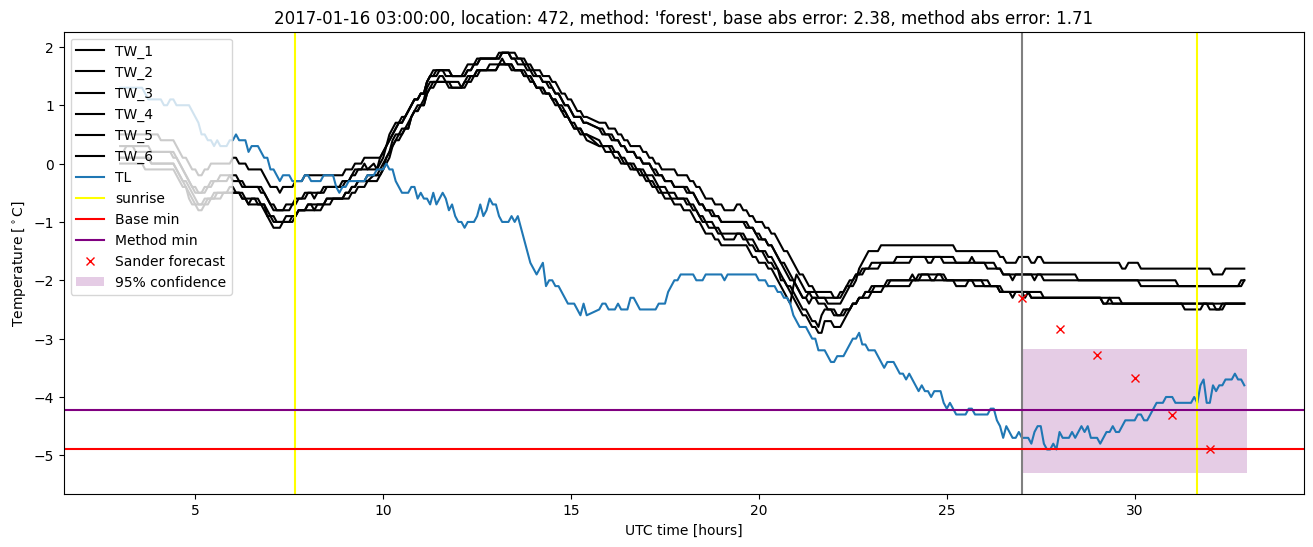
| forest |
winter 2017 |
0.955 |
0.000e+00 |
0.326 |
0.413 |
1.715 |
0.480 |
5.691 |
| baseline |
winter 2018 |
0.993 |
0.158 |
0.259 |
0.374 |
2.134 |
NaN |
NaN |
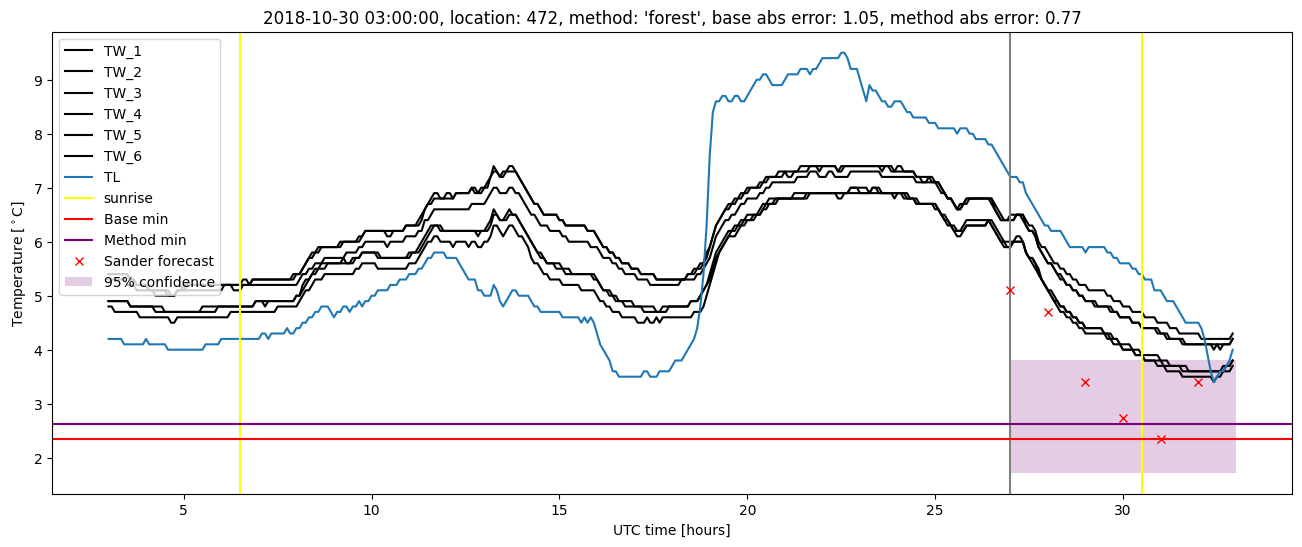
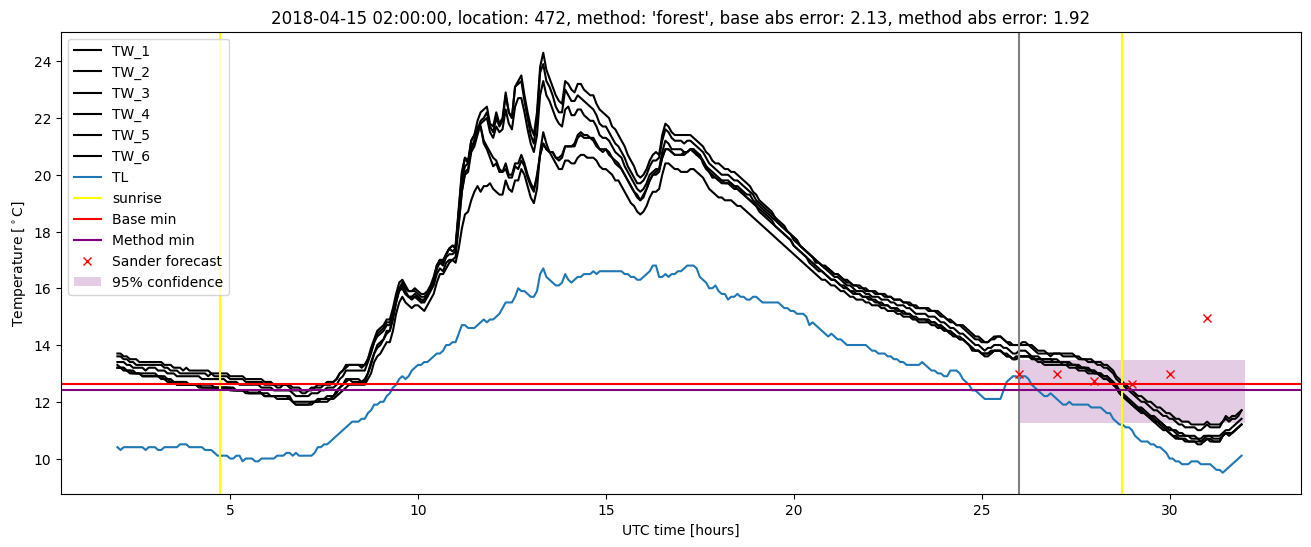
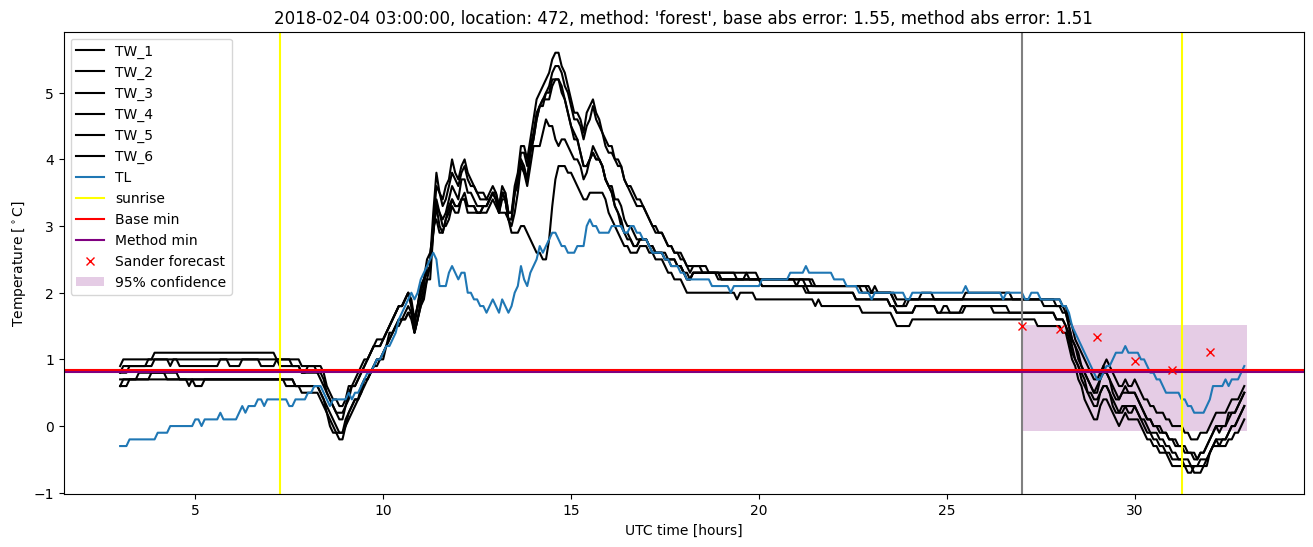
| forest |
winter 2018 |
0.993 |
0.132 |
0.237 |
0.372 |
1.916 |
0.481 |
3.737 |
| baseline |
winter 2019 |
0.980 |
0.000e+00 |
0.248 |
0.371 |
1.704 |
NaN |
NaN |
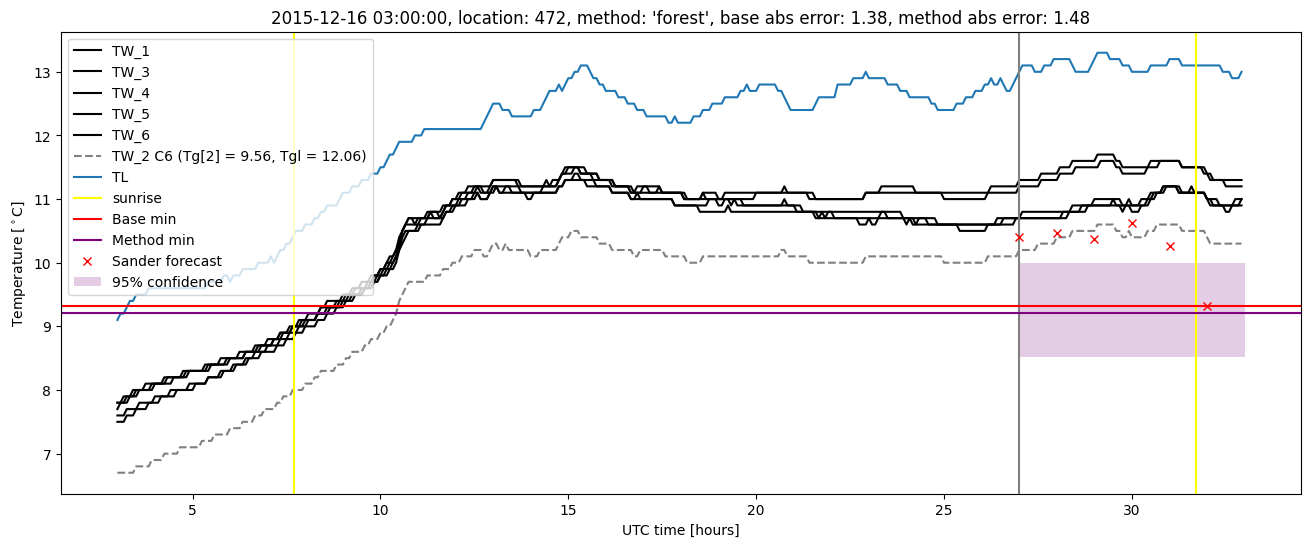
| forest |
winter 2019 |
0.993 |
0.000e+00 |
0.181 |
0.322 |
1.320 |
0.461 |
3.759 |
| baseline |
all |
0.984 |
0.067 |
0.324 |
0.418 |
2.384 |
NaN |
NaN |
| forest |
all |
0.982 |
0.067 |
0.262 |
0.381 |
1.916 |
0.474 |
4.463 |
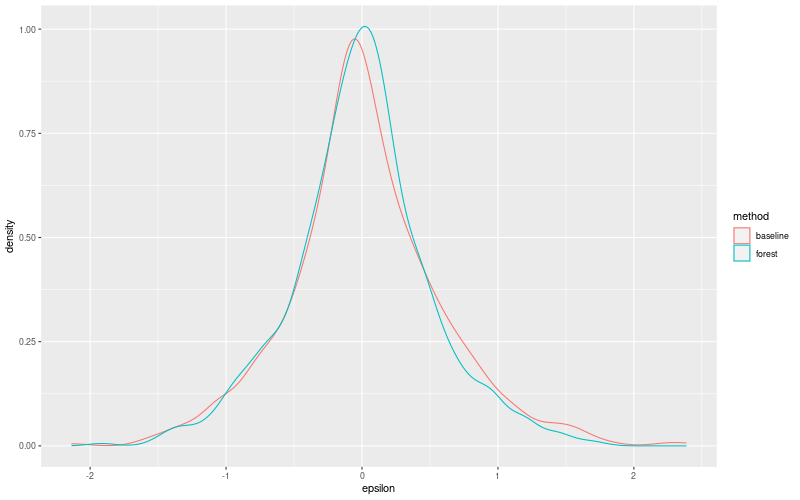
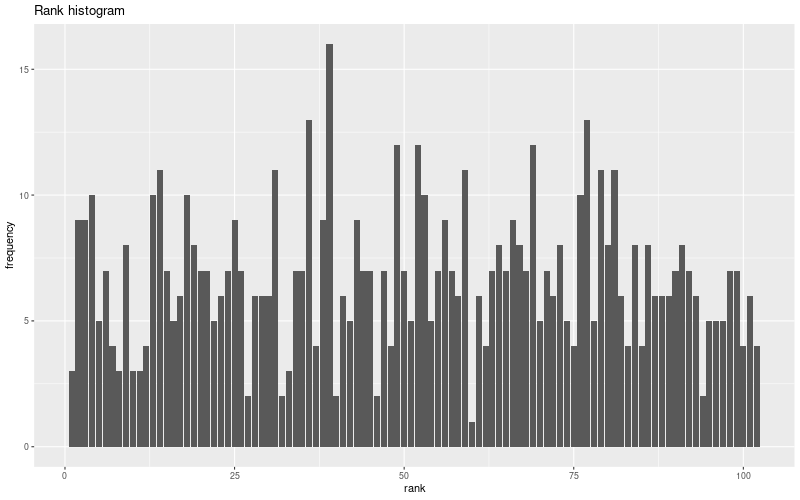
Random forest plots
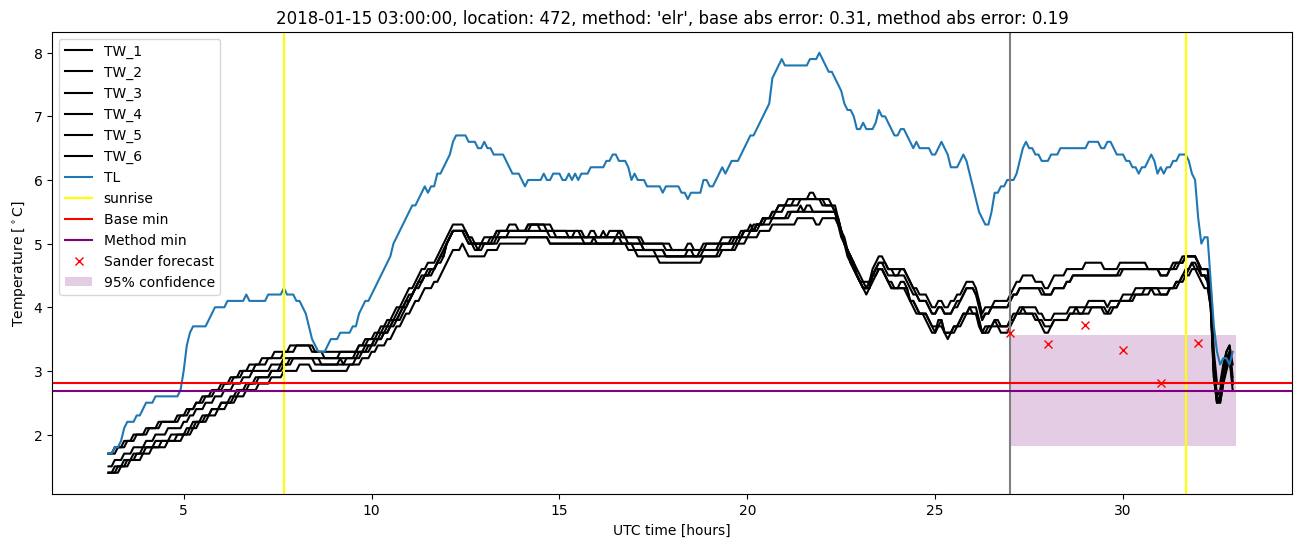
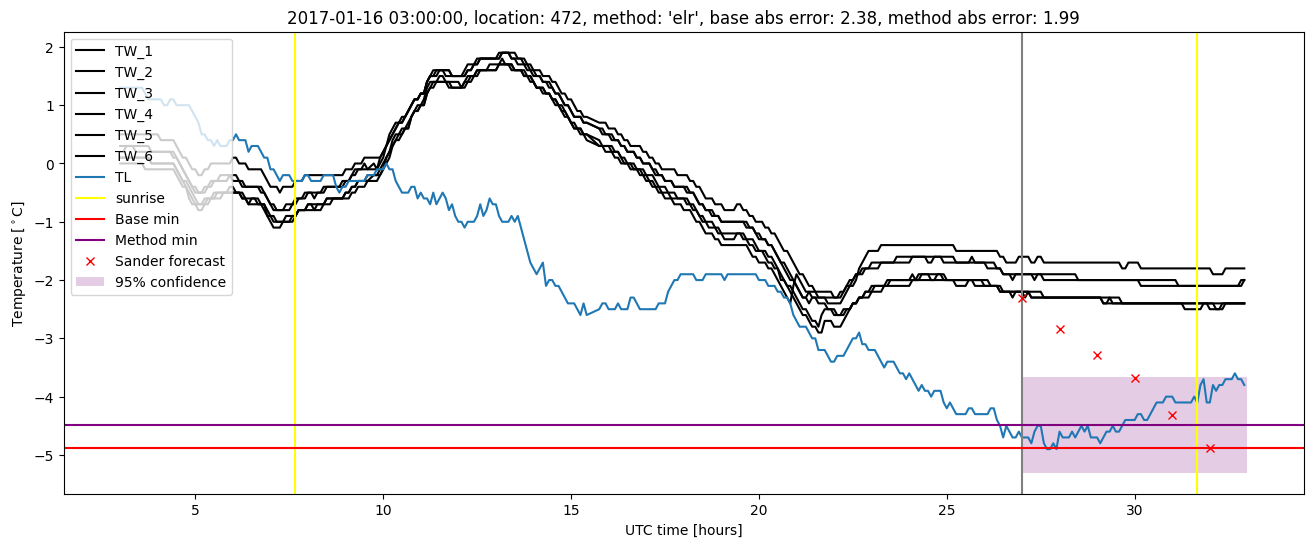
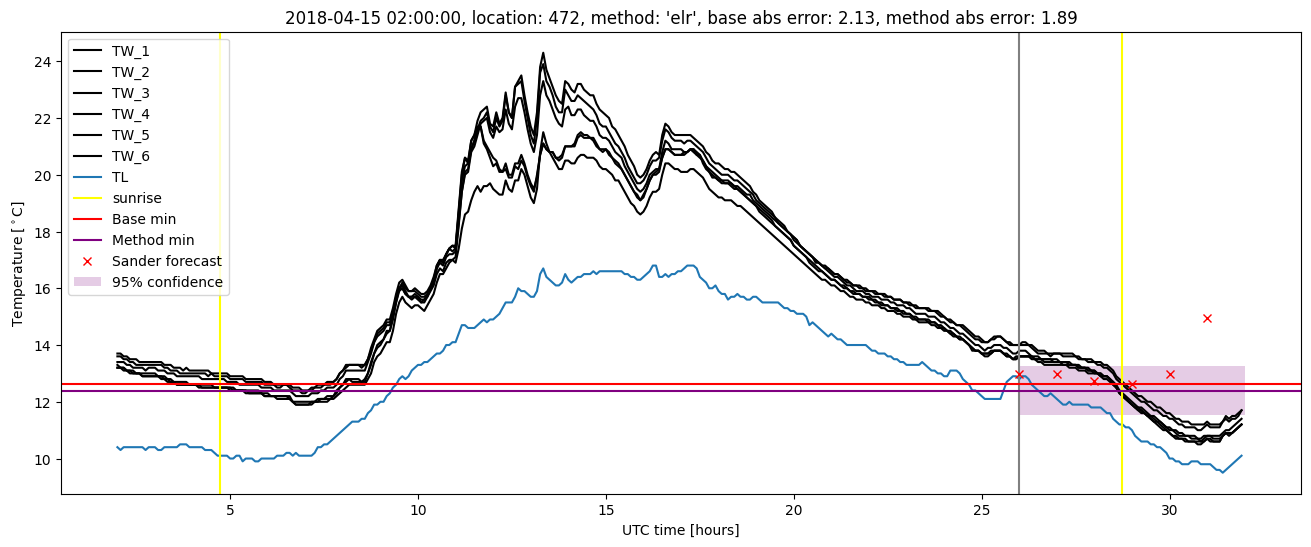
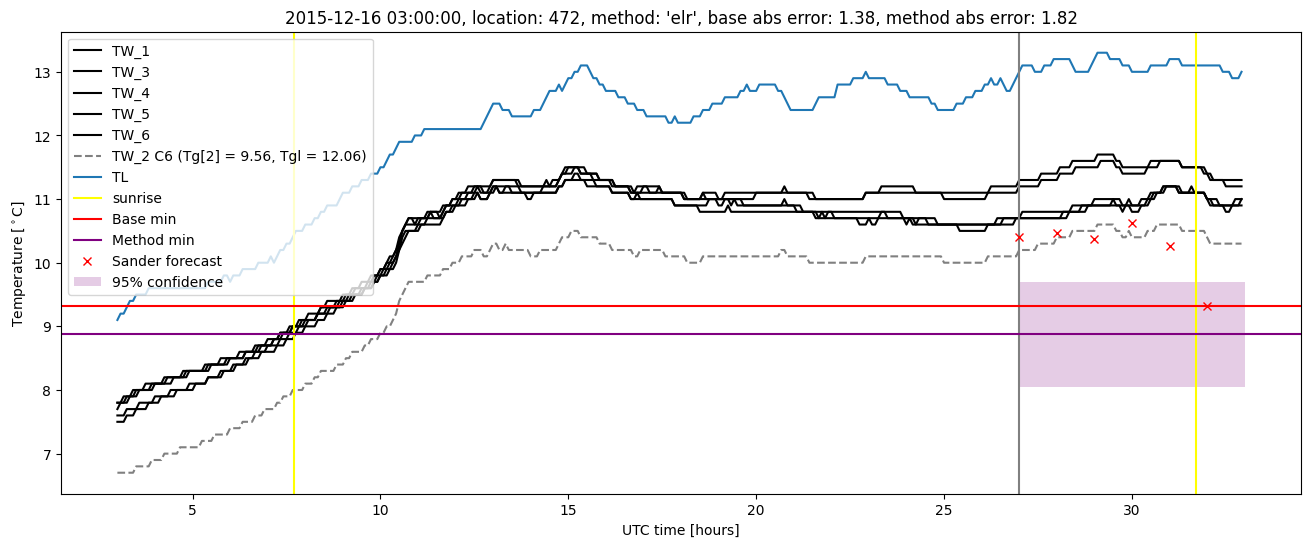
Extended logistic regression results
| names |
period |
power |
significance |
meanSquareError |
absError |
maxError |
CRPS |
IGN |
| baseline |
winter 2016 |
0.988 |
0.077 |
0.366 |
0.457 |
1.590 |
NaN |
NaN |
| elr |
winter 2016 |
0.969 |
0.115 |
0.316 |
0.433 |
1.820 |
0.546 |
5.377 |
| baseline |
winter 2017 |
0.973 |
0.000e+00 |
0.430 |
0.471 |
2.384 |
NaN |
NaN |
| elr |
winter 2017 |
0.955 |
0.000e+00 |
0.344 |
0.430 |
1.990 |
0.532 |
5.378 |
| baseline |
winter 2018 |
0.993 |
0.158 |
0.259 |
0.374 |
2.134 |
NaN |
NaN |
| elr |
winter 2018 |
0.993 |
0.158 |
0.262 |
0.398 |
1.895 |
0.562 |
4.724 |
| baseline |
winter 2019 |
0.980 |
0.000e+00 |
0.248 |
0.371 |
1.704 |
NaN |
NaN |
| elr |
winter 2019 |
0.993 |
0.000e+00 |
0.204 |
0.350 |
1.310 |
0.504 |
3.588 |
| baseline |
all |
0.984 |
0.067 |
0.324 |
0.418 |
2.384 |
NaN |
NaN |
| elr |
all |
0.979 |
0.075 |
0.281 |
0.403 |
1.990 |
0.537 |
4.777 |
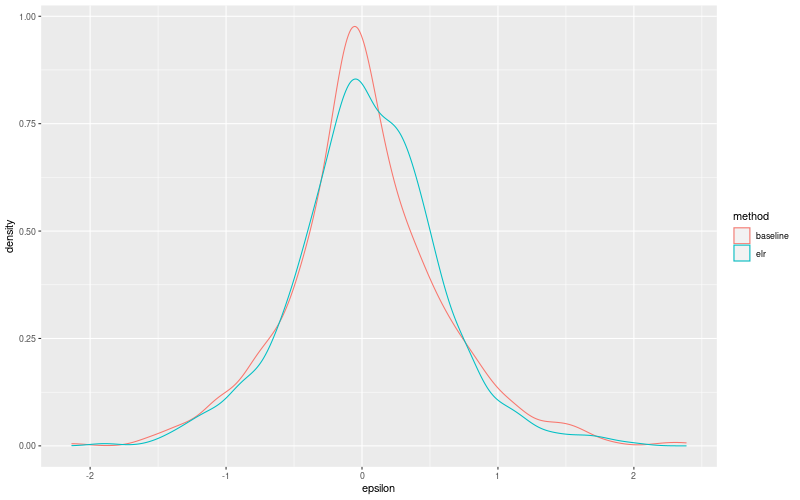
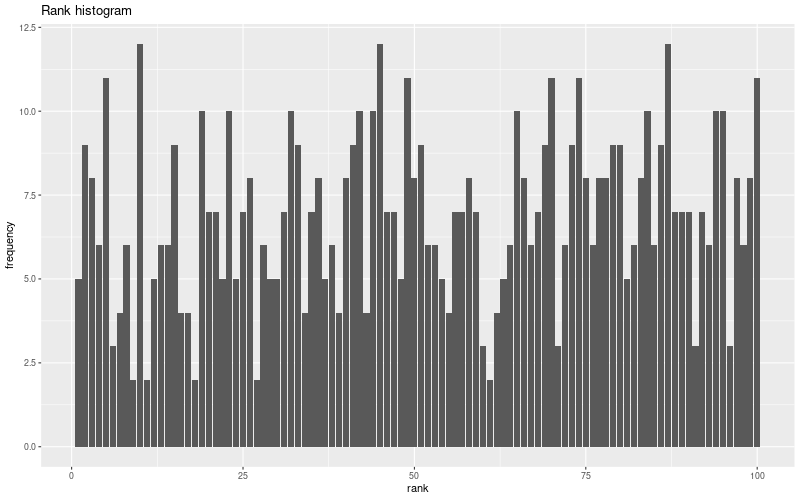
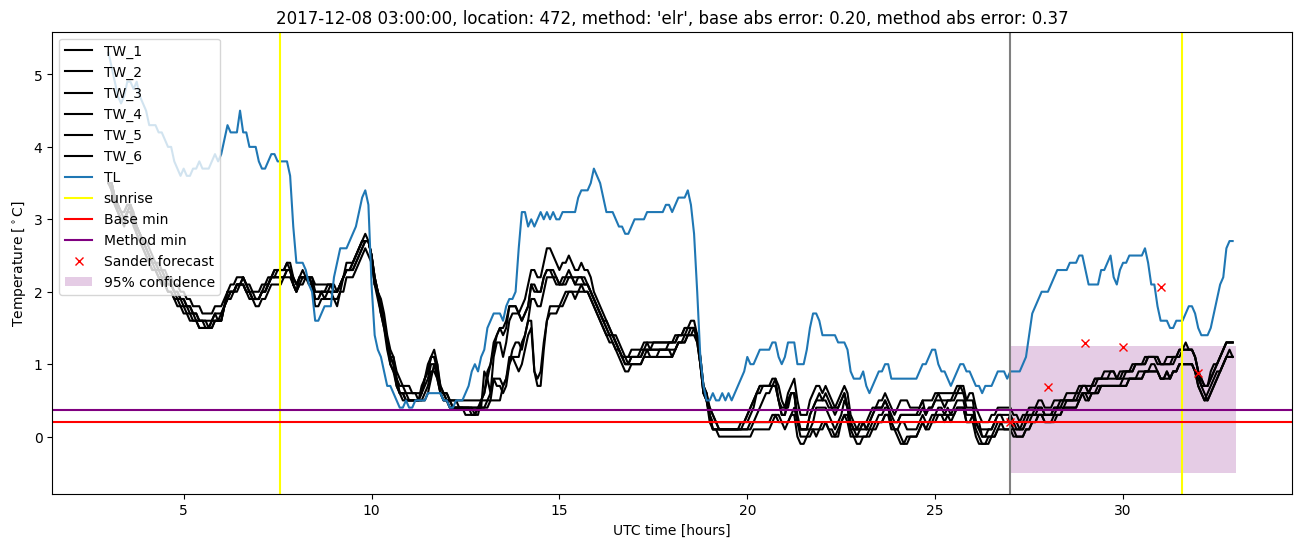
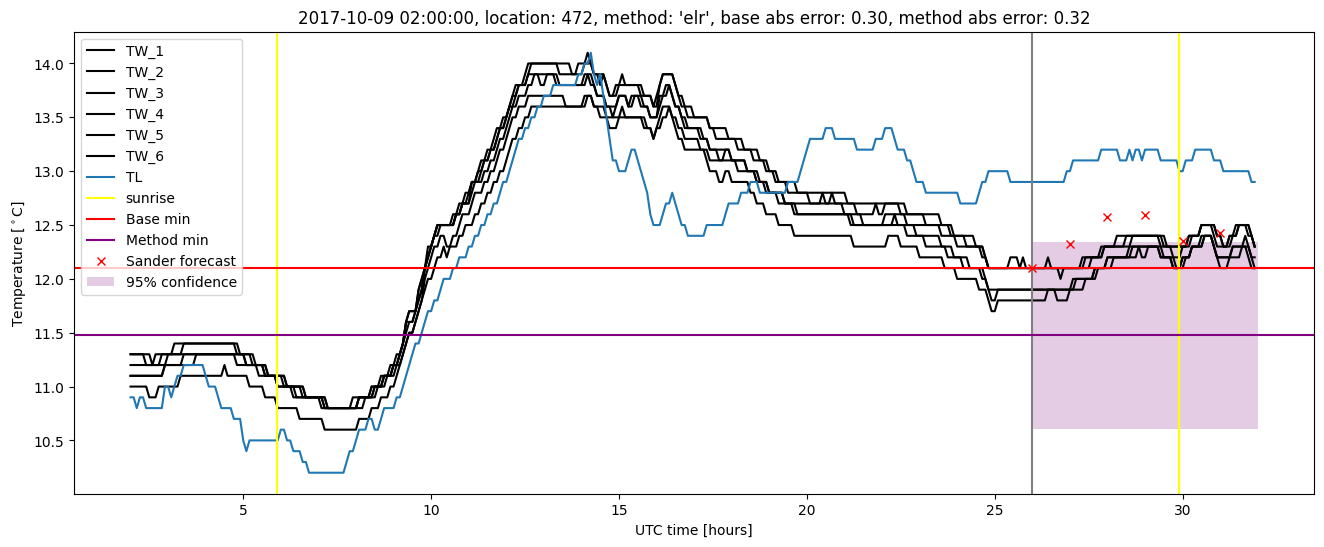
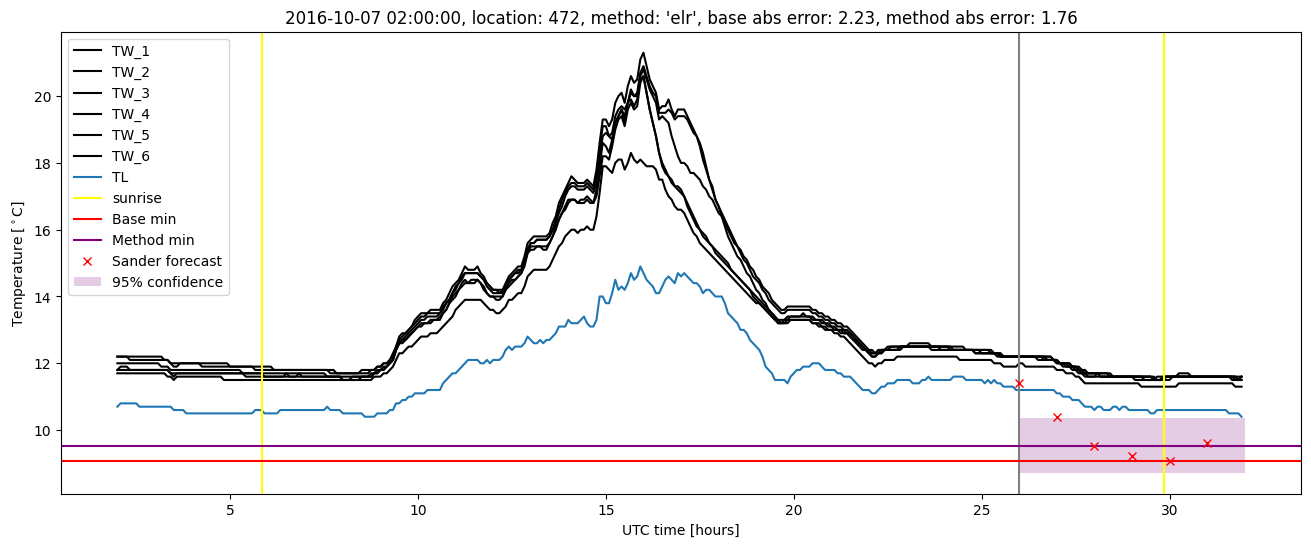
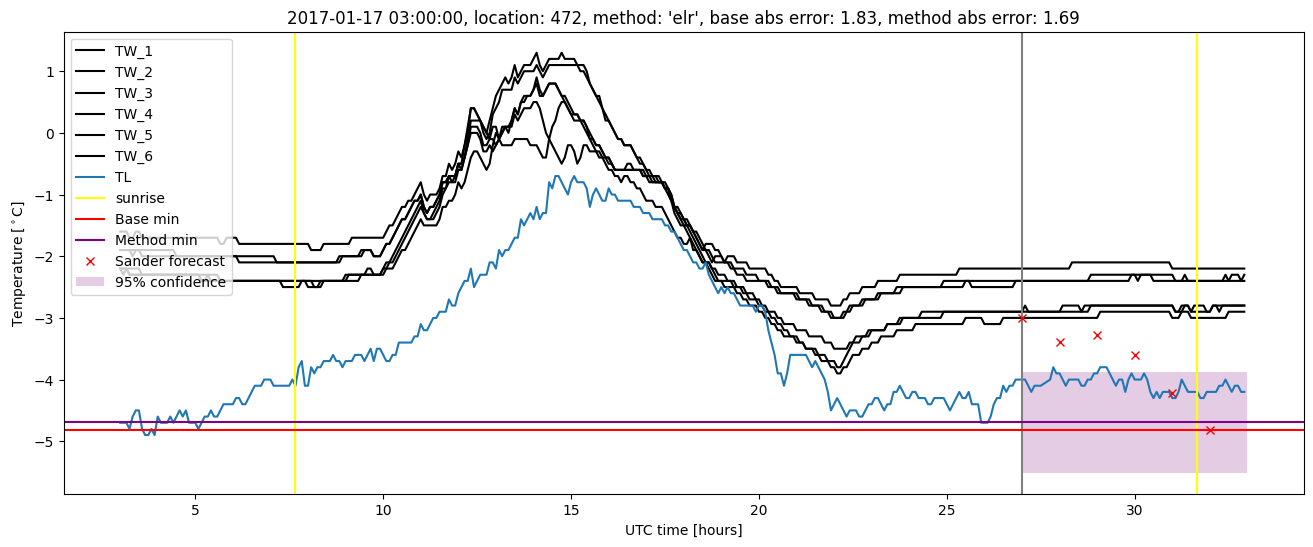
Extended logistic regression plots