GMS location: 471
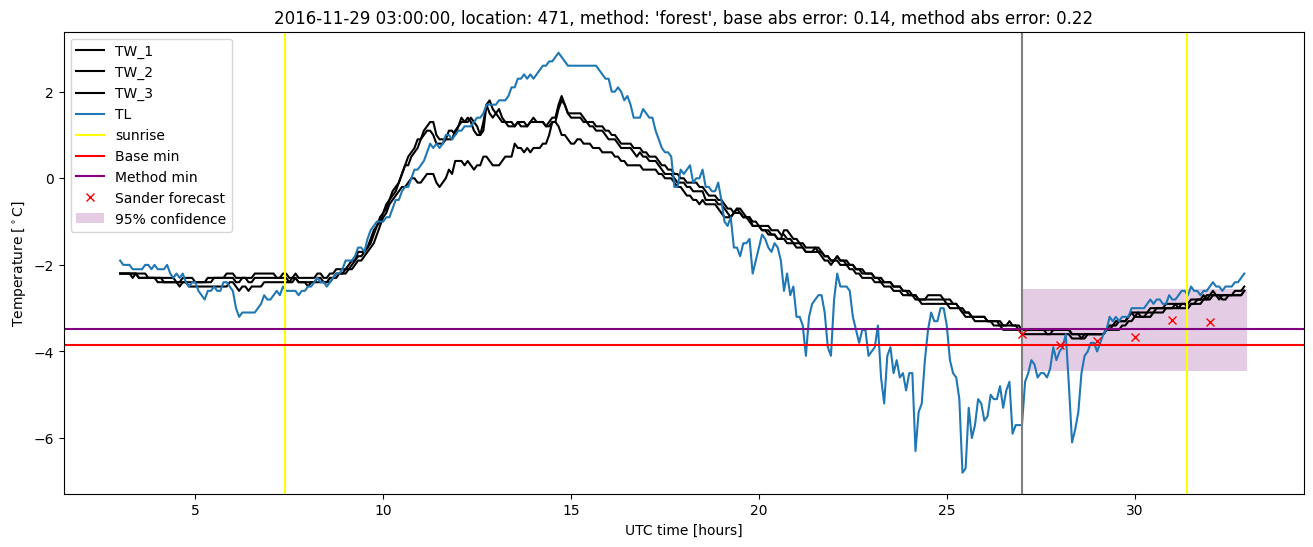
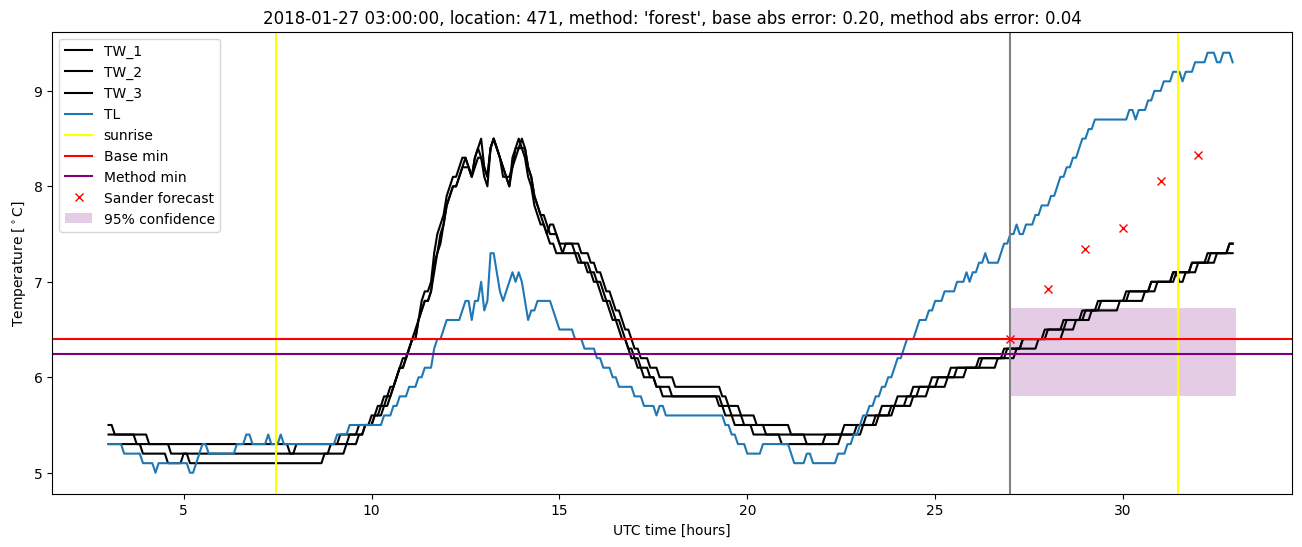
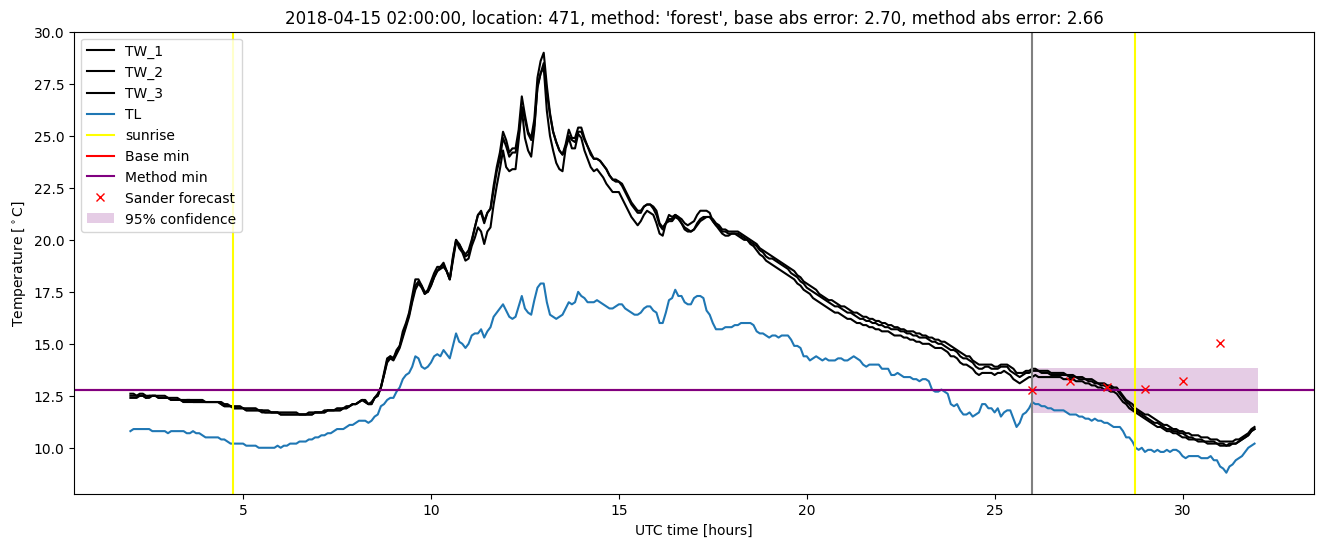
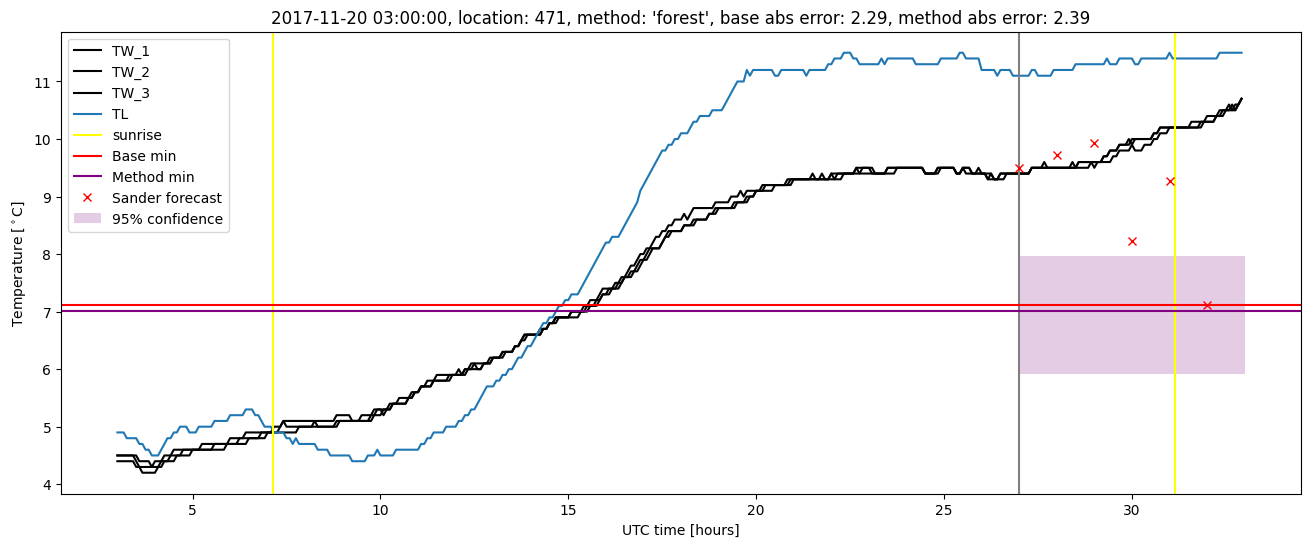
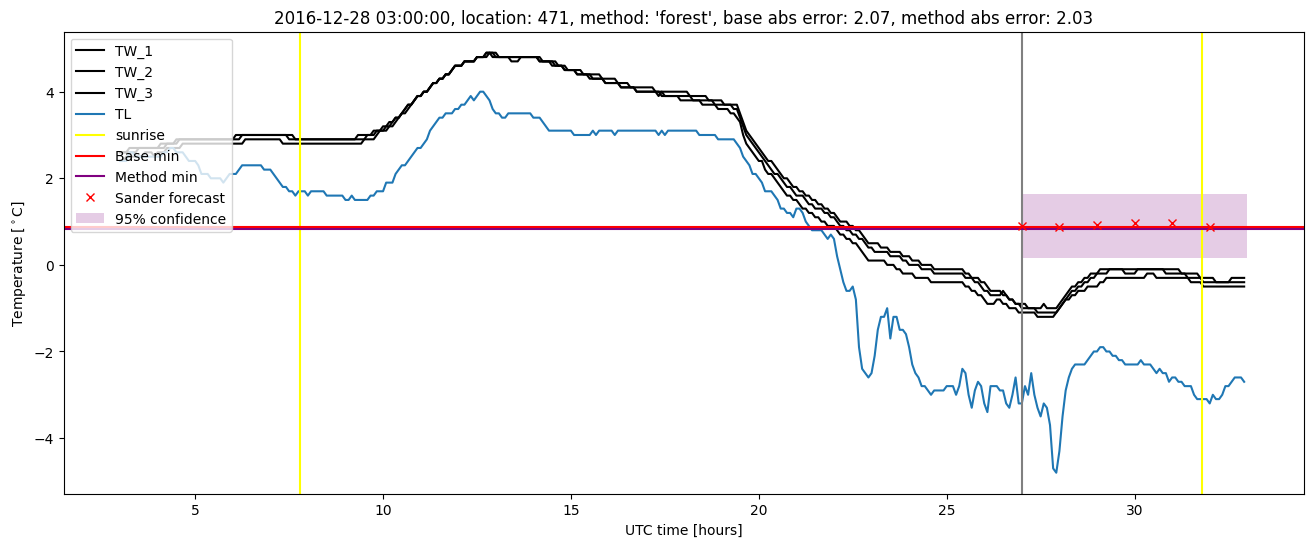
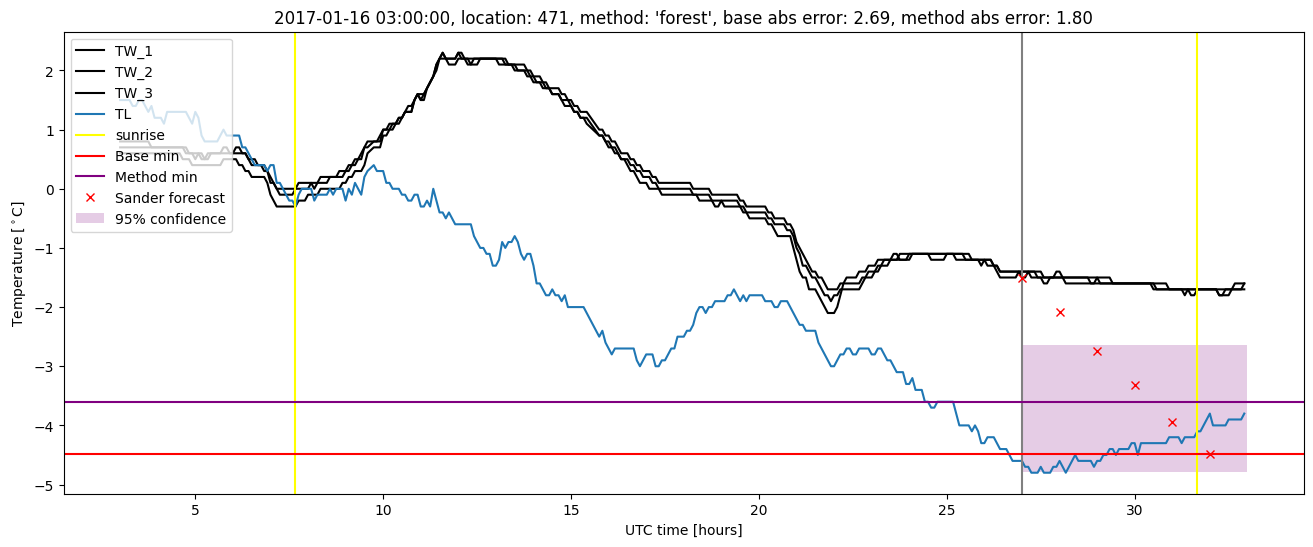
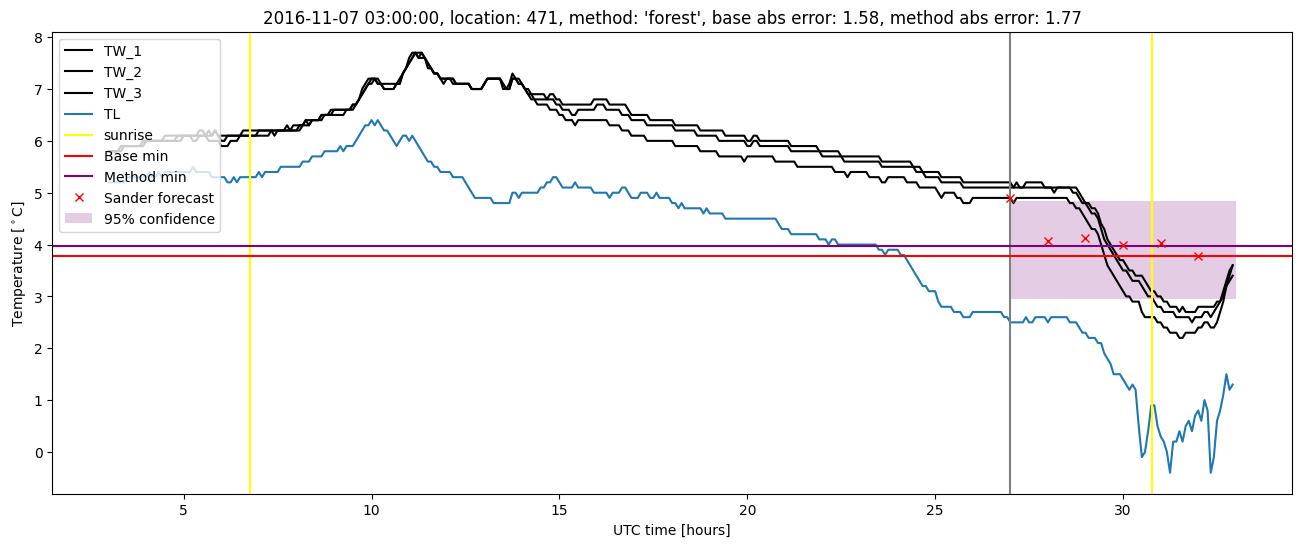
Random forest results
| names |
period |
power |
significance |
meanSquareError |
absError |
maxError |
CRPS |
IGN |
| baseline |
winter 2016 |
0.994 |
0.087 |
0.365 |
0.447 |
2.114 |
NaN |
NaN |
| forest |
winter 2016 |
0.989 |
0.130 |
0.277 |
0.393 |
1.654 |
0.454 |
2.817 |
| baseline |
winter 2017 |
0.974 |
0.081 |
0.483 |
0.503 |
2.690 |
NaN |
NaN |
| forest |
winter 2017 |
0.966 |
0.081 |
0.341 |
0.419 |
2.029 |
0.443 |
3.219 |
| baseline |
winter 2018 |
0.980 |
0.065 |
0.336 |
0.418 |
2.696 |
NaN |
NaN |
| forest |
winter 2018 |
0.987 |
0.065 |
0.326 |
0.398 |
2.655 |
0.440 |
2.580 |
| baseline |
winter 2019 |
0.986 |
0.067 |
0.310 |
0.409 |
2.092 |
NaN |
NaN |
| forest |
winter 2019 |
0.993 |
0.067 |
0.205 |
0.345 |
1.509 |
0.440 |
2.613 |
| baseline |
all |
0.985 |
0.075 |
0.371 |
0.443 |
2.696 |
NaN |
NaN |
| forest |
all |
0.985 |
0.085 |
0.287 |
0.389 |
2.655 |
0.445 |
2.797 |
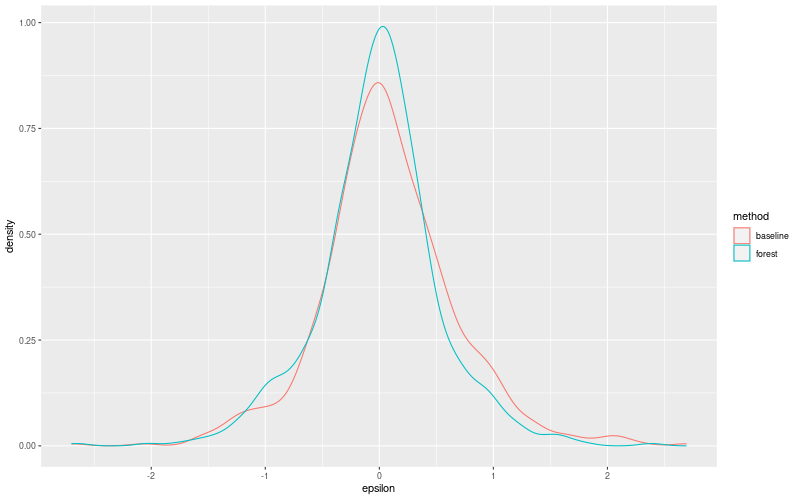
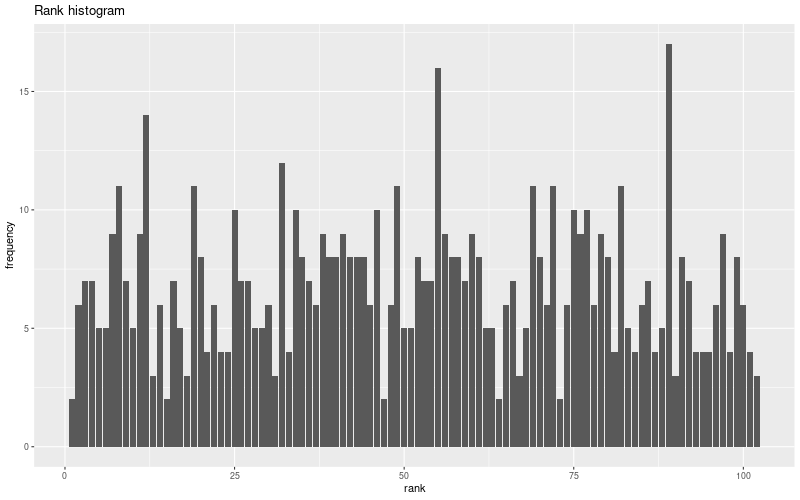
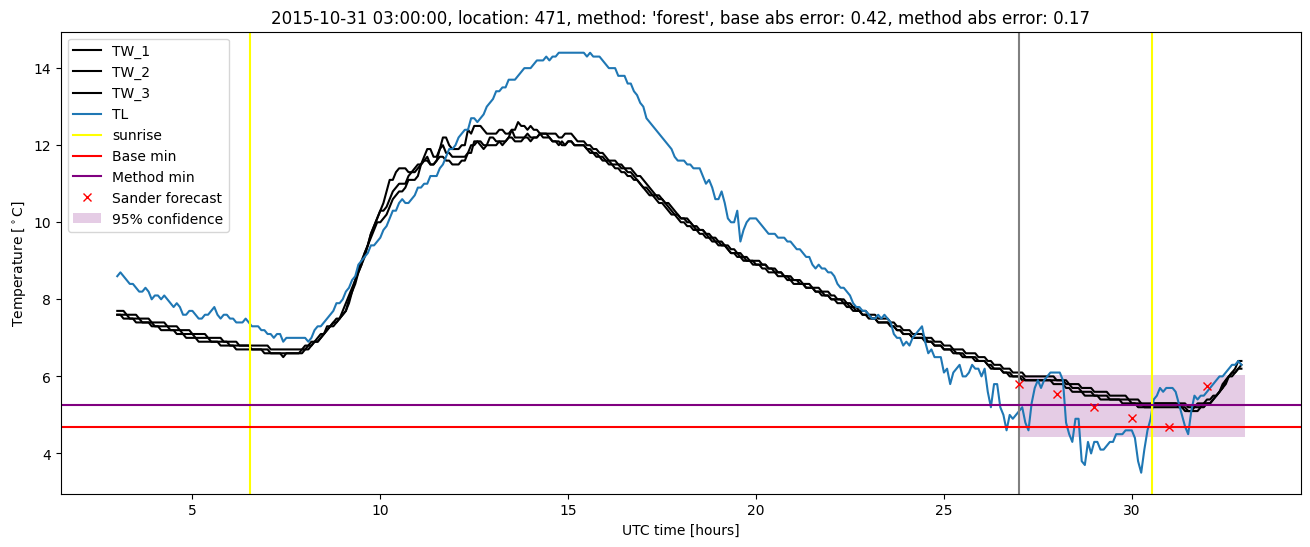
Random forest plots
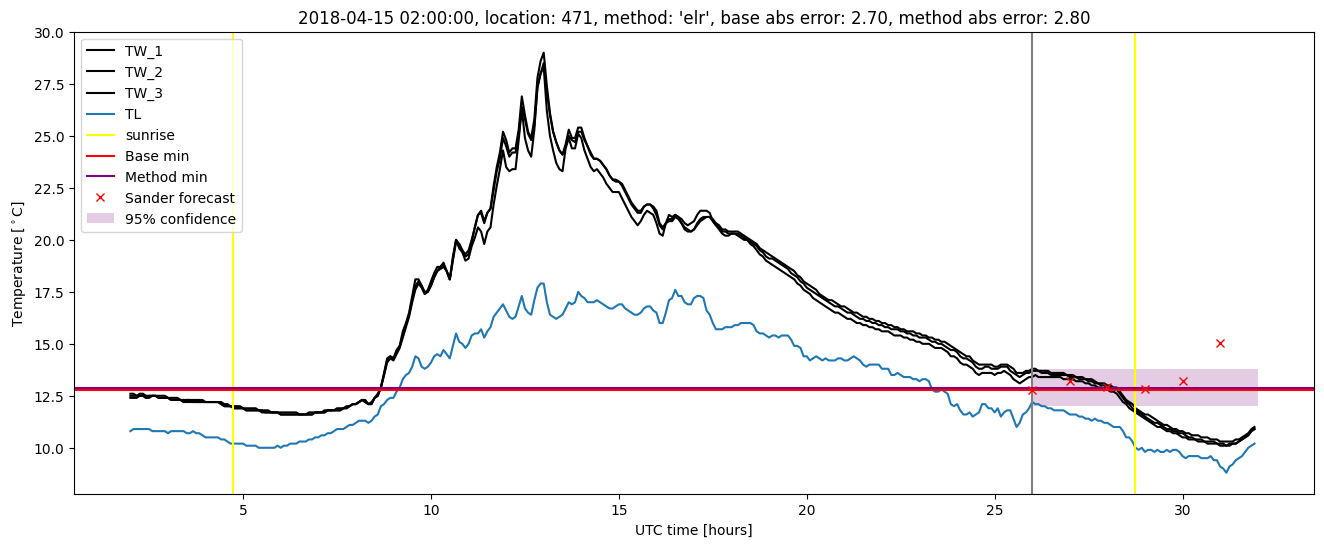
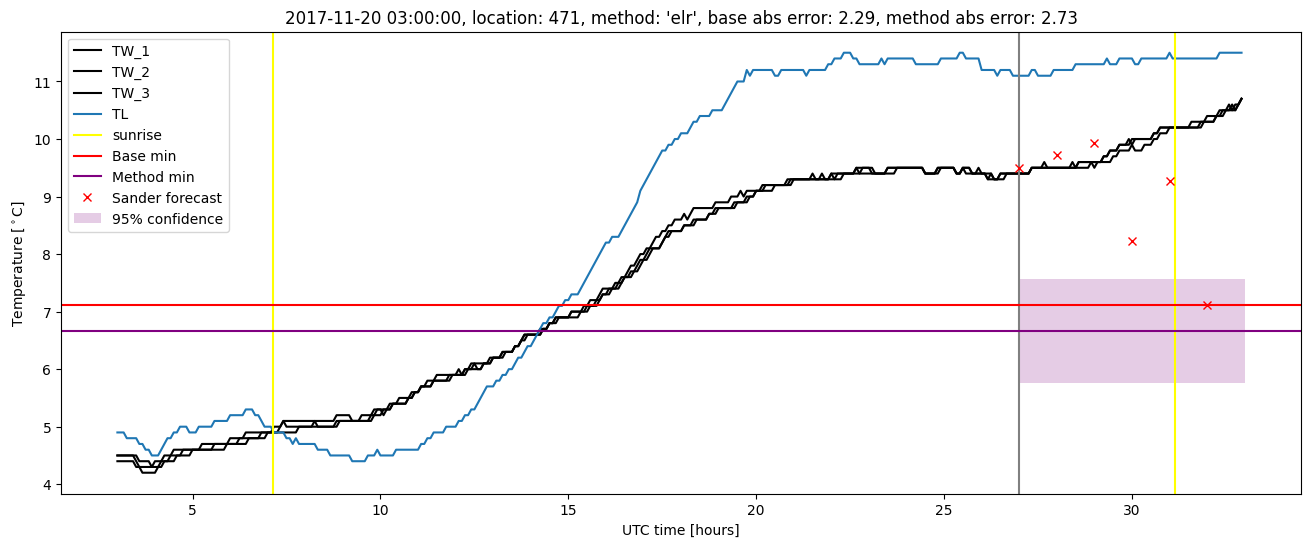
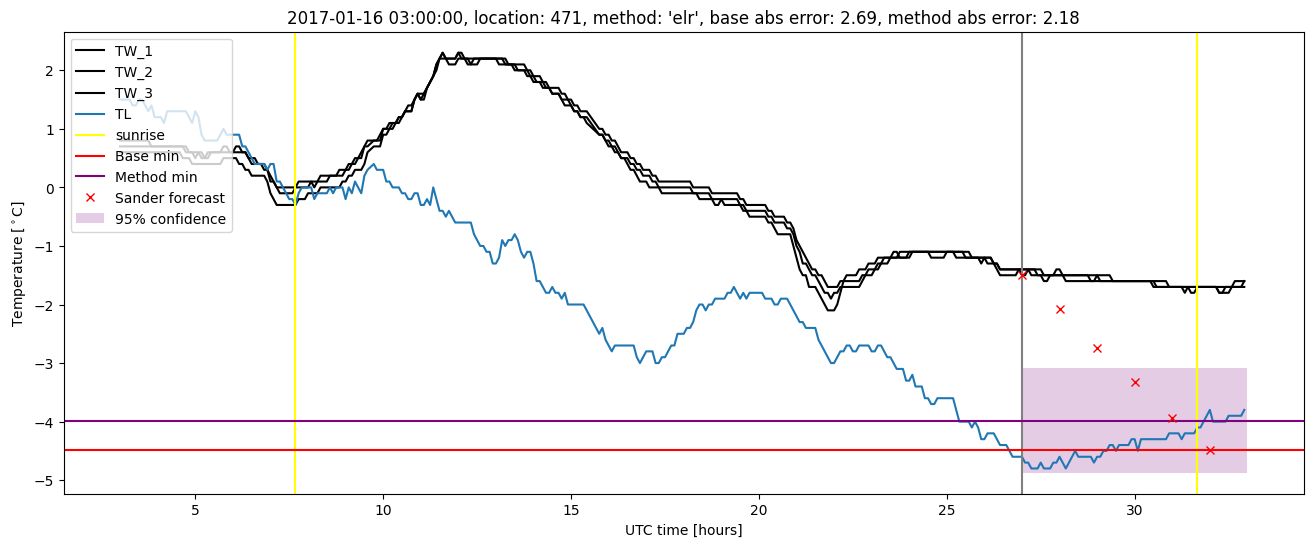
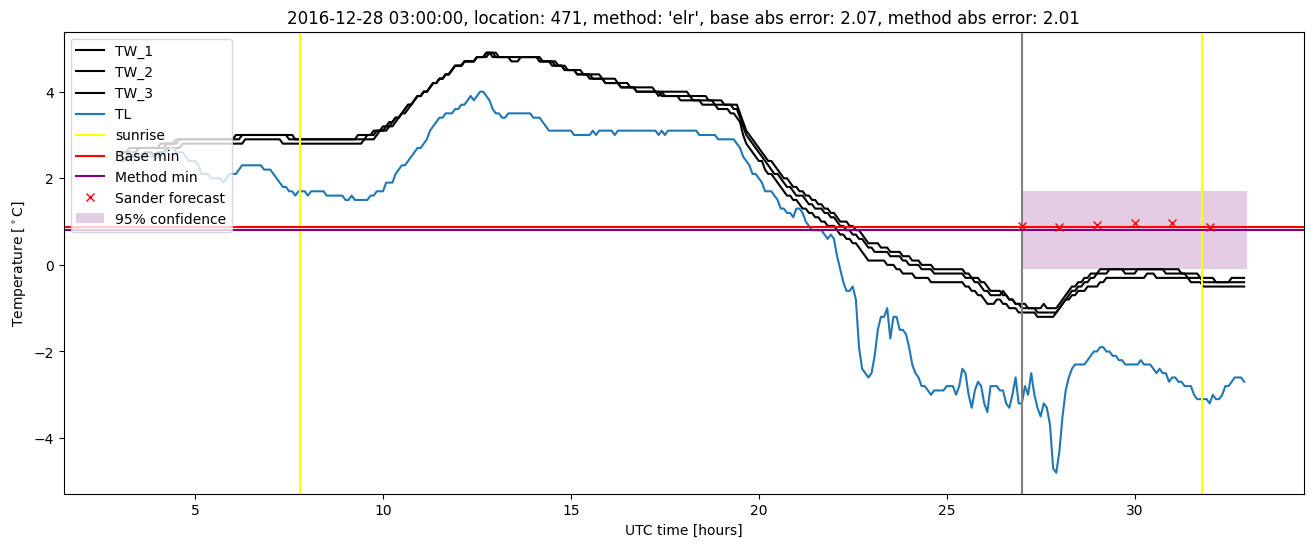
Extended logistic regression results
| names |
period |
power |
significance |
meanSquareError |
absError |
maxError |
CRPS |
IGN |
| baseline |
winter 2016 |
0.994 |
0.087 |
0.365 |
0.447 |
2.114 |
NaN |
NaN |
| elr |
winter 2016 |
0.989 |
0.130 |
0.329 |
0.448 |
1.886 |
0.513 |
3.590 |
| baseline |
winter 2017 |
0.974 |
0.081 |
0.483 |
0.503 |
2.690 |
NaN |
NaN |
| elr |
winter 2017 |
0.983 |
0.081 |
0.381 |
0.439 |
2.182 |
0.468 |
3.059 |
| baseline |
winter 2018 |
0.980 |
0.065 |
0.336 |
0.418 |
2.696 |
NaN |
NaN |
| elr |
winter 2018 |
0.993 |
0.065 |
0.339 |
0.410 |
2.796 |
0.495 |
3.324 |
| baseline |
winter 2019 |
0.986 |
0.067 |
0.310 |
0.409 |
2.092 |
NaN |
NaN |
| elr |
winter 2019 |
0.993 |
0.067 |
0.220 |
0.364 |
1.336 |
0.480 |
2.645 |
| baseline |
all |
0.985 |
0.075 |
0.371 |
0.443 |
2.696 |
NaN |
NaN |
| elr |
all |
0.990 |
0.085 |
0.318 |
0.416 |
2.796 |
0.491 |
3.184 |
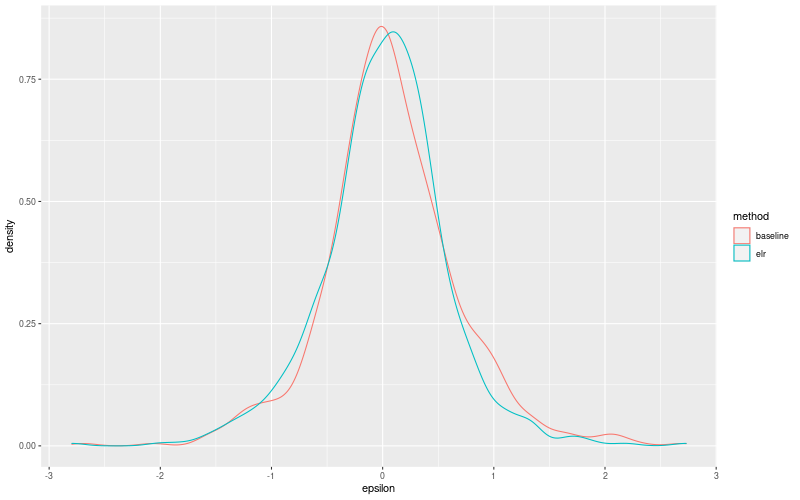
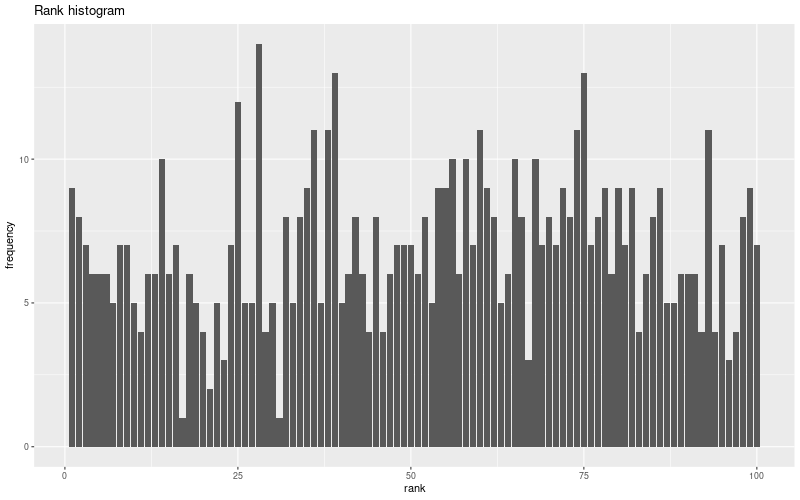
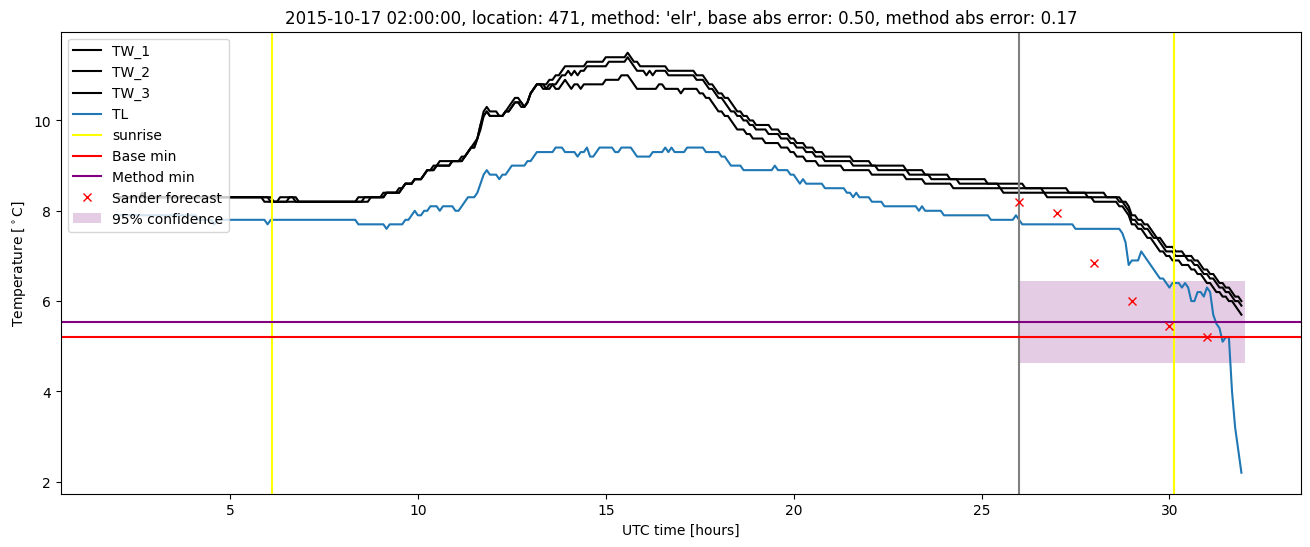
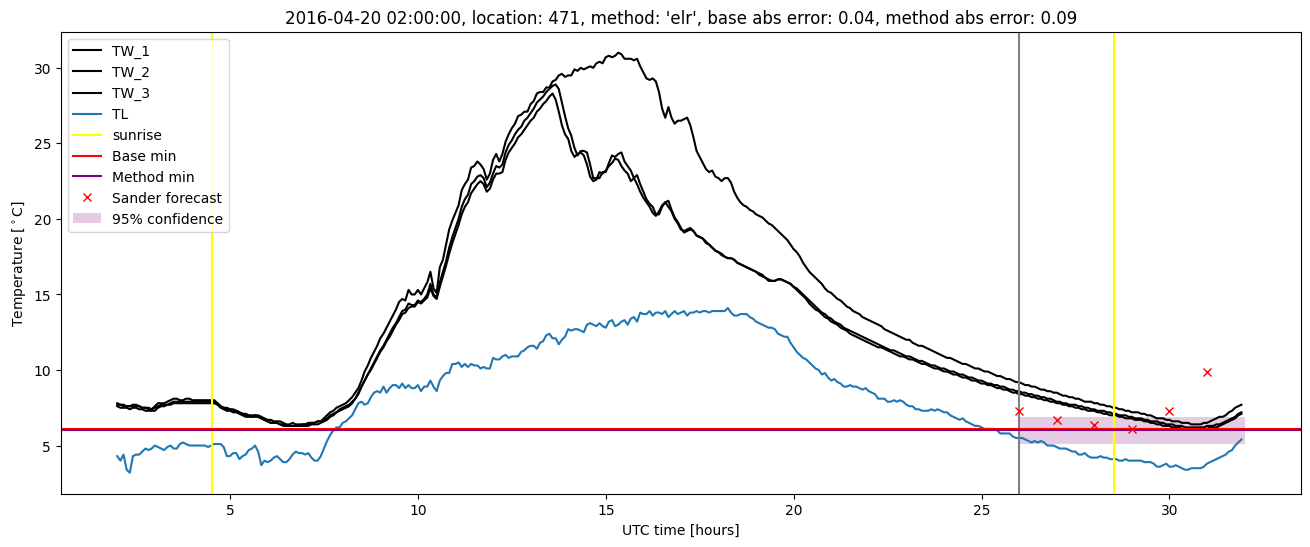
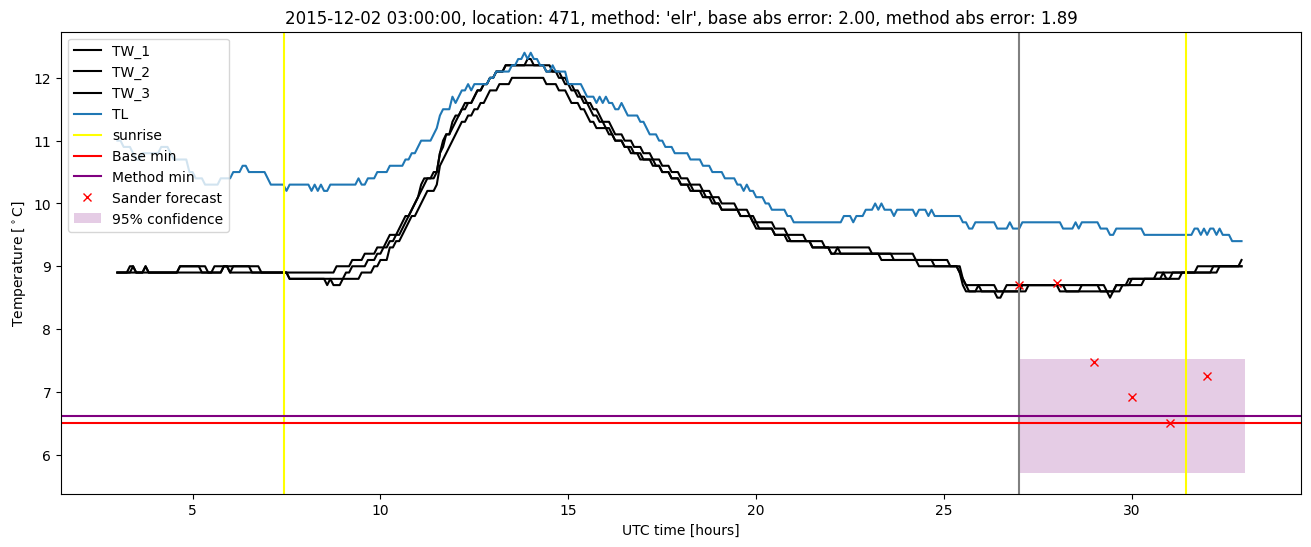
Extended logistic regression plots