GMS location: 458
Random forest results
| names |
period |
power |
significance |
meanSquareError |
absError |
maxError |
CRPS |
IGN |
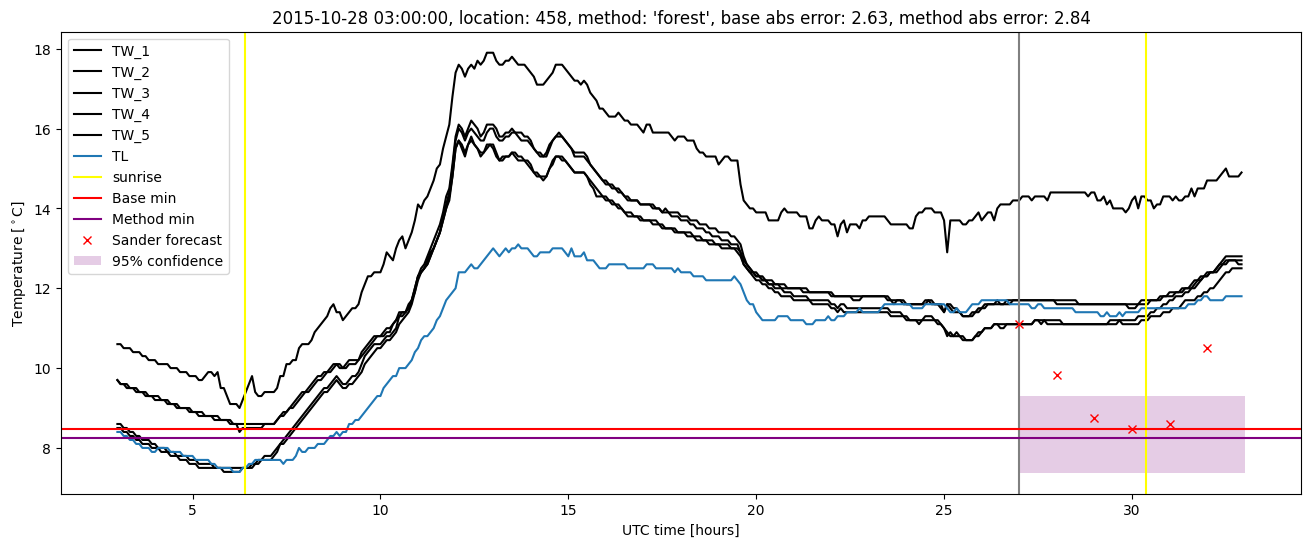
| baseline |
winter 2016 |
0.976 |
0.087 |
0.354 |
0.438 |
2.635 |
NaN |
NaN |
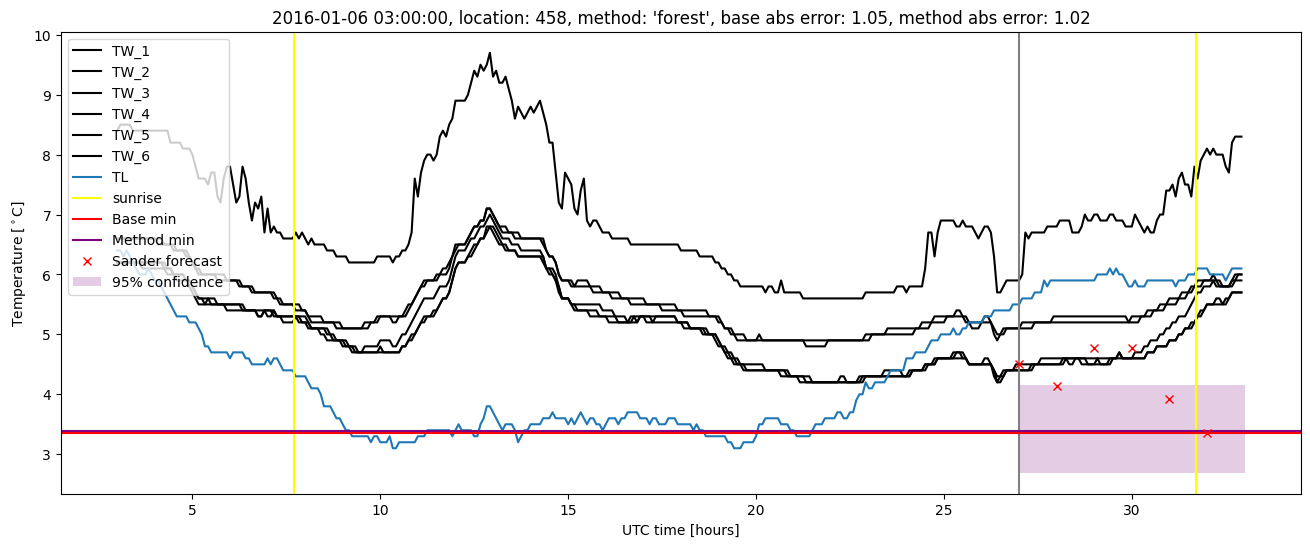
| forest |
winter 2016 |
0.988 |
0.130 |
0.322 |
0.403 |
2.839 |
0.486 |
6.973 |
| baseline |
winter 2017 |
0.980 |
0.025 |
0.356 |
0.422 |
2.076 |
NaN |
NaN |
| forest |
winter 2017 |
0.980 |
0.025 |
0.274 |
0.360 |
1.810 |
0.451 |
3.757 |
| baseline |
winter 2018 |
0.984 |
0.097 |
0.271 |
0.376 |
2.159 |
NaN |
NaN |
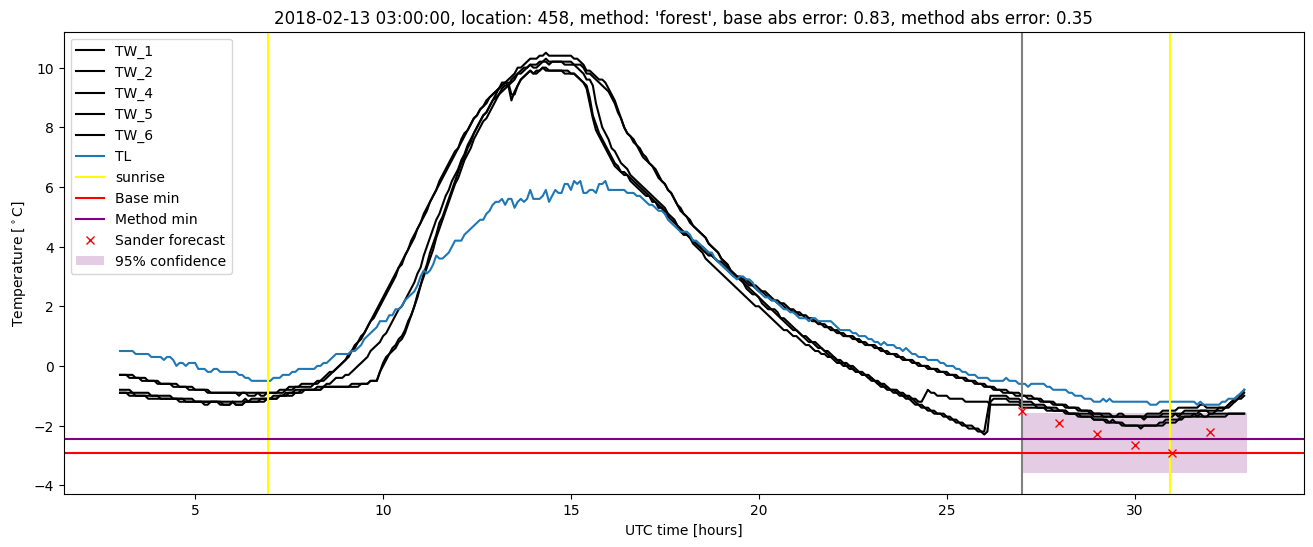
| forest |
winter 2018 |
0.984 |
0.097 |
0.234 |
0.335 |
2.288 |
0.458 |
3.518 |
| baseline |
winter 2019 |
1.000 |
0.062 |
0.261 |
0.398 |
1.620 |
NaN |
NaN |
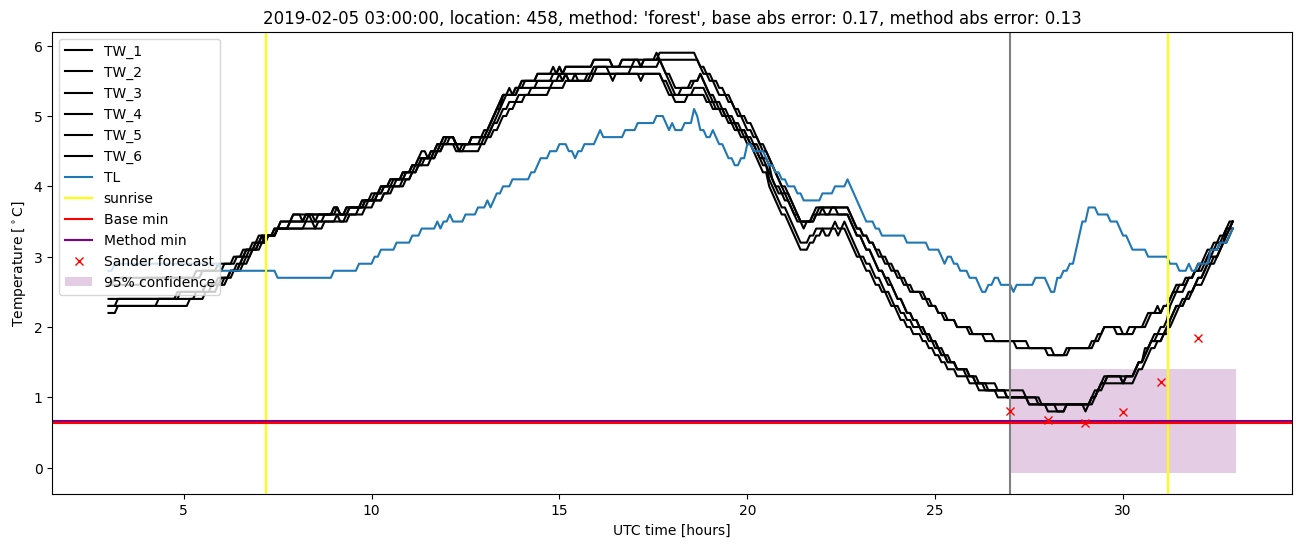
| forest |
winter 2019 |
1.000 |
0.062 |
0.227 |
0.363 |
1.449 |
0.444 |
2.854 |
| baseline |
all |
0.984 |
0.064 |
0.314 |
0.410 |
2.635 |
NaN |
NaN |
| forest |
all |
0.988 |
0.073 |
0.269 |
0.368 |
2.839 |
0.462 |
4.492 |
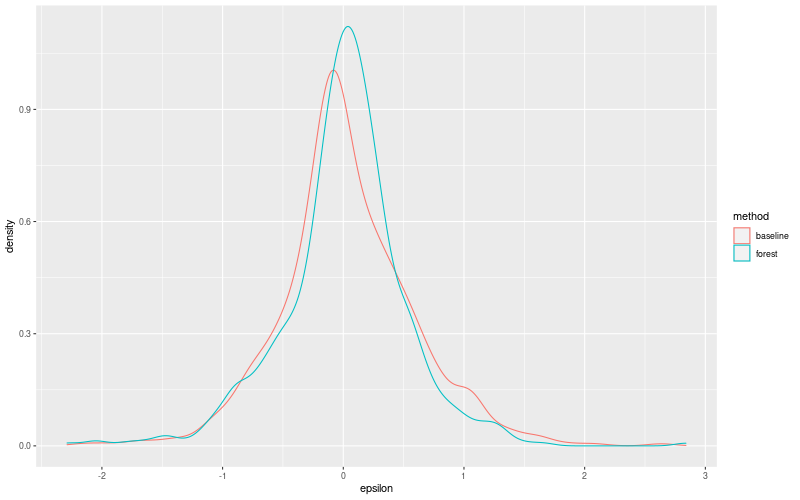
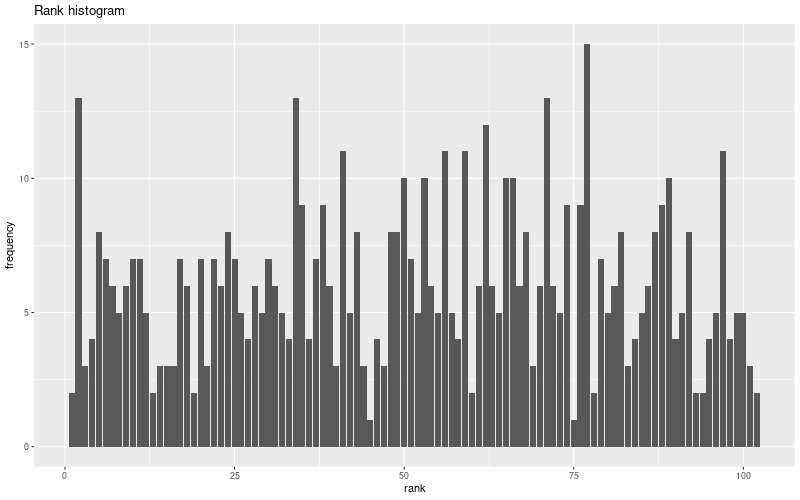
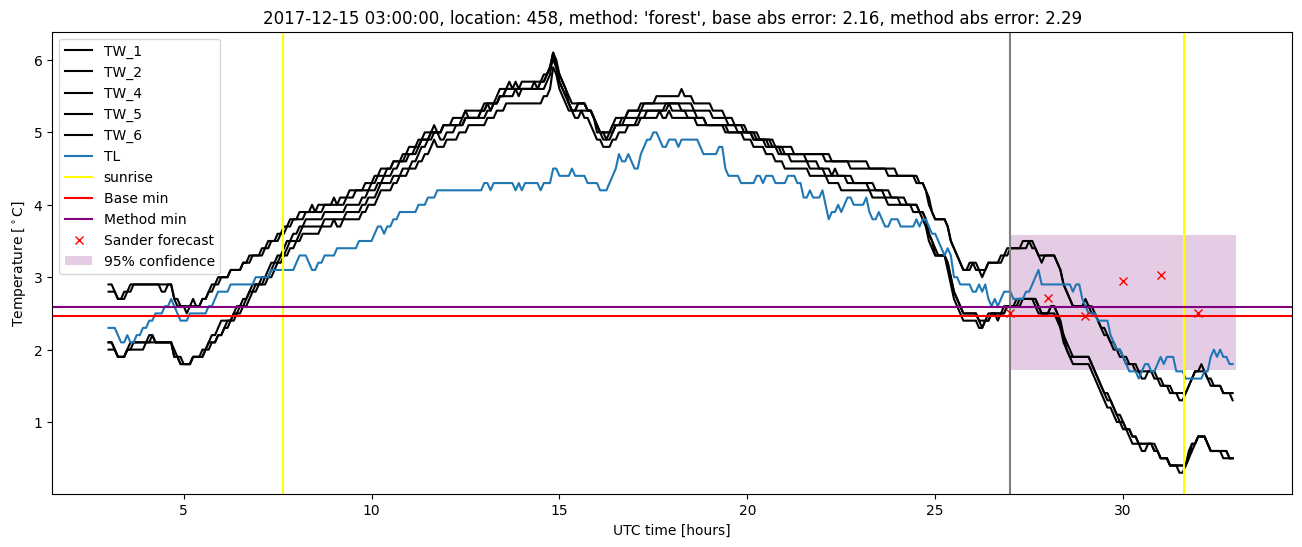
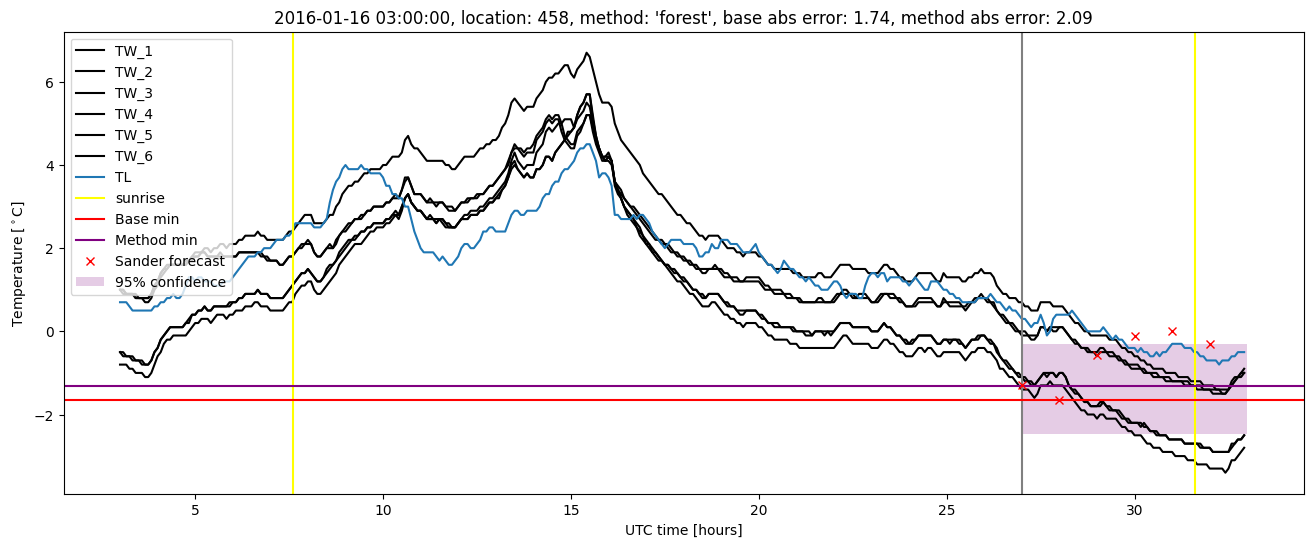
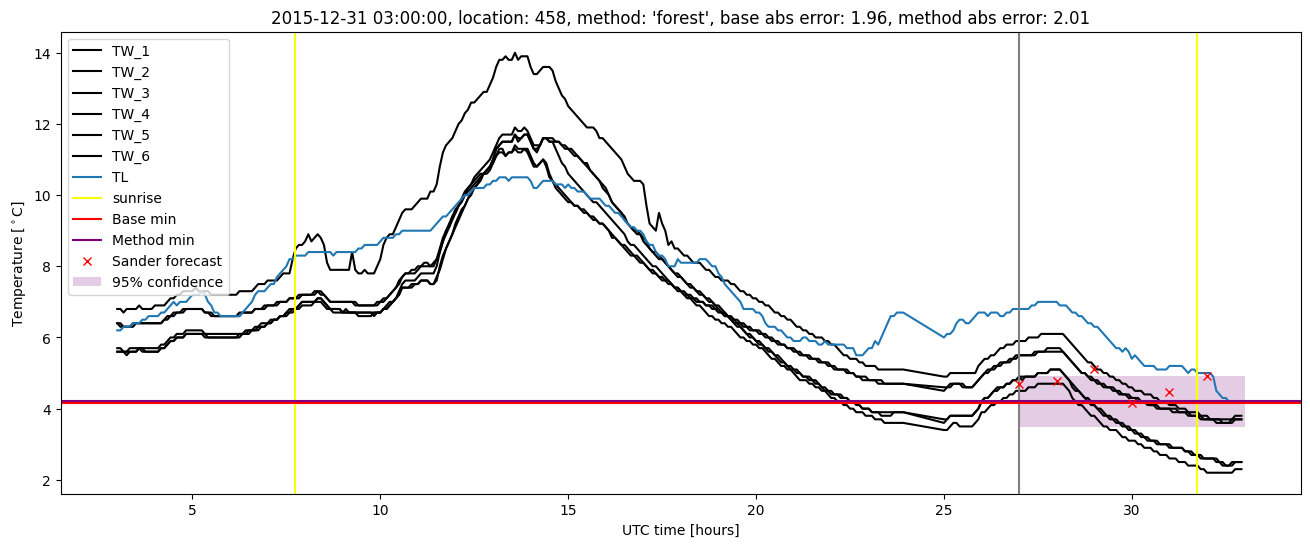
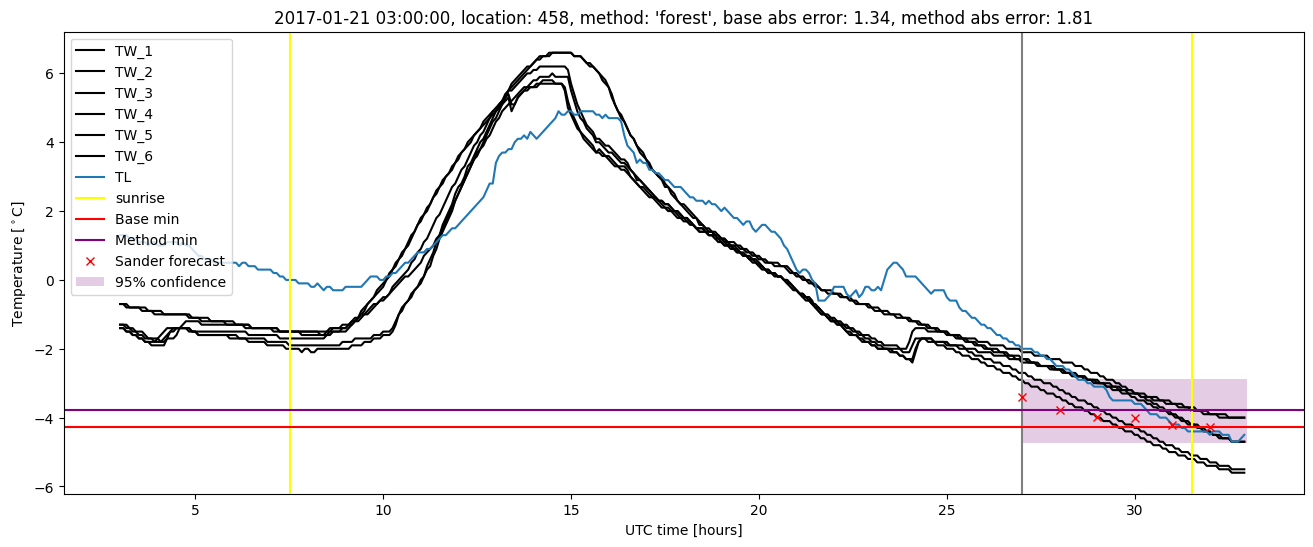
Random forest plots
Extended logistic regression results
| names |
period |
power |
significance |
meanSquareError |
absError |
maxError |
CRPS |
IGN |
| baseline |
winter 2016 |
0.976 |
0.087 |
0.354 |
0.438 |
2.635 |
NaN |
NaN |
| elr |
winter 2016 |
0.982 |
0.087 |
0.381 |
0.459 |
2.396 |
0.615 |
7.144 |
| baseline |
winter 2017 |
0.980 |
0.025 |
0.356 |
0.422 |
2.076 |
NaN |
NaN |
| elr |
winter 2017 |
0.971 |
0.025 |
0.324 |
0.400 |
1.791 |
0.506 |
4.694 |
| baseline |
winter 2018 |
0.984 |
0.097 |
0.271 |
0.376 |
2.159 |
NaN |
NaN |
| elr |
winter 2018 |
0.984 |
0.129 |
0.261 |
0.360 |
2.337 |
0.534 |
3.910 |
| baseline |
winter 2019 |
1.000 |
0.062 |
0.261 |
0.398 |
1.620 |
NaN |
NaN |
| elr |
winter 2019 |
1.000 |
0.125 |
0.257 |
0.387 |
1.761 |
0.474 |
3.074 |
| baseline |
all |
0.984 |
0.064 |
0.314 |
0.410 |
2.635 |
NaN |
NaN |
| elr |
all |
0.984 |
0.082 |
0.311 |
0.406 |
2.396 |
0.540 |
4.904 |
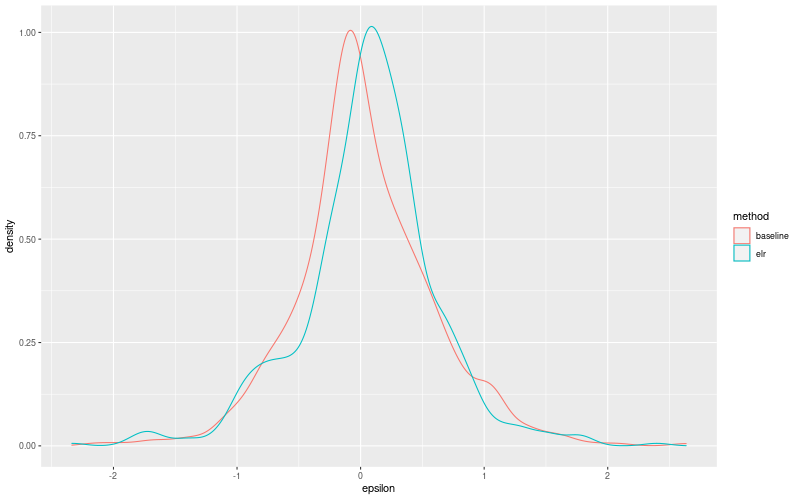
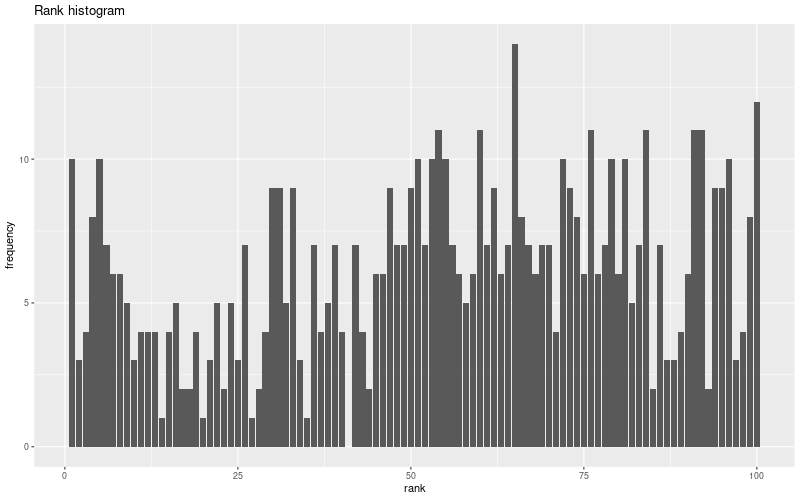
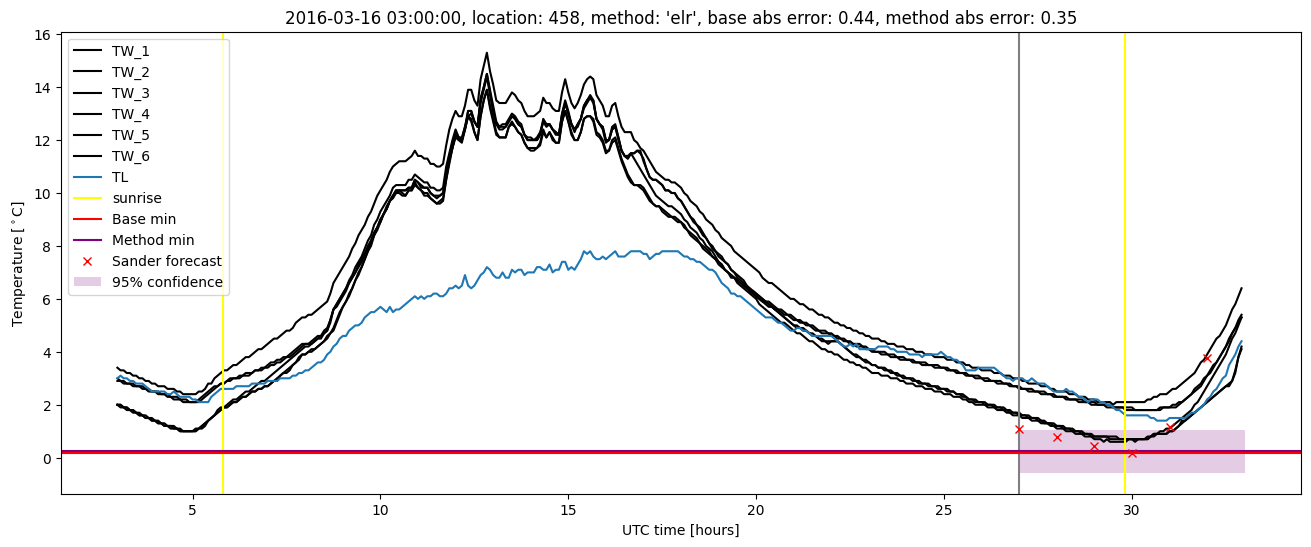
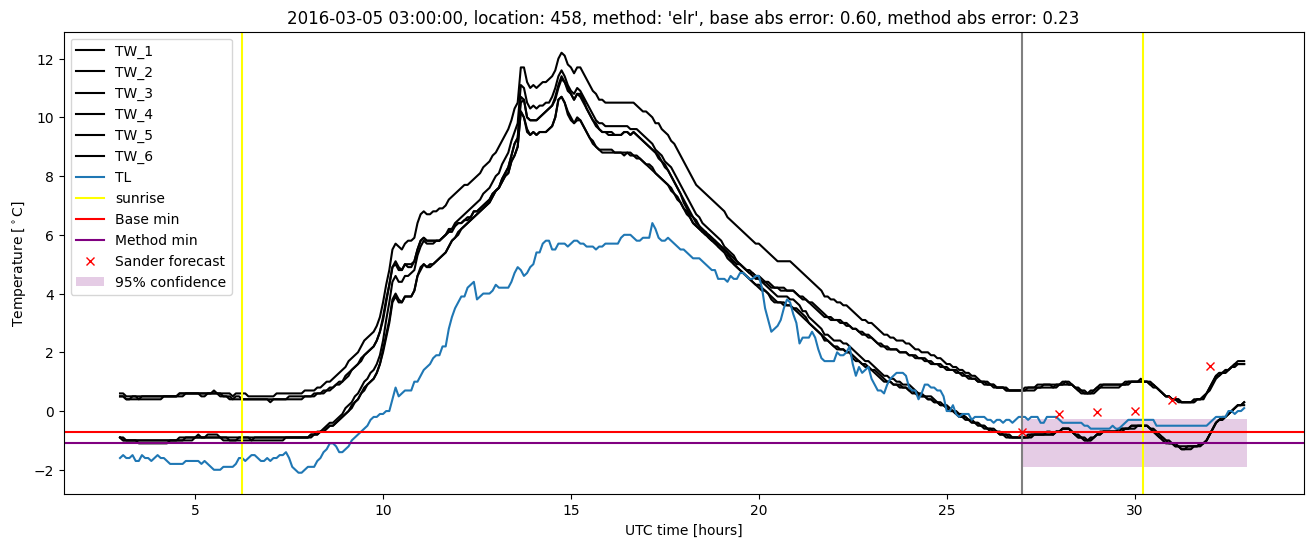
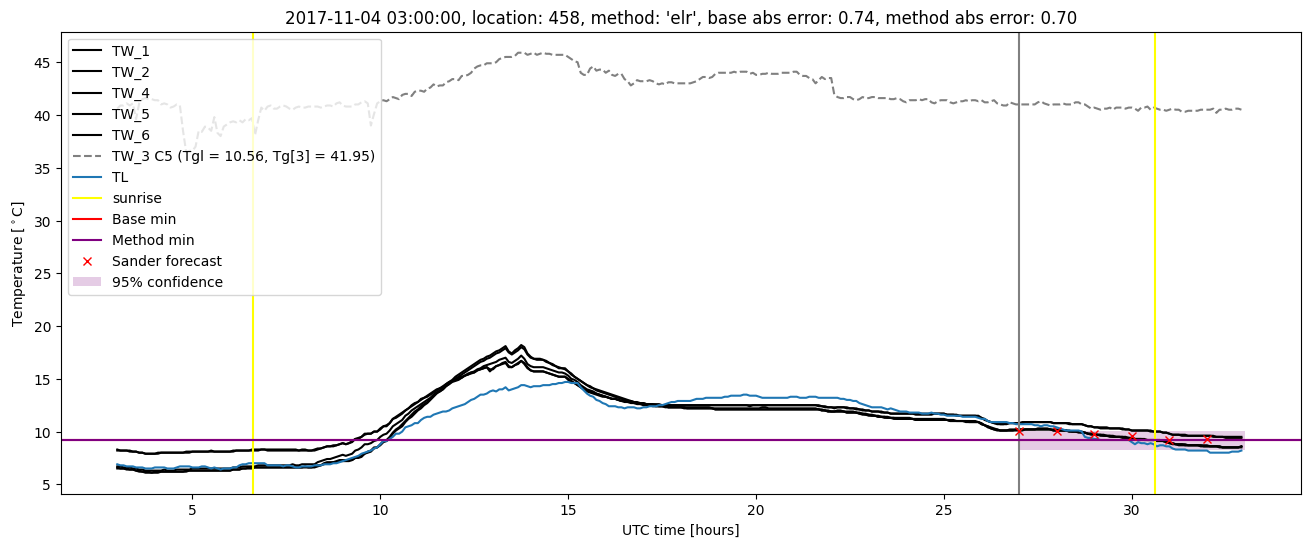
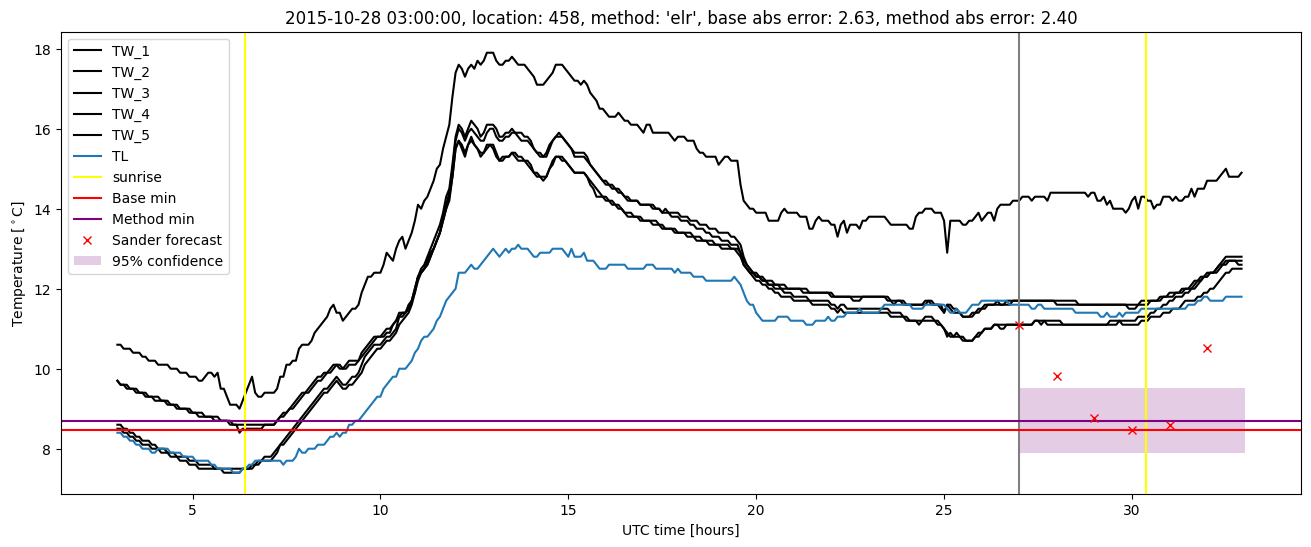
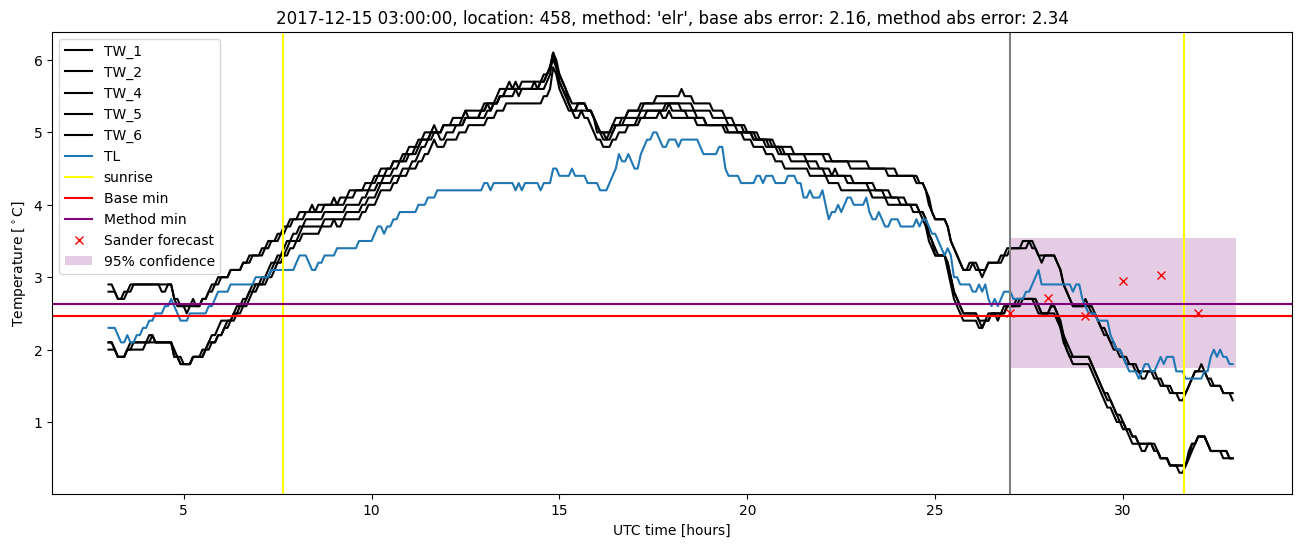
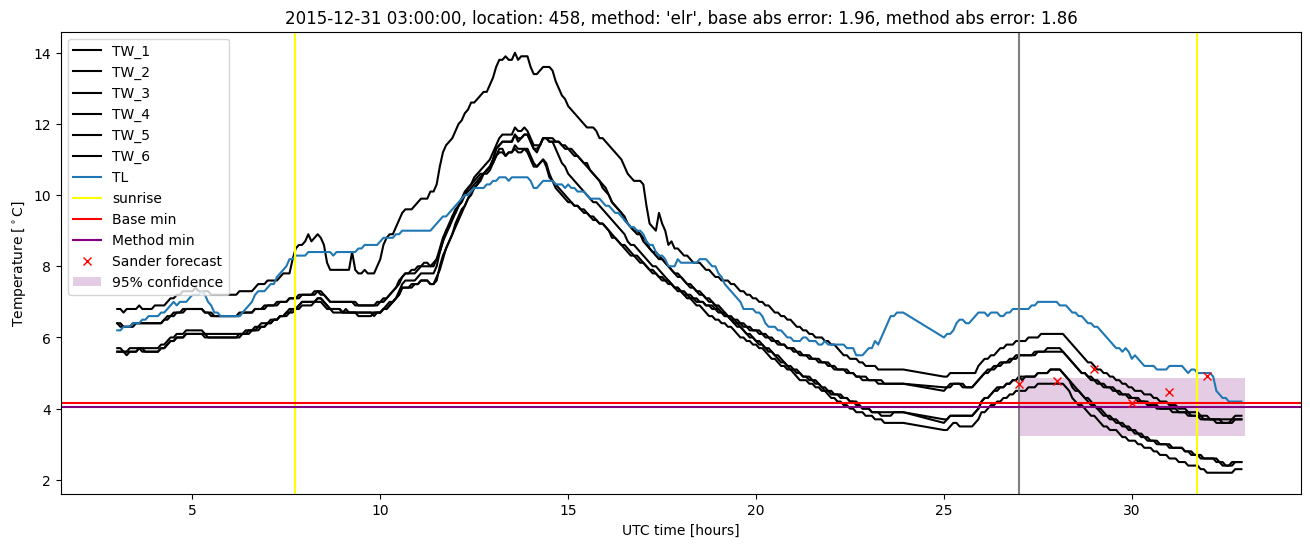
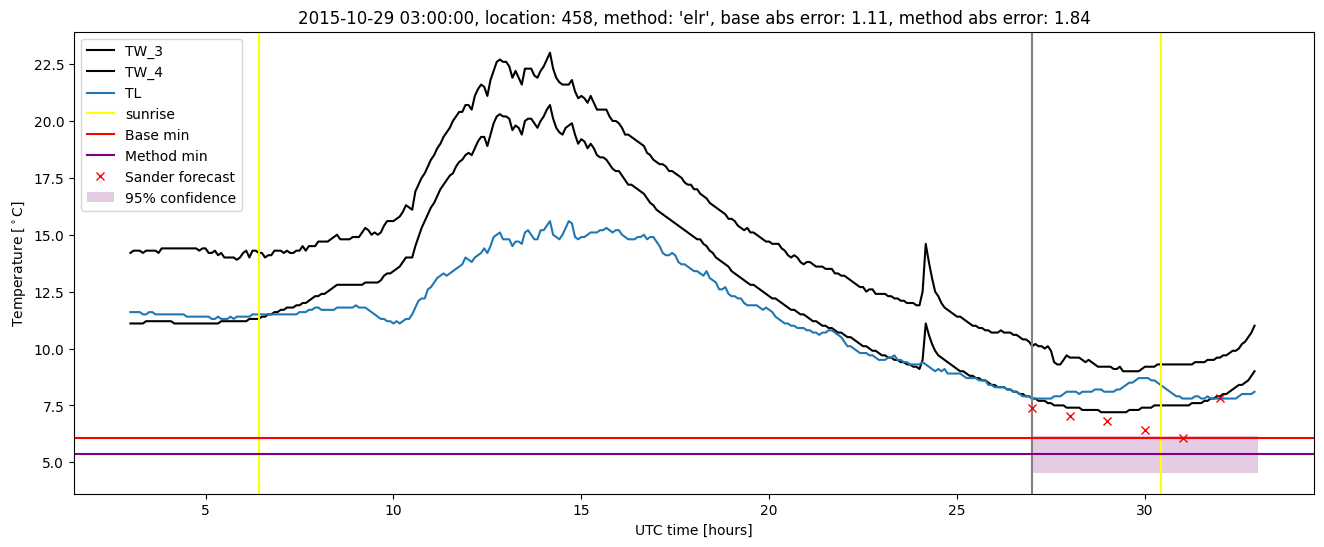
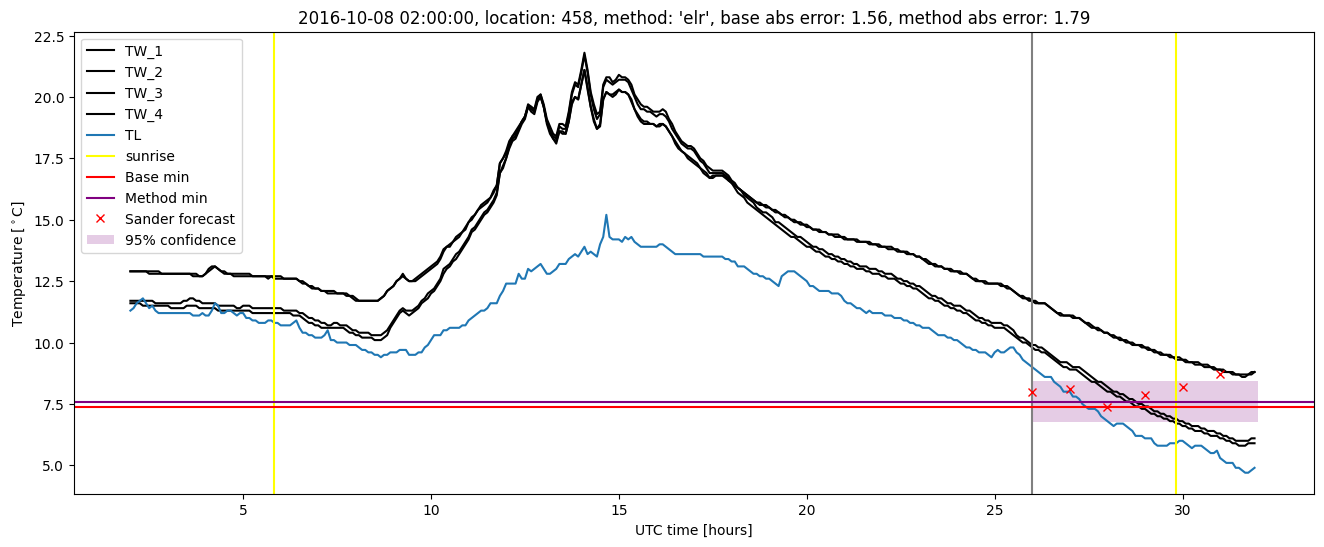
Extended logistic regression plots