GMS location: 457
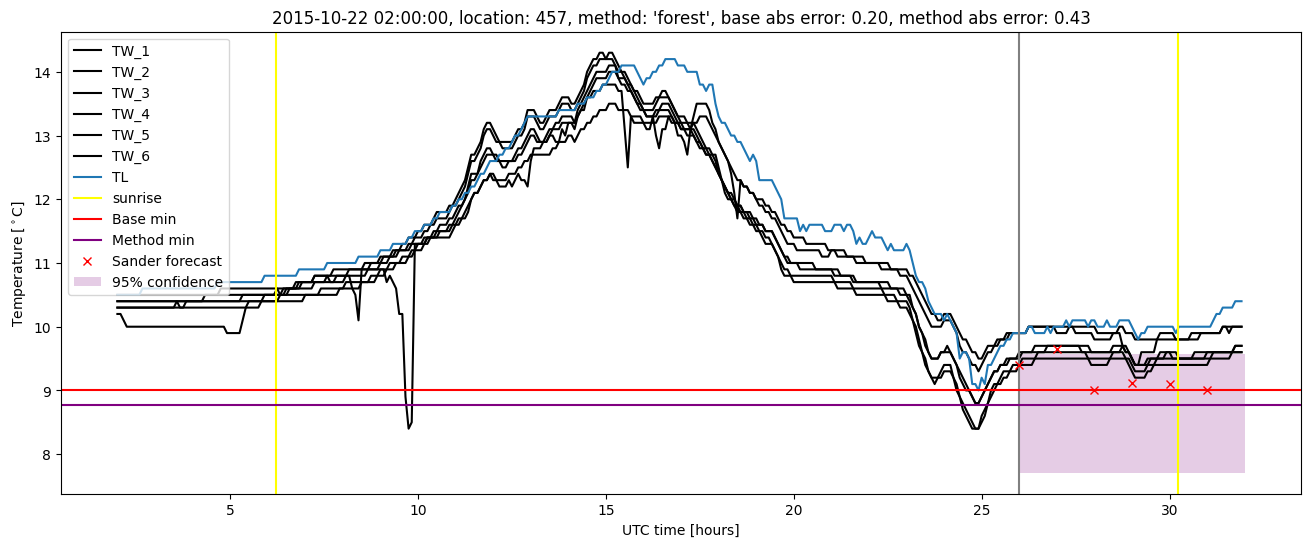
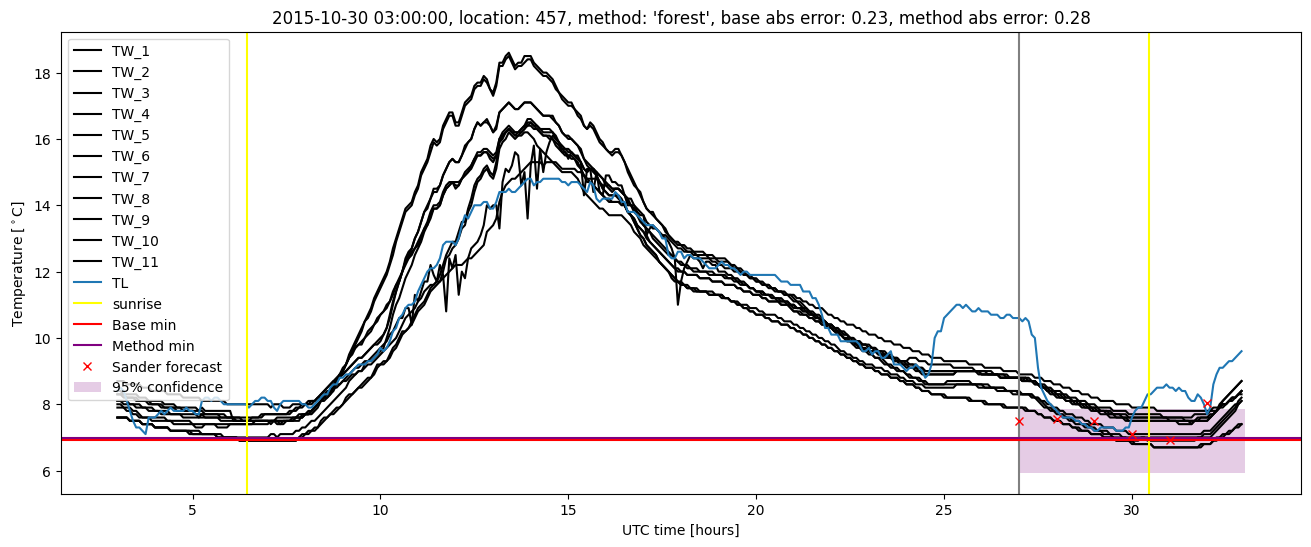
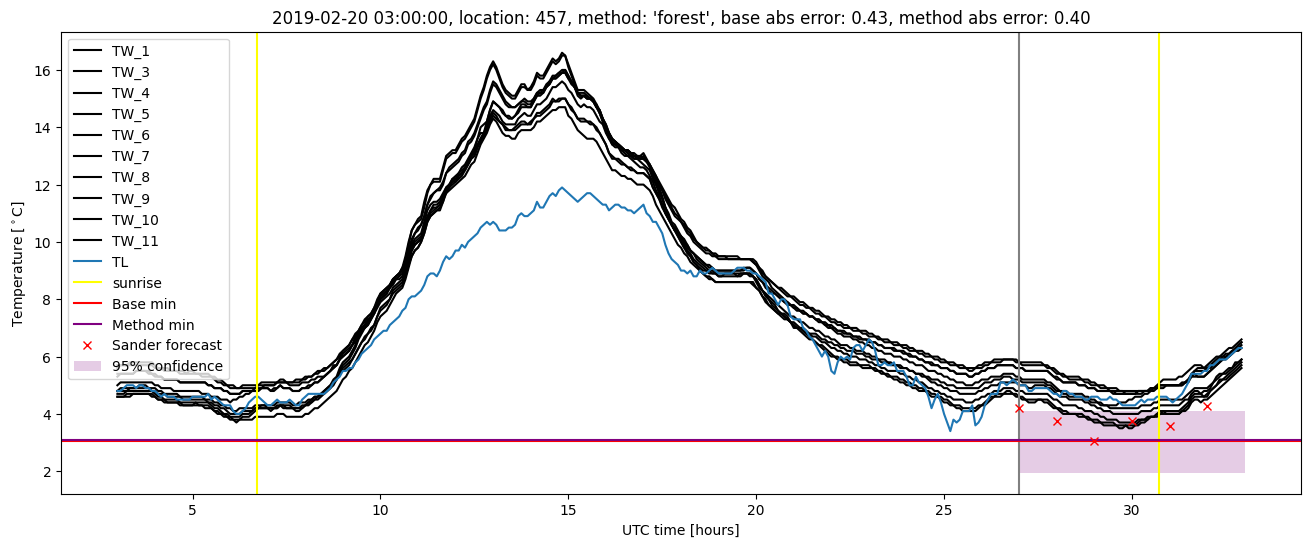
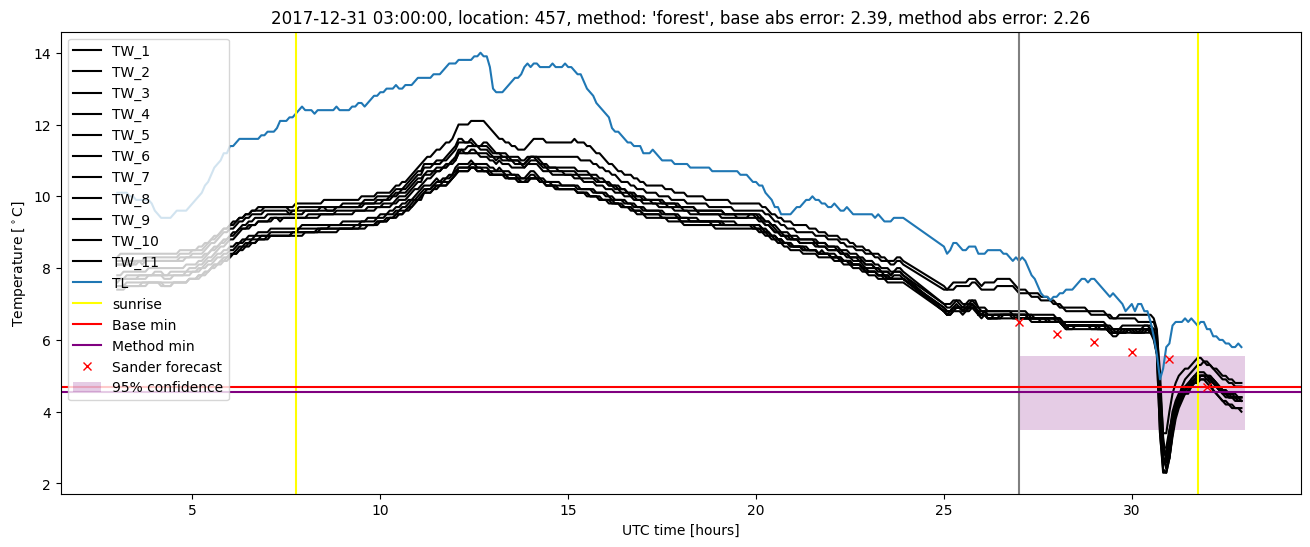
Random forest results
| names |
period |
power |
significance |
meanSquareError |
absError |
maxError |
CRPS |
IGN |
| baseline |
winter 2016 |
0.983 |
0.000e+00 |
0.478 |
0.532 |
2.035 |
NaN |
NaN |
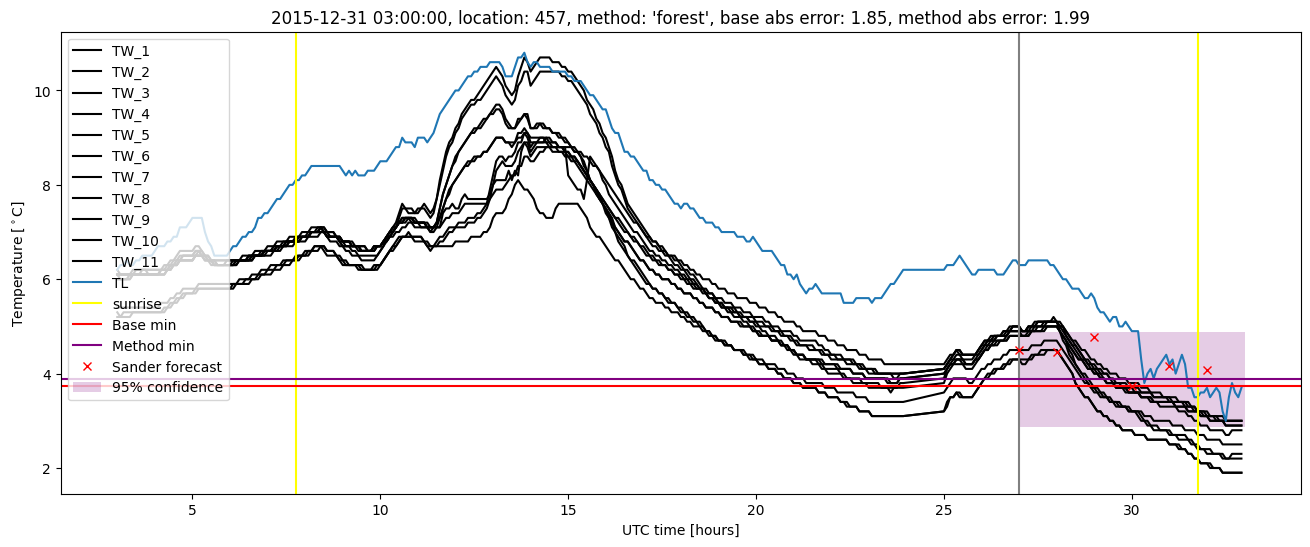
| forest |
winter 2016 |
0.994 |
0.038 |
0.373 |
0.454 |
1.989 |
0.488 |
3.573 |
| baseline |
winter 2017 |
0.973 |
0.045 |
0.431 |
0.478 |
2.320 |
NaN |
NaN |
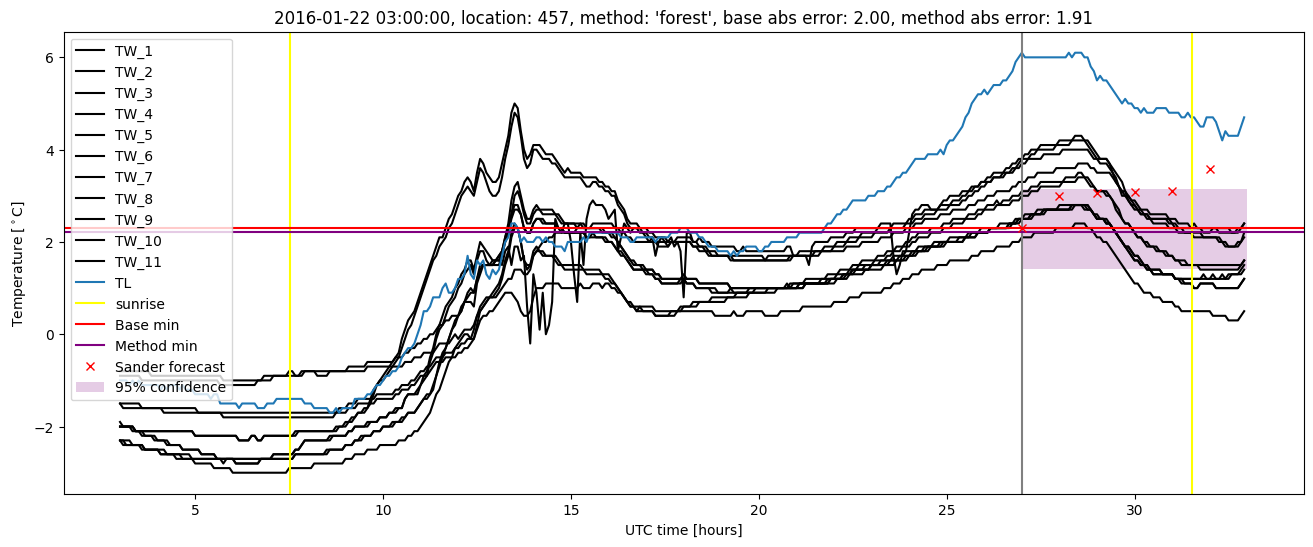
| forest |
winter 2017 |
0.963 |
0.068 |
0.304 |
0.410 |
1.788 |
0.474 |
2.831 |
| baseline |
winter 2018 |
0.985 |
0.175 |
0.409 |
0.468 |
2.467 |
NaN |
NaN |
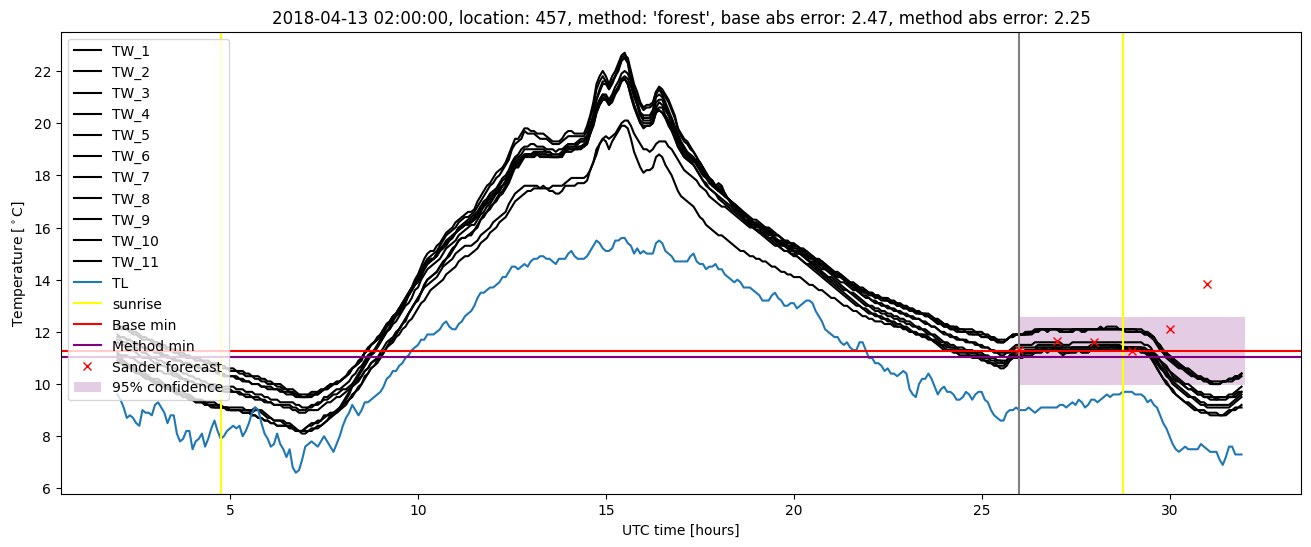
| forest |
winter 2018 |
0.977 |
0.150 |
0.323 |
0.394 |
2.260 |
0.476 |
2.532 |
| baseline |
winter 2019 |
1.000 |
0.059 |
0.283 |
0.398 |
1.560 |
NaN |
NaN |
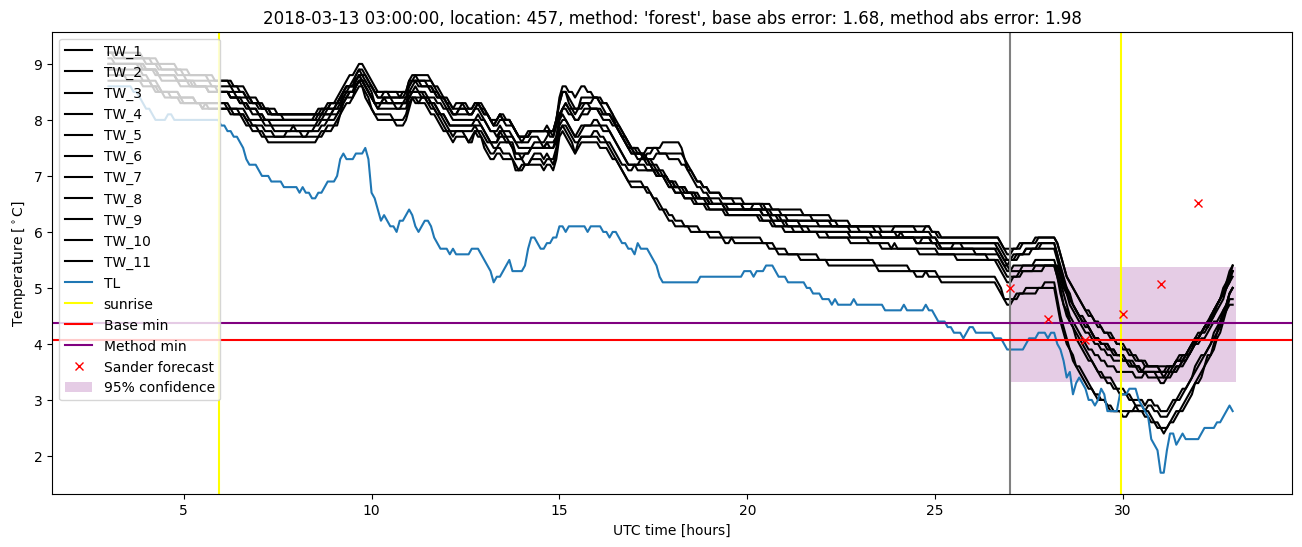
| forest |
winter 2019 |
1.000 |
0.059 |
0.195 |
0.329 |
1.344 |
0.460 |
2.158 |
| baseline |
all |
0.985 |
0.079 |
0.408 |
0.475 |
2.467 |
NaN |
NaN |
| forest |
all |
0.985 |
0.087 |
0.306 |
0.402 |
2.260 |
0.476 |
2.834 |
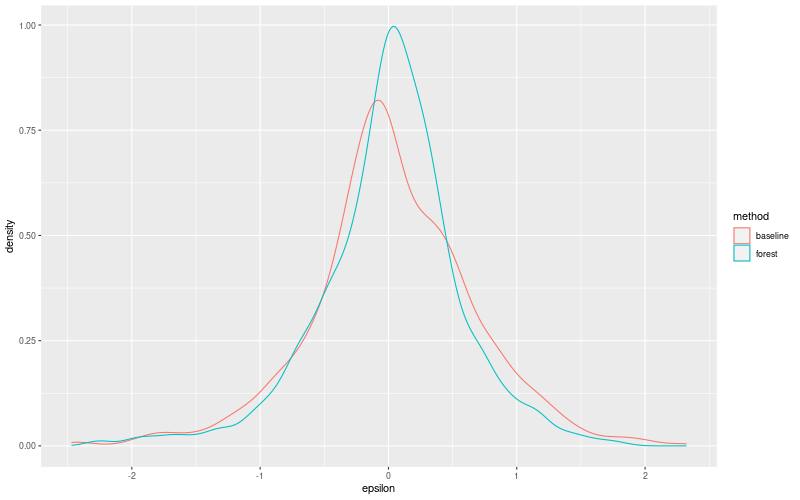
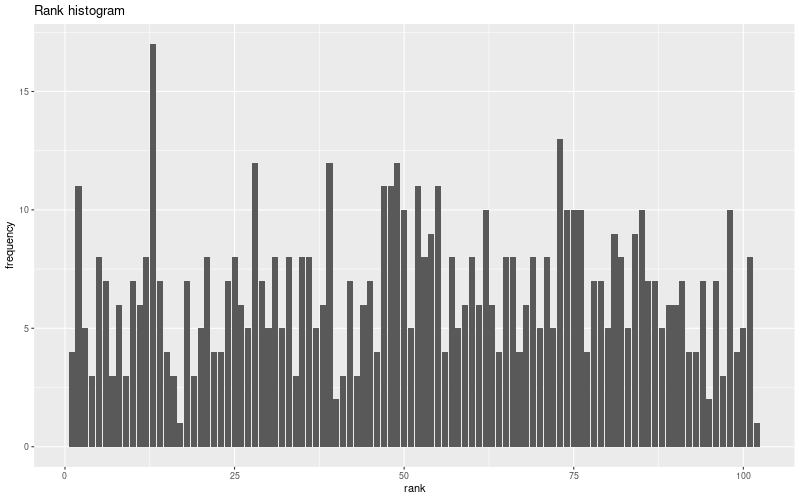
Random forest plots
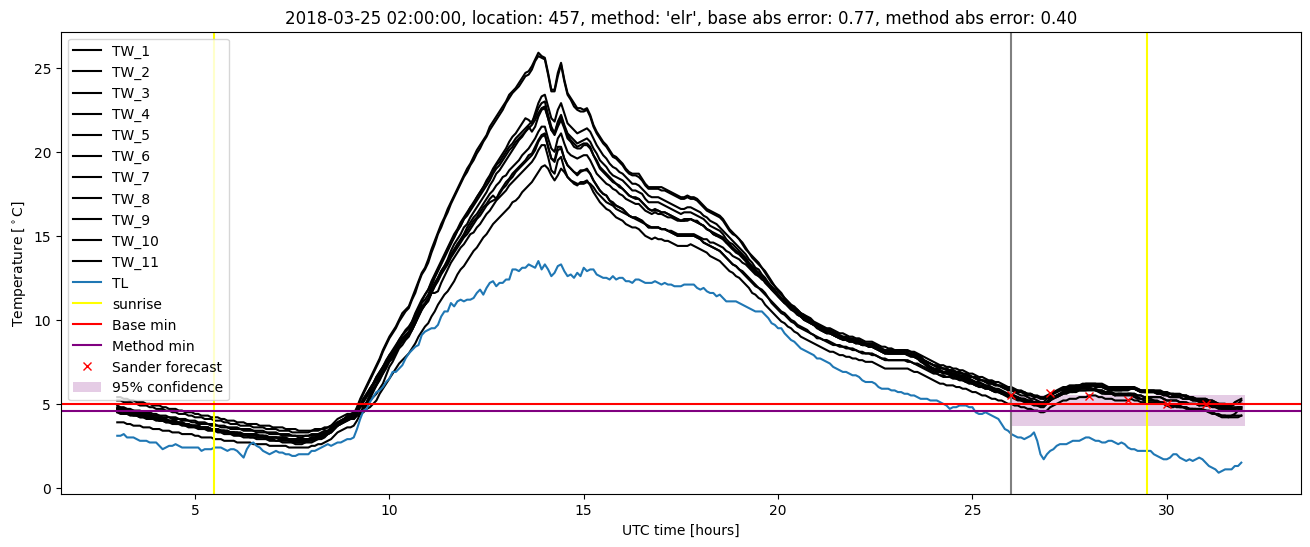
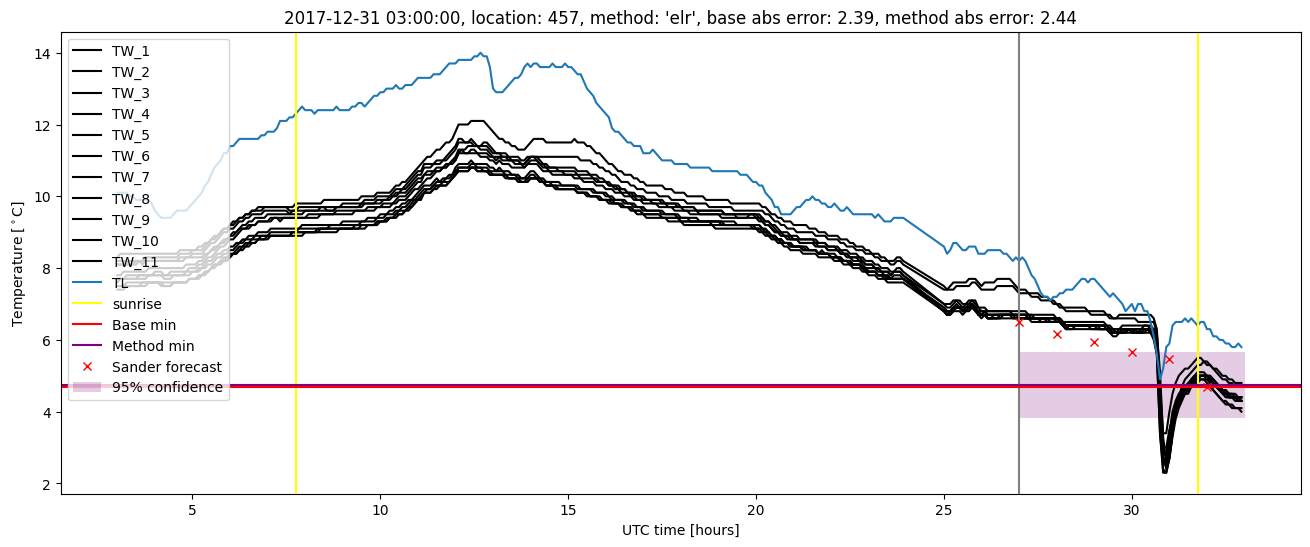
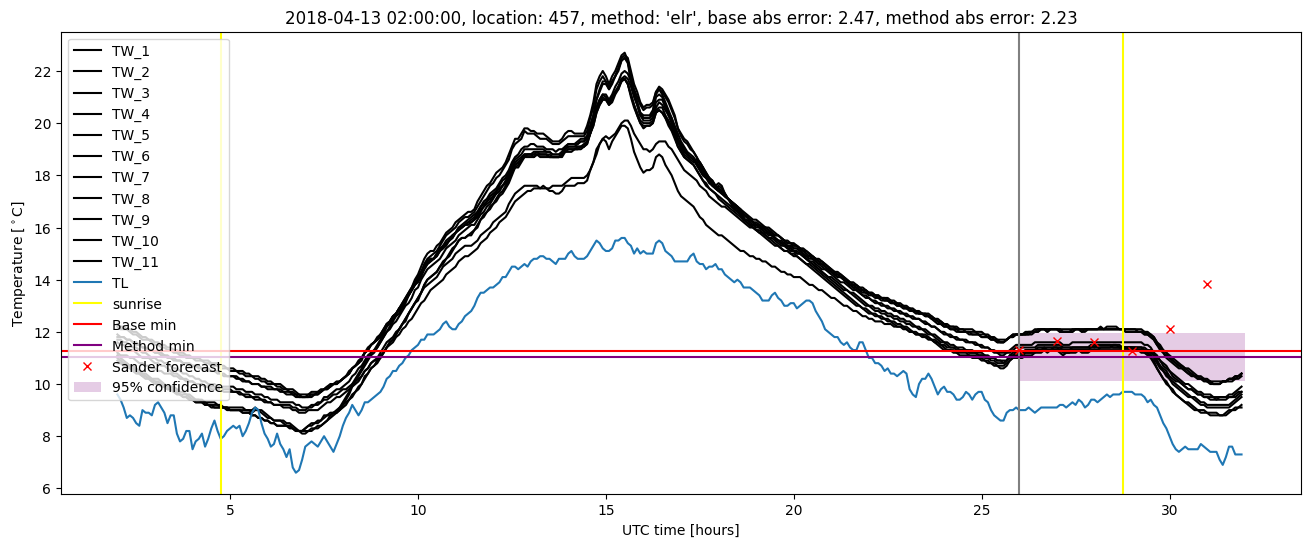
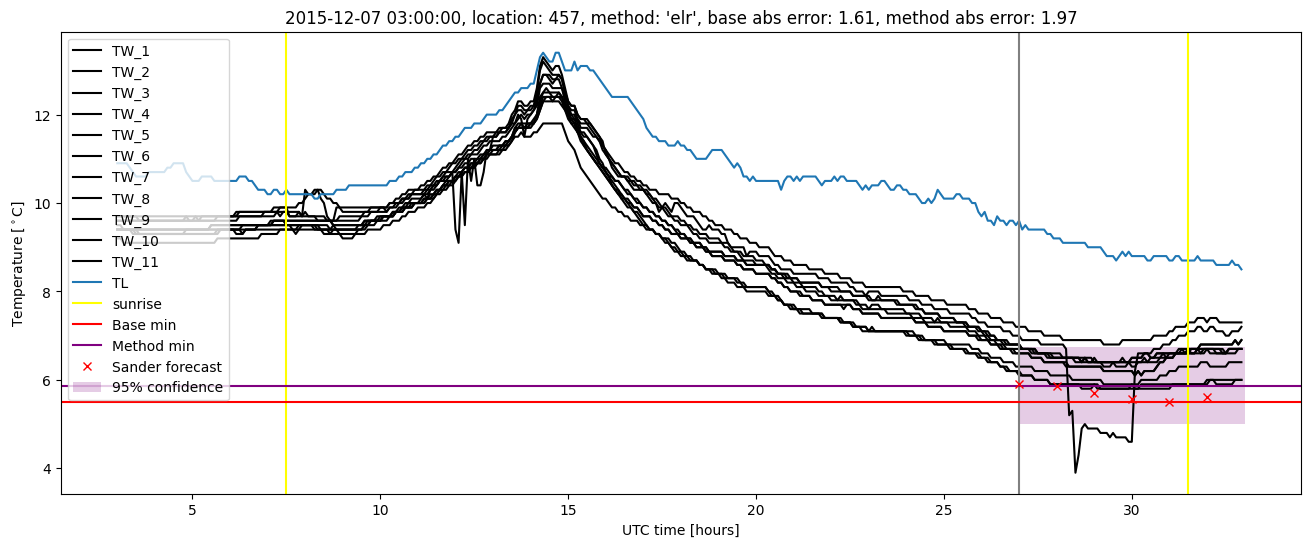
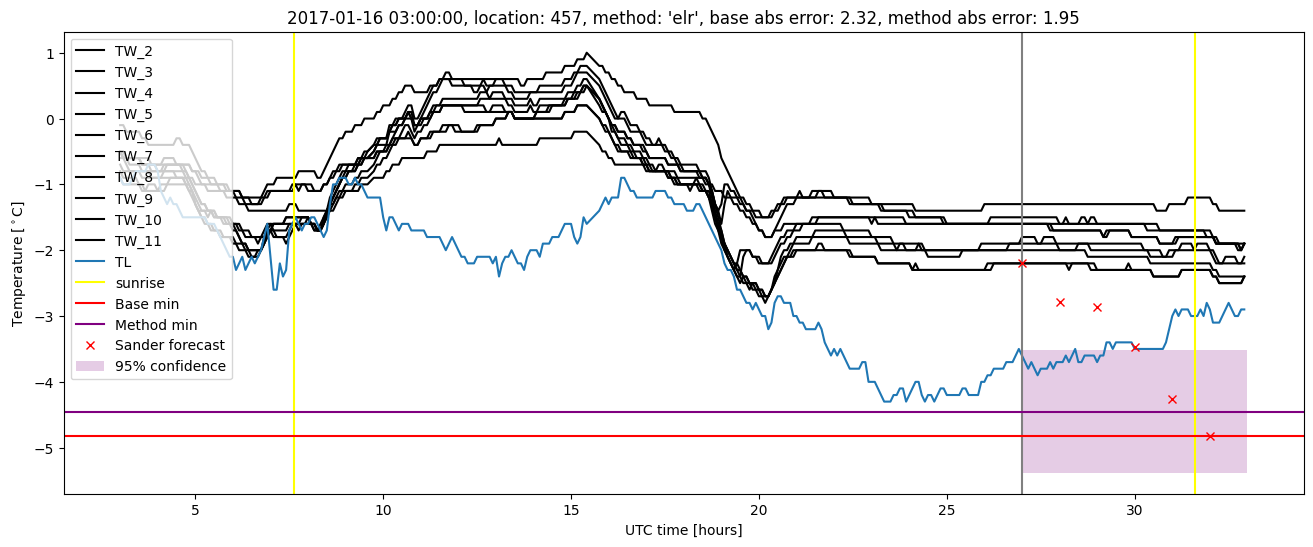
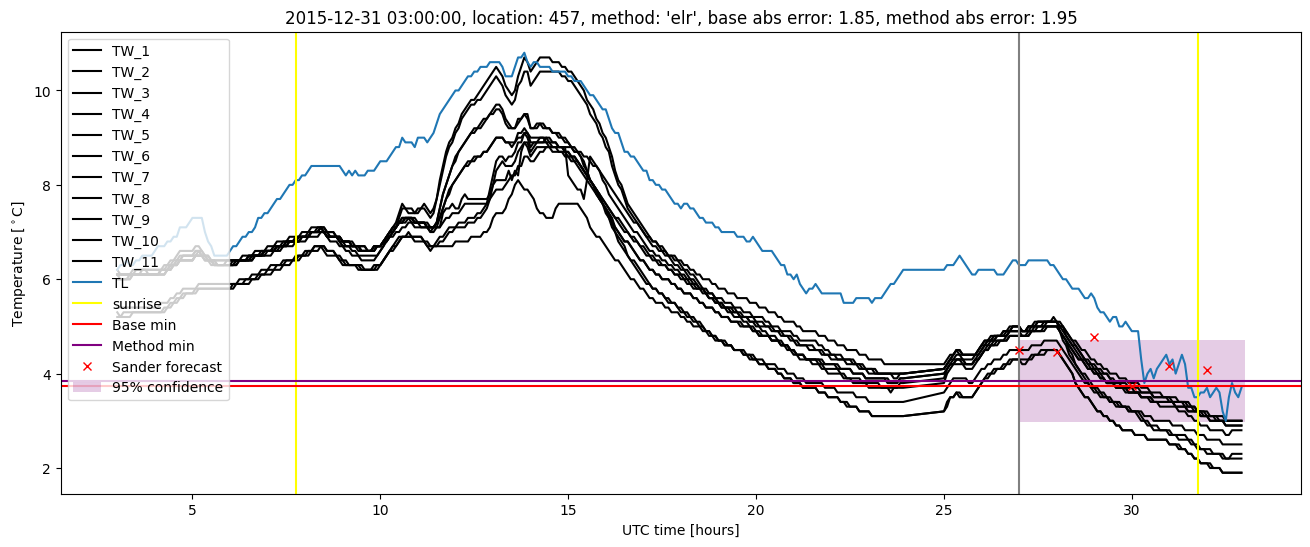
Extended logistic regression results
| names |
period |
power |
significance |
meanSquareError |
absError |
maxError |
CRPS |
IGN |
| baseline |
winter 2016 |
0.983 |
0.000e+00 |
0.478 |
0.532 |
2.035 |
NaN |
NaN |
| elr |
winter 2016 |
0.994 |
0.038 |
0.425 |
0.493 |
1.969 |
0.544 |
4.454 |
| baseline |
winter 2017 |
0.973 |
0.045 |
0.431 |
0.478 |
2.320 |
NaN |
NaN |
| elr |
winter 2017 |
0.973 |
0.068 |
0.373 |
0.469 |
1.951 |
0.510 |
3.196 |
| baseline |
winter 2018 |
0.985 |
0.175 |
0.409 |
0.468 |
2.467 |
NaN |
NaN |
| elr |
winter 2018 |
0.977 |
0.175 |
0.333 |
0.419 |
2.444 |
0.525 |
3.447 |
| baseline |
winter 2019 |
1.000 |
0.059 |
0.283 |
0.398 |
1.560 |
NaN |
NaN |
| elr |
winter 2019 |
1.000 |
0.118 |
0.224 |
0.355 |
1.398 |
0.497 |
2.739 |
| baseline |
all |
0.985 |
0.079 |
0.408 |
0.475 |
2.467 |
NaN |
NaN |
| elr |
all |
0.987 |
0.102 |
0.346 |
0.439 |
2.444 |
0.521 |
3.543 |
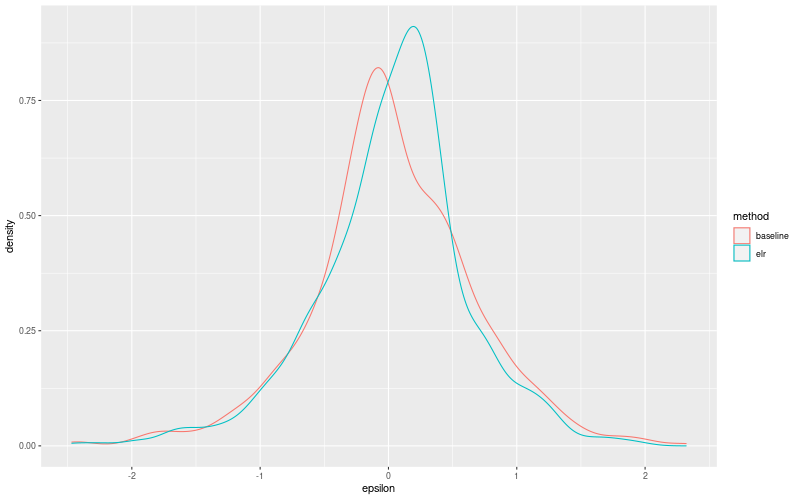
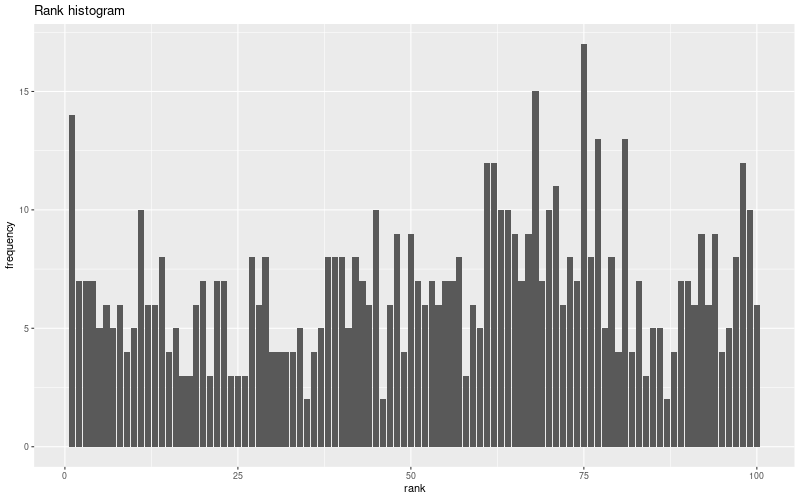
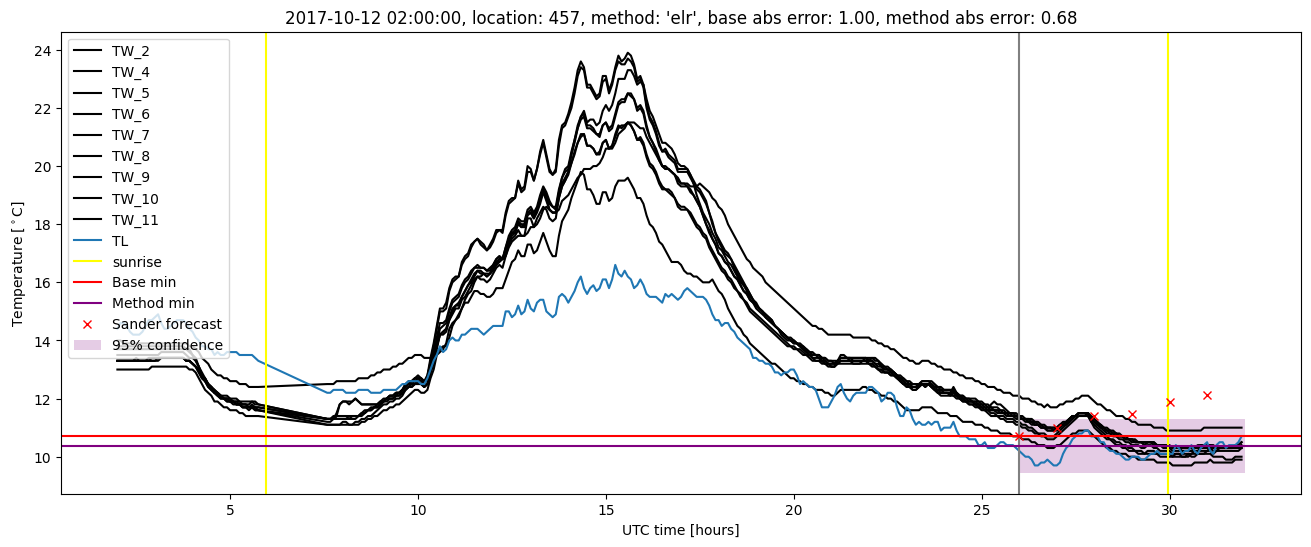
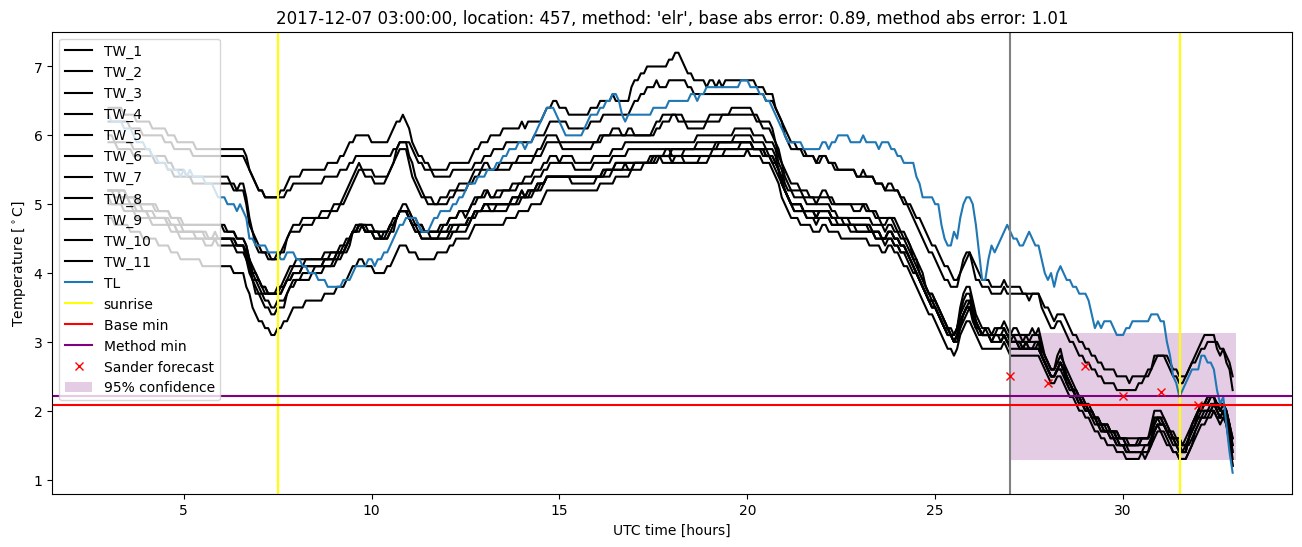
Extended logistic regression plots