GMS location: 455
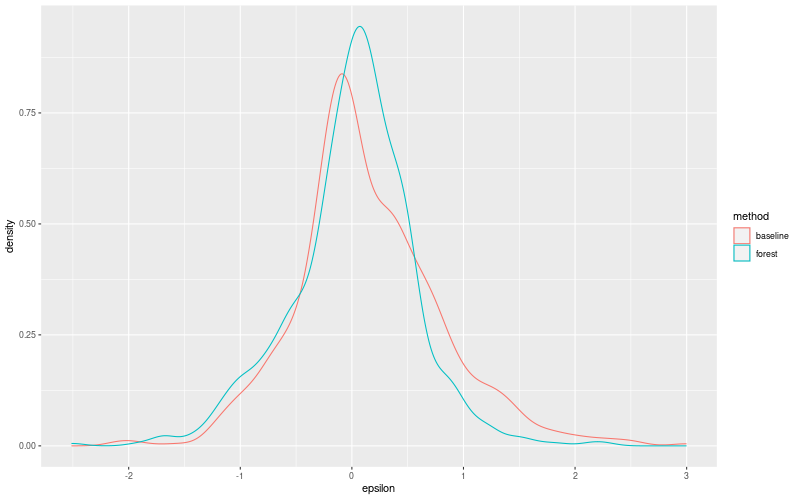
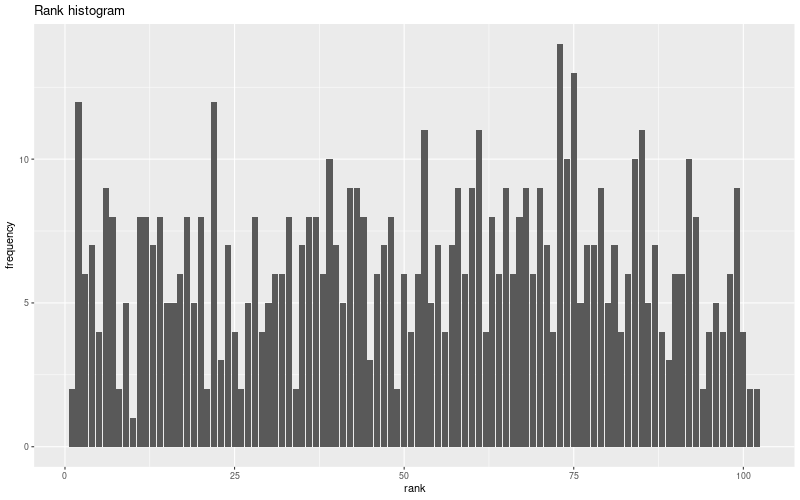
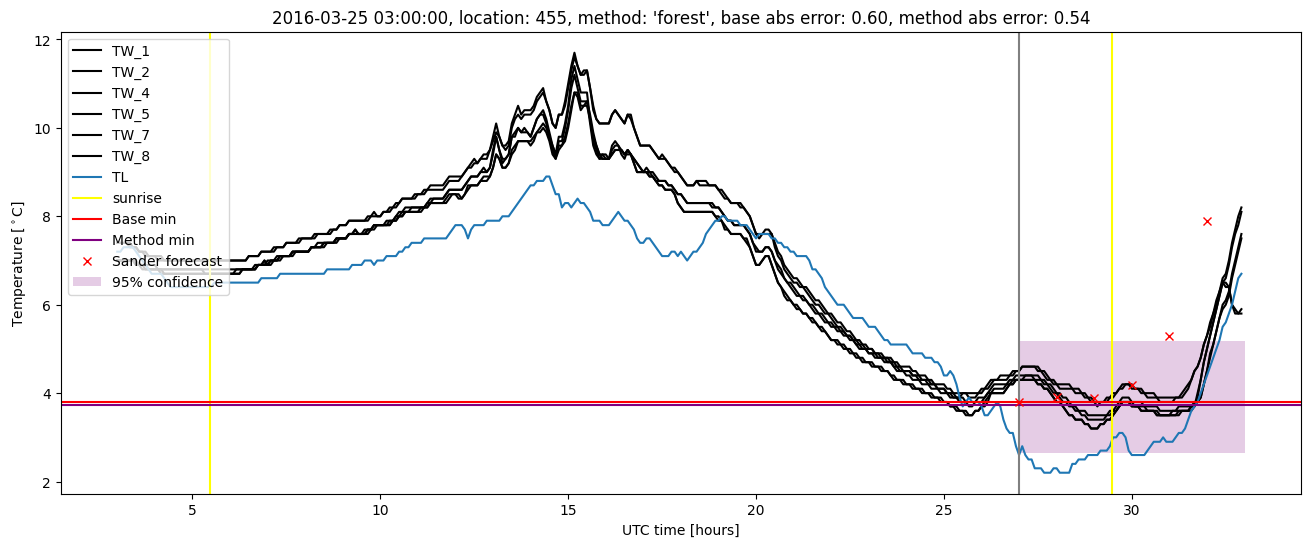
Random forest results
| names |
period |
power |
significance |
meanSquareError |
absError |
maxError |
CRPS |
IGN |
| baseline |
winter 2016 |
0.965 |
0.105 |
0.534 |
0.534 |
2.995 |
NaN |
NaN |
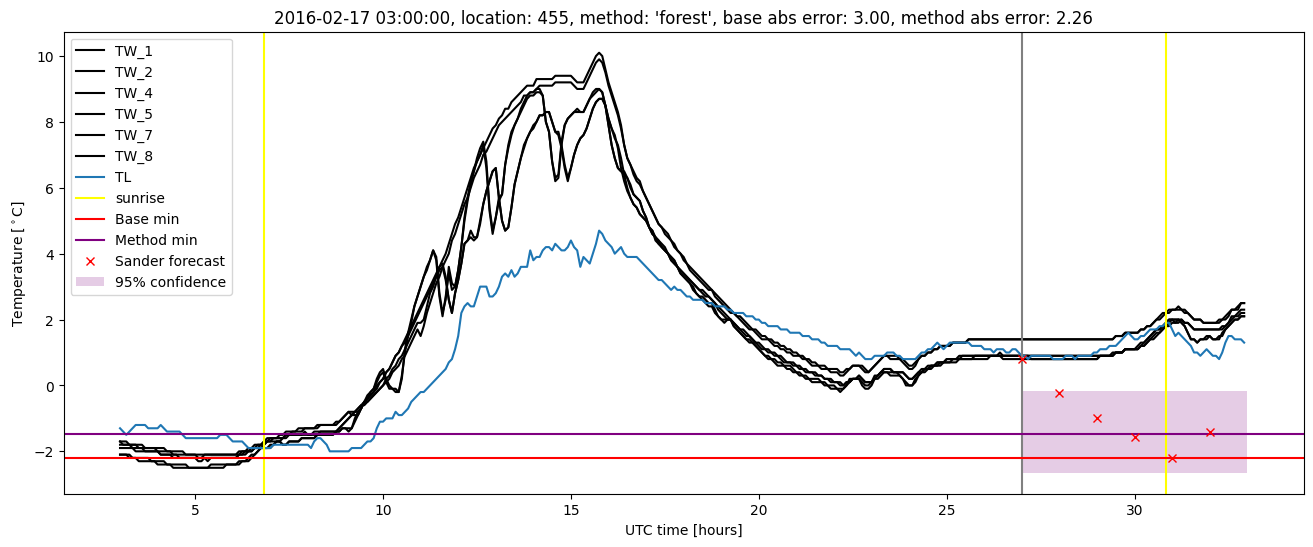
| forest |
winter 2016 |
0.965 |
0.000e+00 |
0.335 |
0.422 |
2.264 |
0.452 |
4.720 |
| baseline |
winter 2017 |
0.964 |
0.077 |
0.509 |
0.520 |
2.505 |
NaN |
NaN |
| forest |
winter 2017 |
0.964 |
0.077 |
0.272 |
0.409 |
1.722 |
0.443 |
2.583 |
| baseline |
winter 2018 |
0.993 |
0.146 |
0.386 |
0.460 |
2.072 |
NaN |
NaN |
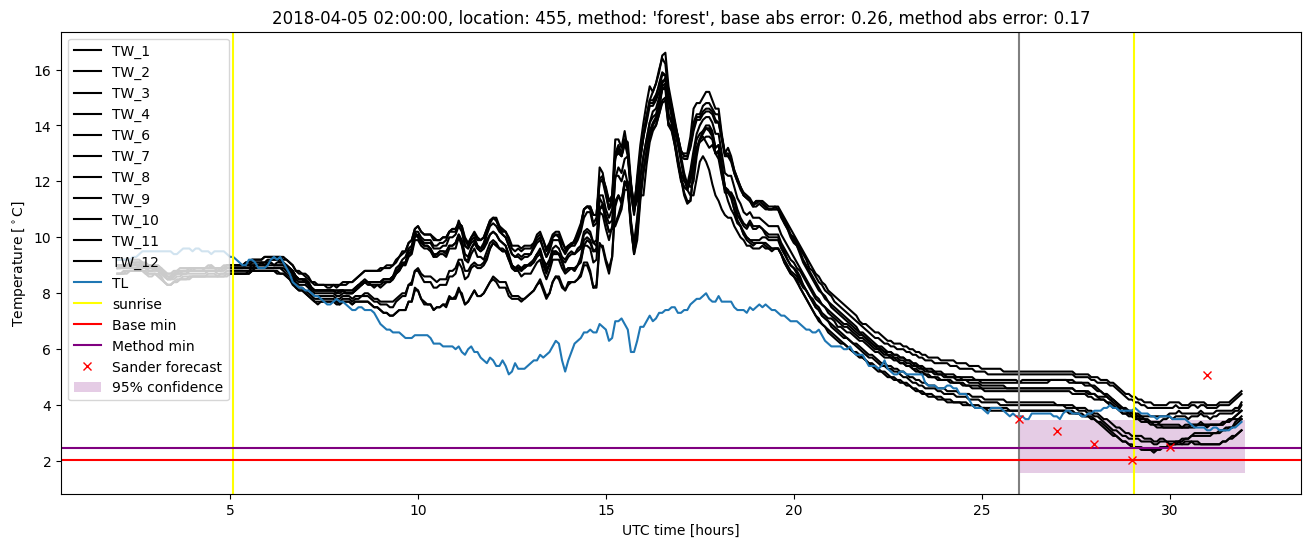
| forest |
winter 2018 |
0.993 |
0.146 |
0.348 |
0.414 |
2.509 |
0.439 |
2.911 |
| baseline |
winter 2019 |
0.992 |
0.000e+00 |
0.364 |
0.446 |
2.013 |
NaN |
NaN |
| forest |
winter 2019 |
0.992 |
0.118 |
0.258 |
0.388 |
1.435 |
0.421 |
2.460 |
| baseline |
all |
0.978 |
0.095 |
0.452 |
0.492 |
2.995 |
NaN |
NaN |
| forest |
all |
0.978 |
0.095 |
0.307 |
0.410 |
2.509 |
0.440 |
3.264 |
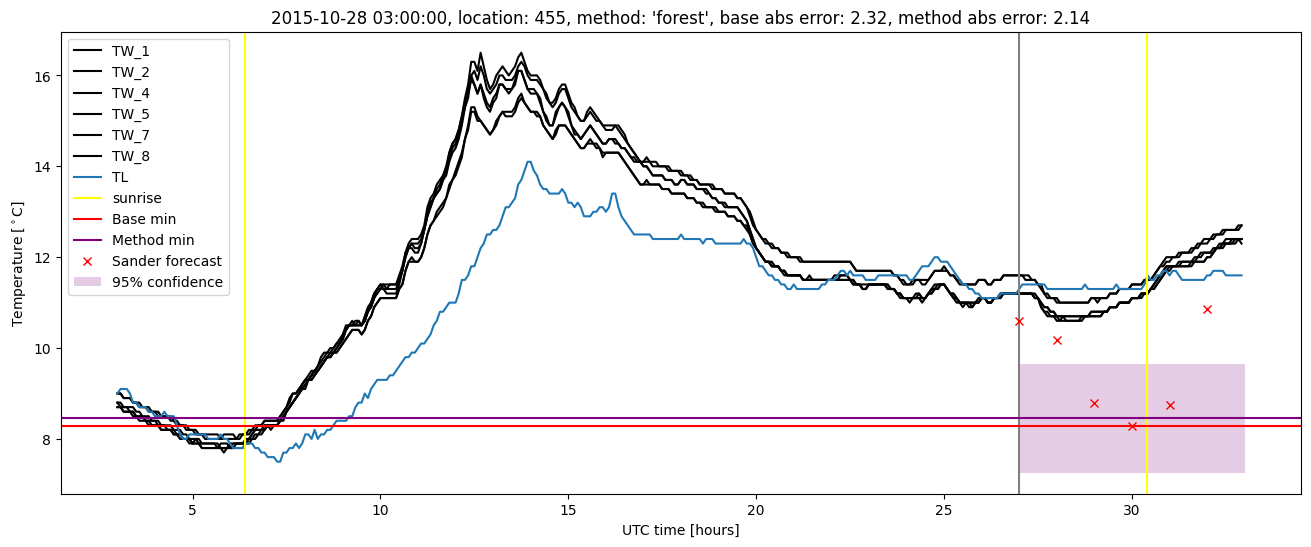
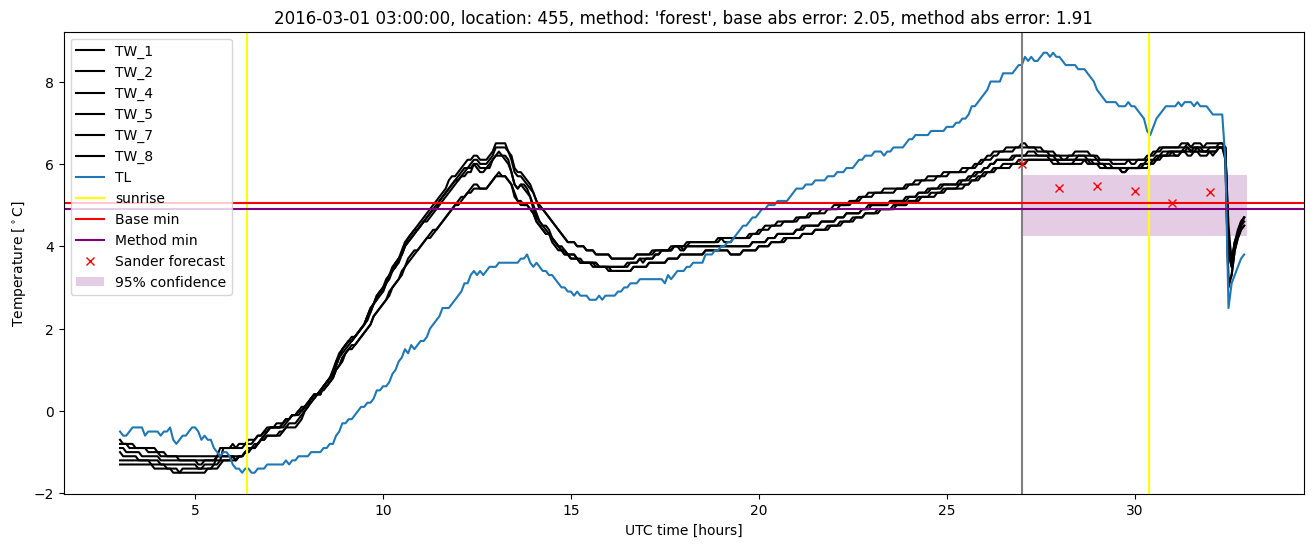
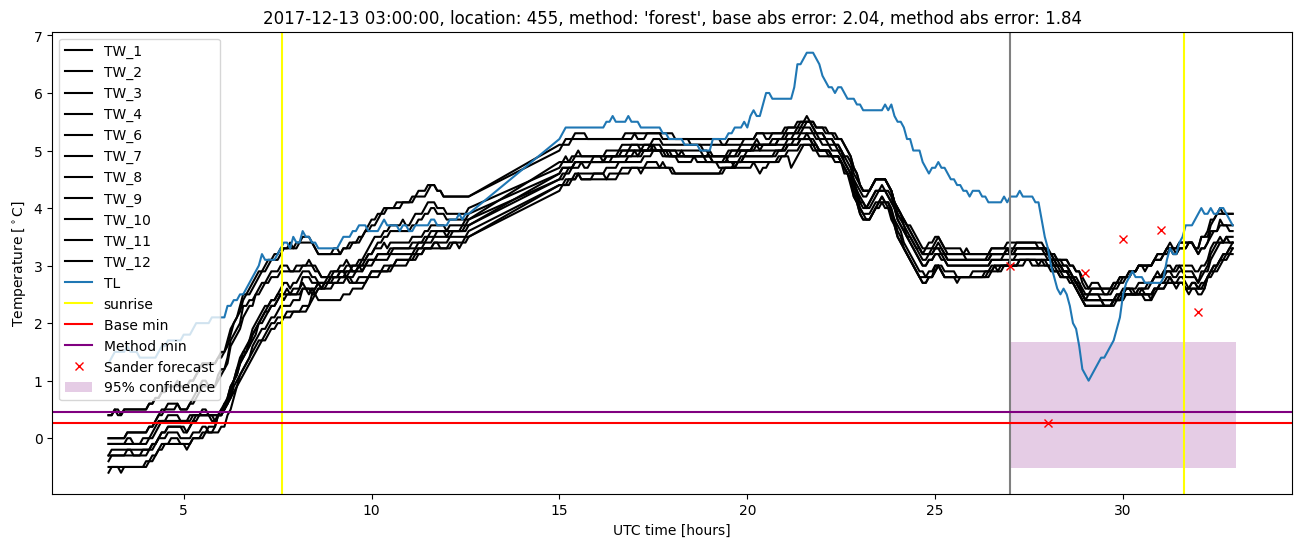
Random forest plots
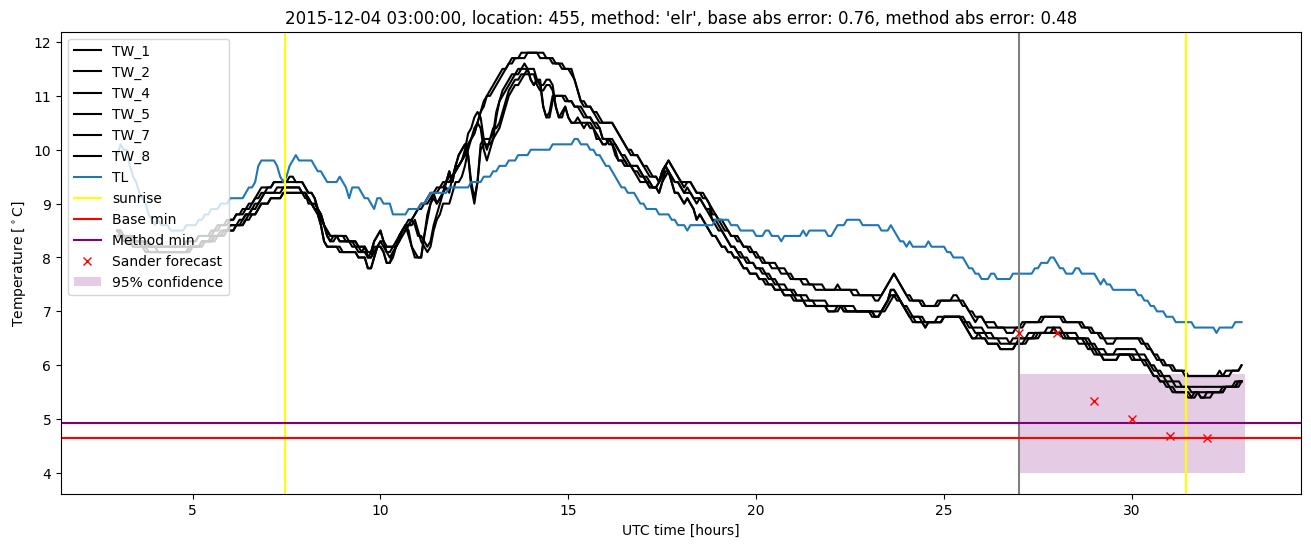
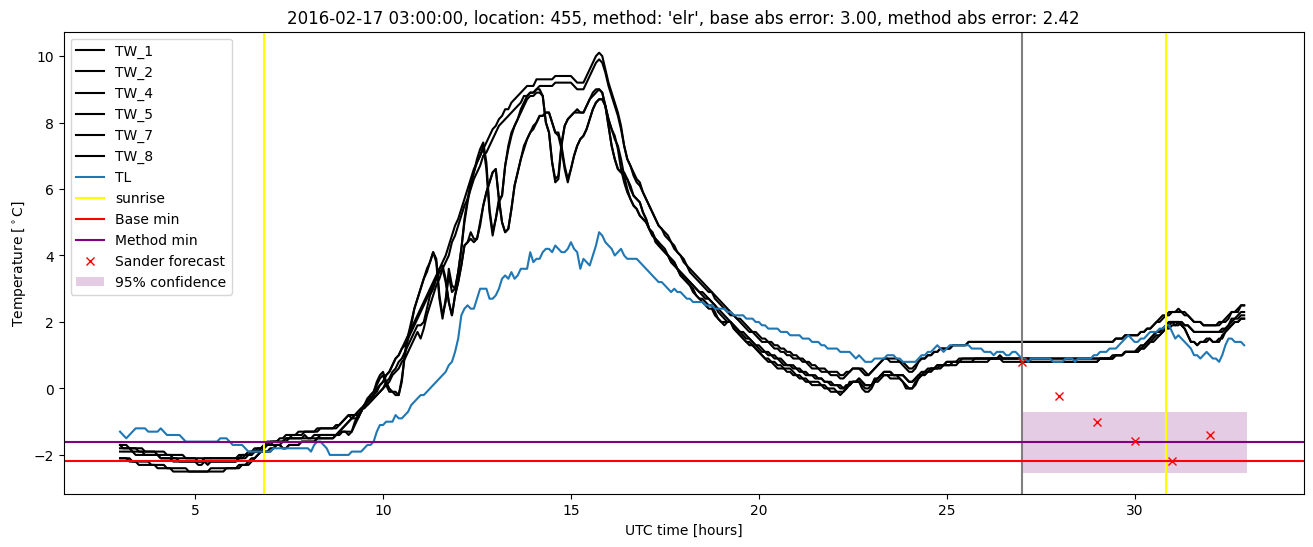
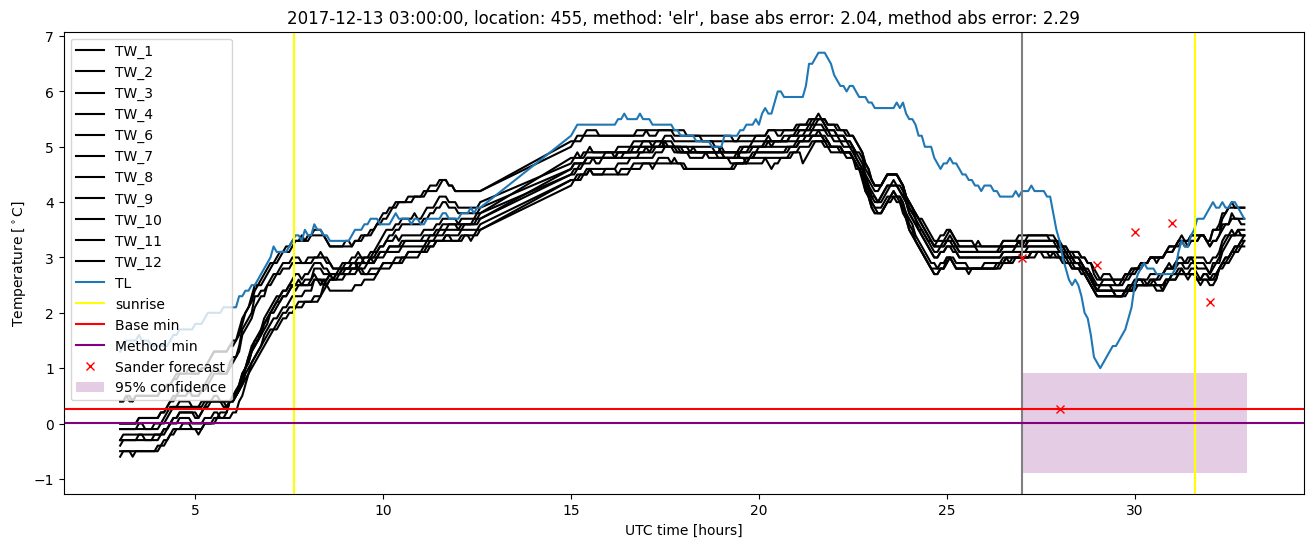
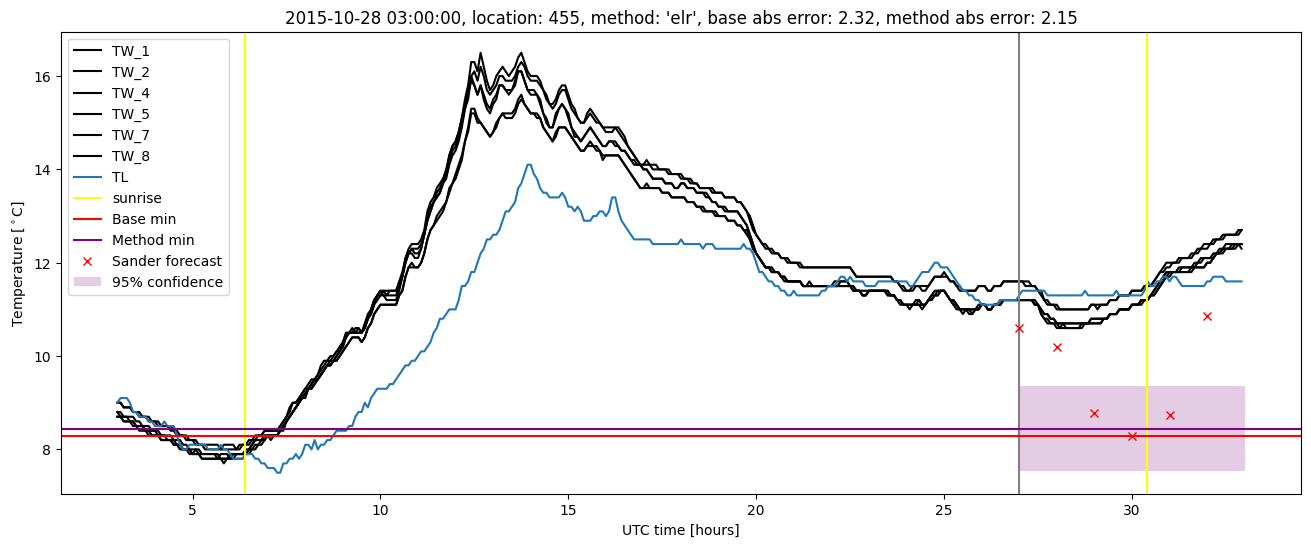
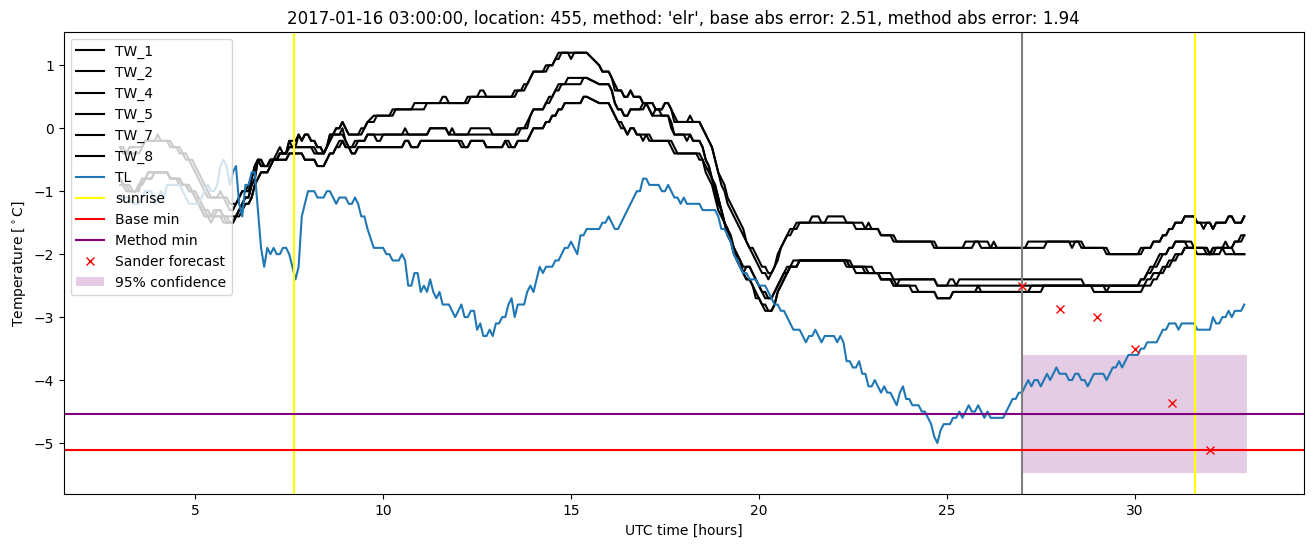
Extended logistic regression results
| names |
period |
power |
significance |
meanSquareError |
absError |
maxError |
CRPS |
IGN |
| baseline |
winter 2016 |
0.965 |
0.105 |
0.534 |
0.534 |
2.995 |
NaN |
NaN |
| elr |
winter 2016 |
0.971 |
0.000e+00 |
0.403 |
0.473 |
2.424 |
0.515 |
3.441 |
| baseline |
winter 2017 |
0.964 |
0.077 |
0.509 |
0.520 |
2.505 |
NaN |
NaN |
| elr |
winter 2017 |
0.955 |
0.077 |
0.315 |
0.418 |
1.940 |
0.485 |
2.821 |
| baseline |
winter 2018 |
0.993 |
0.146 |
0.386 |
0.460 |
2.072 |
NaN |
NaN |
| elr |
winter 2018 |
0.993 |
0.122 |
0.375 |
0.453 |
2.287 |
0.534 |
3.913 |
| baseline |
winter 2019 |
0.992 |
0.000e+00 |
0.364 |
0.446 |
2.013 |
NaN |
NaN |
| elr |
winter 2019 |
0.992 |
0.176 |
0.356 |
0.469 |
1.521 |
0.495 |
3.014 |
| baseline |
all |
0.978 |
0.095 |
0.452 |
0.492 |
2.995 |
NaN |
NaN |
| elr |
all |
0.978 |
0.095 |
0.365 |
0.454 |
2.424 |
0.509 |
3.332 |
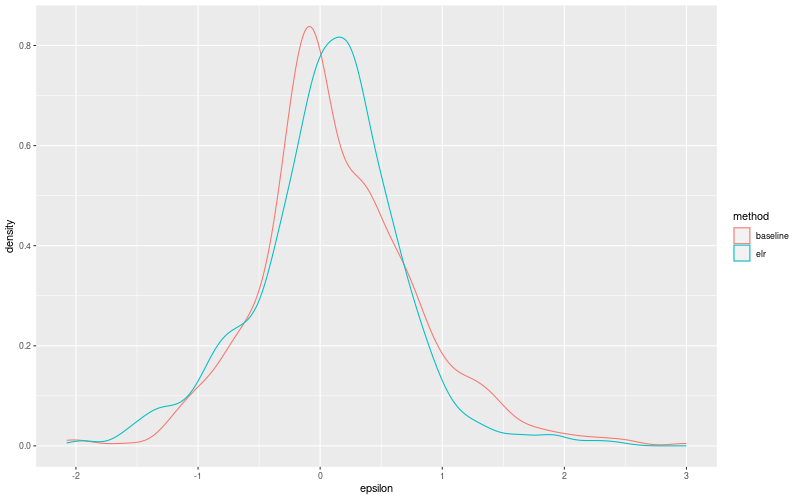
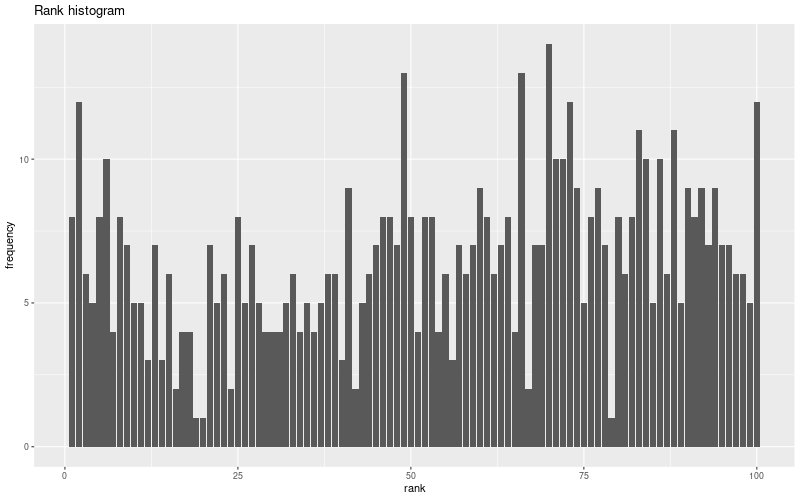
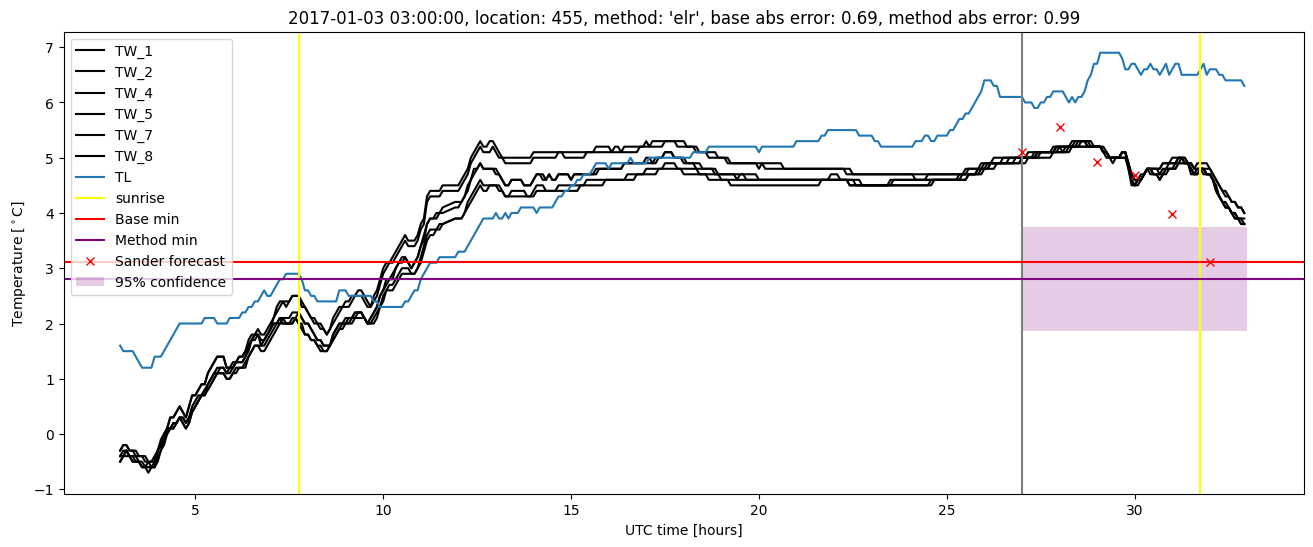
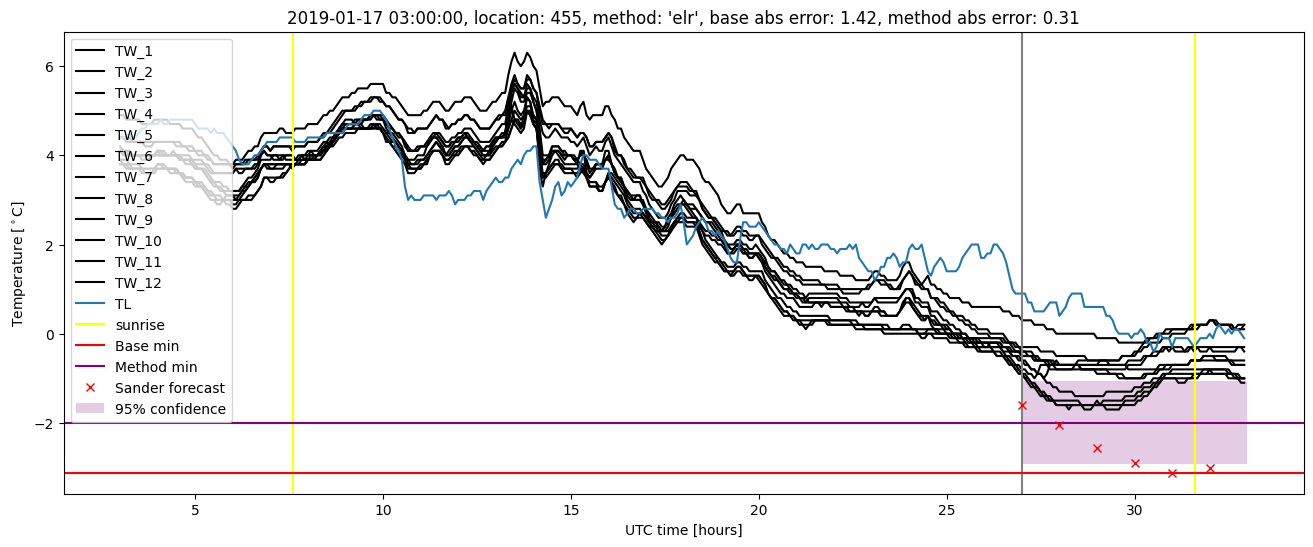
Extended logistic regression plots