GMS location: 454
Random forest results
| names |
period |
power |
significance |
meanSquareError |
absError |
maxError |
CRPS |
IGN |
| baseline |
winter 2016 |
0.983 |
0.133 |
1.013 |
0.684 |
4.398 |
NaN |
NaN |
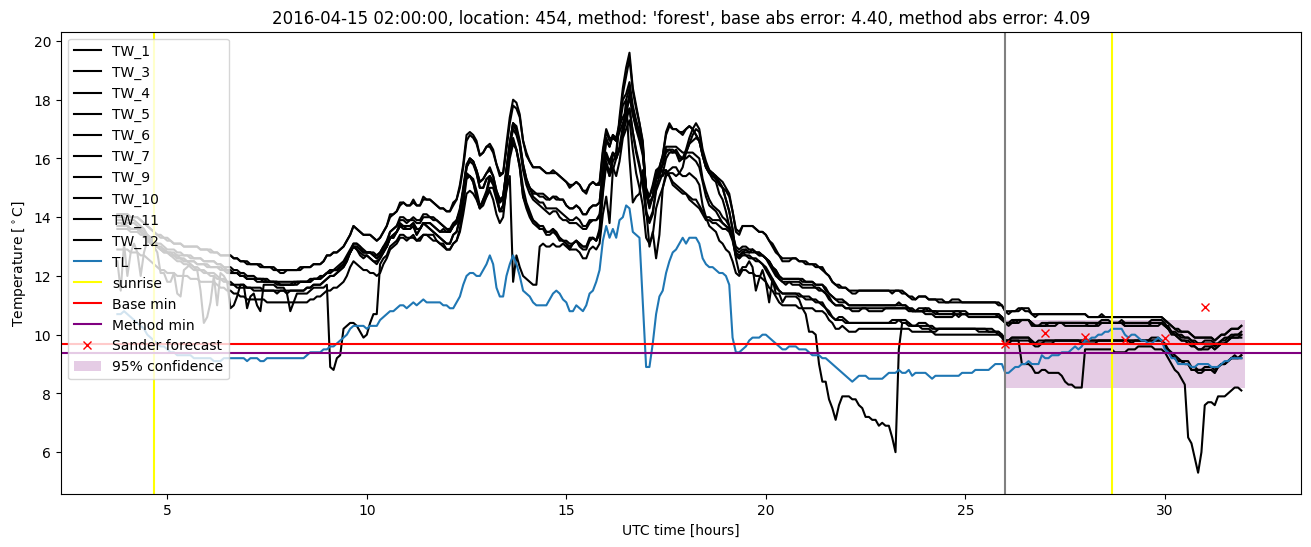
| forest |
winter 2016 |
0.994 |
0.133 |
0.916 |
0.630 |
4.091 |
0.498 |
2.864 |
| baseline |
winter 2017 |
0.981 |
0.065 |
0.533 |
0.515 |
3.499 |
NaN |
NaN |
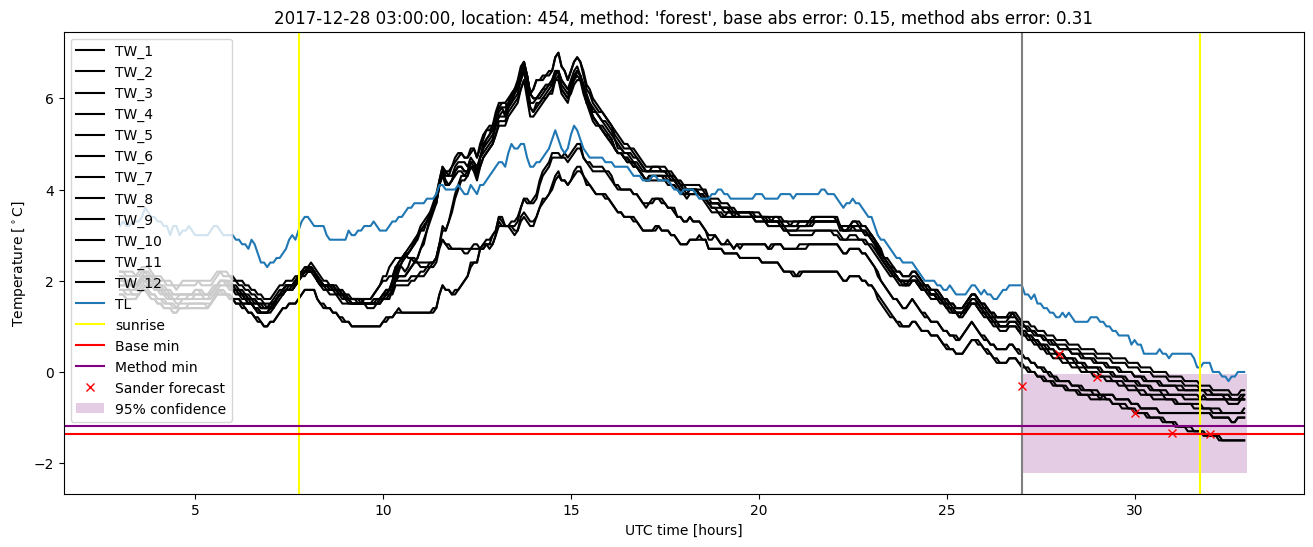
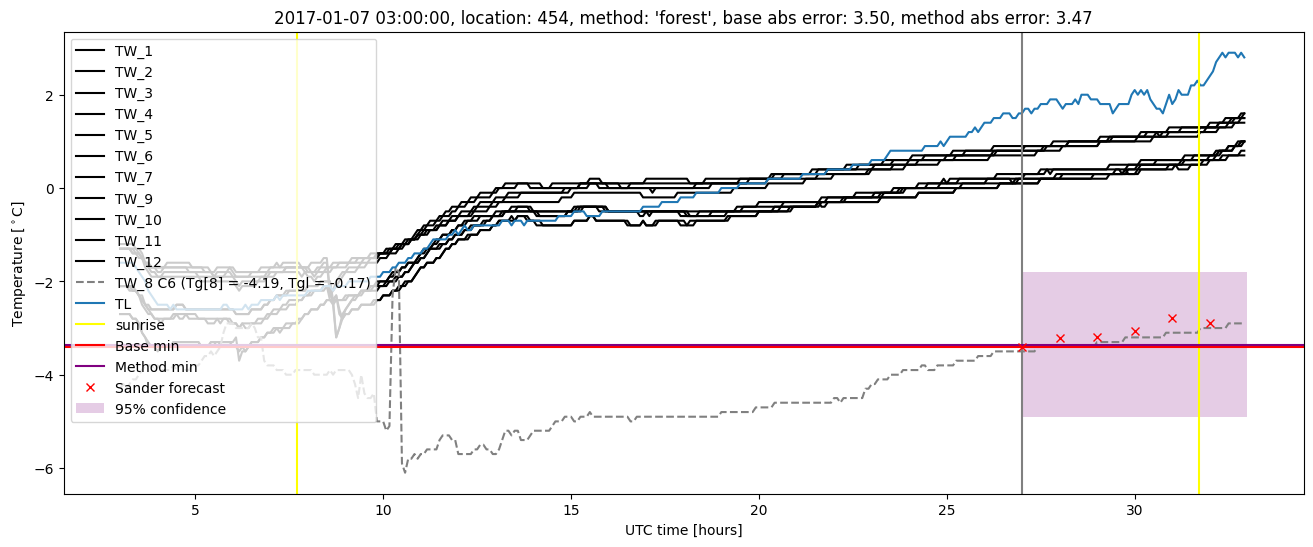
| forest |
winter 2017 |
0.981 |
0.043 |
0.508 |
0.513 |
3.472 |
0.499 |
1.675 |
| baseline |
winter 2018 |
0.991 |
0.029 |
0.368 |
0.447 |
2.039 |
NaN |
NaN |
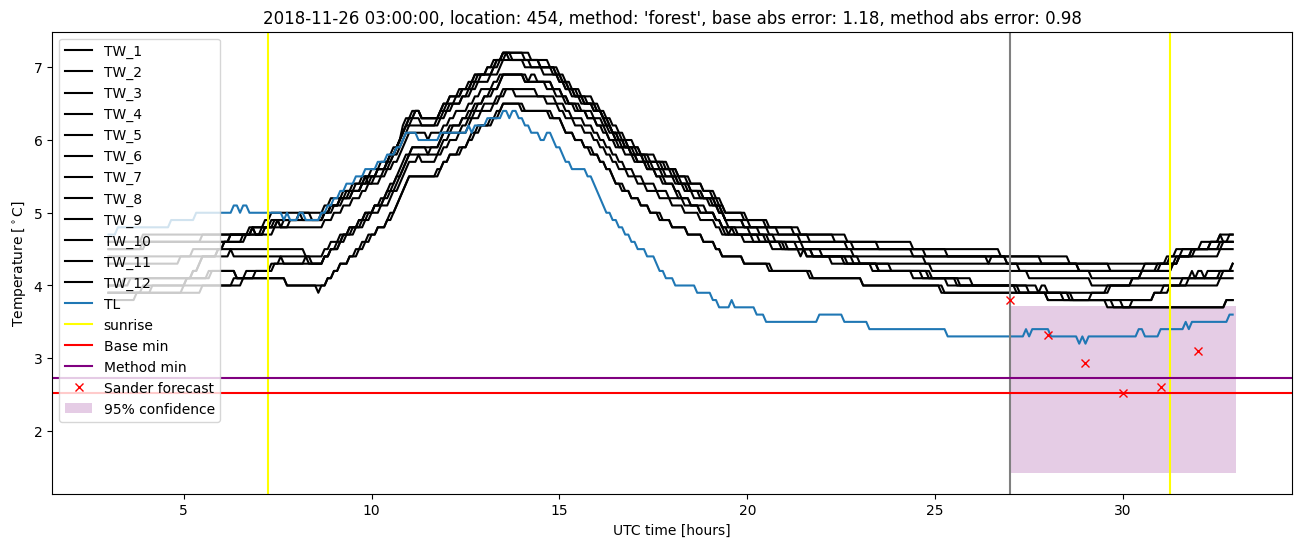
| forest |
winter 2018 |
0.983 |
0.000e+00 |
0.320 |
0.433 |
1.868 |
0.509 |
1.402 |
| baseline |
winter 2019 |
0.992 |
0.062 |
0.322 |
0.394 |
2.206 |
NaN |
NaN |
| forest |
winter 2019 |
0.992 |
0.000e+00 |
0.277 |
0.384 |
1.711 |
0.500 |
1.421 |
| baseline |
all |
0.987 |
0.071 |
0.598 |
0.525 |
4.398 |
NaN |
NaN |
| forest |
all |
0.989 |
0.048 |
0.541 |
0.502 |
4.091 |
0.501 |
1.929 |
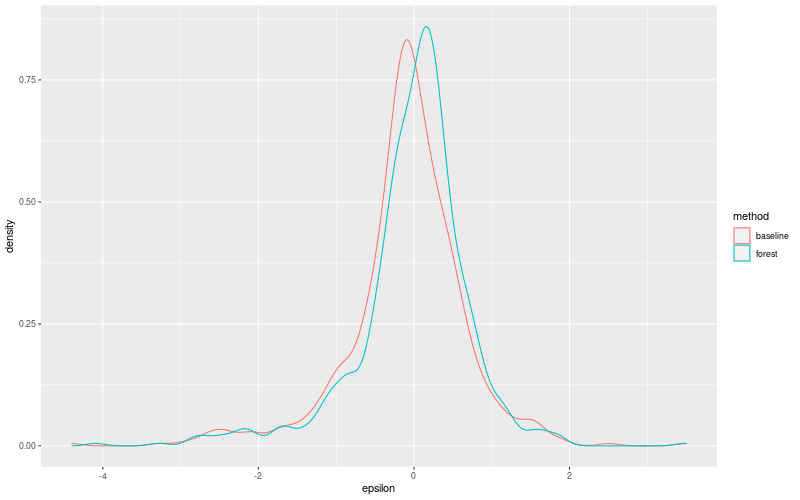
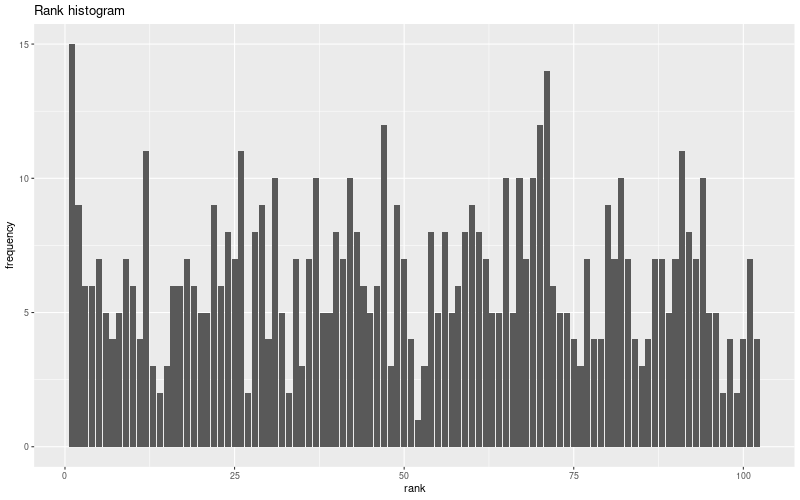
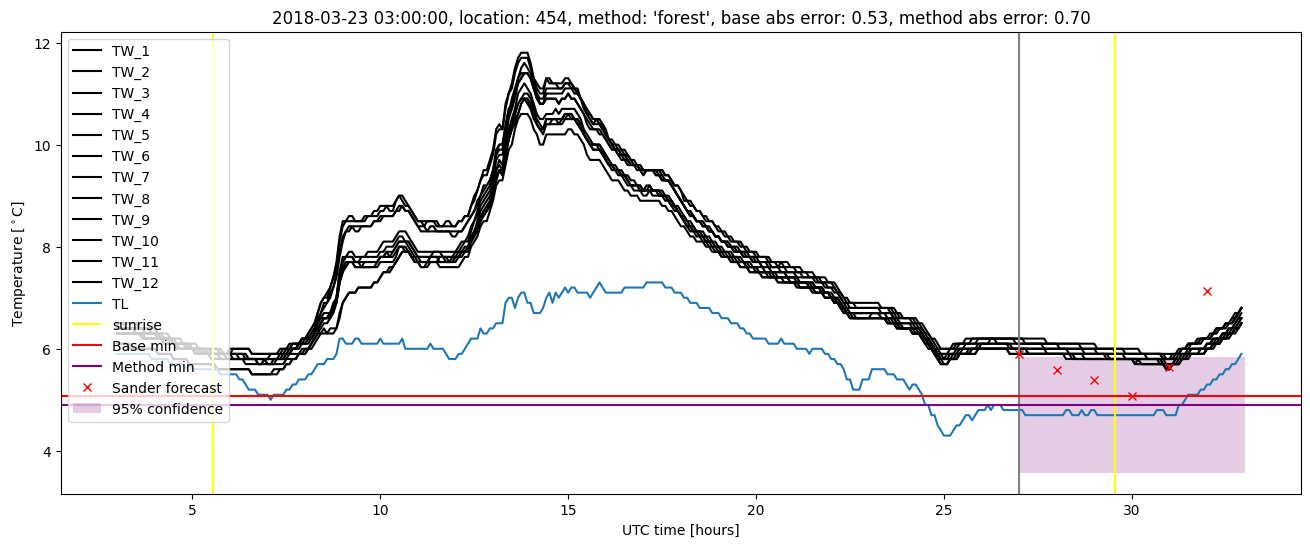
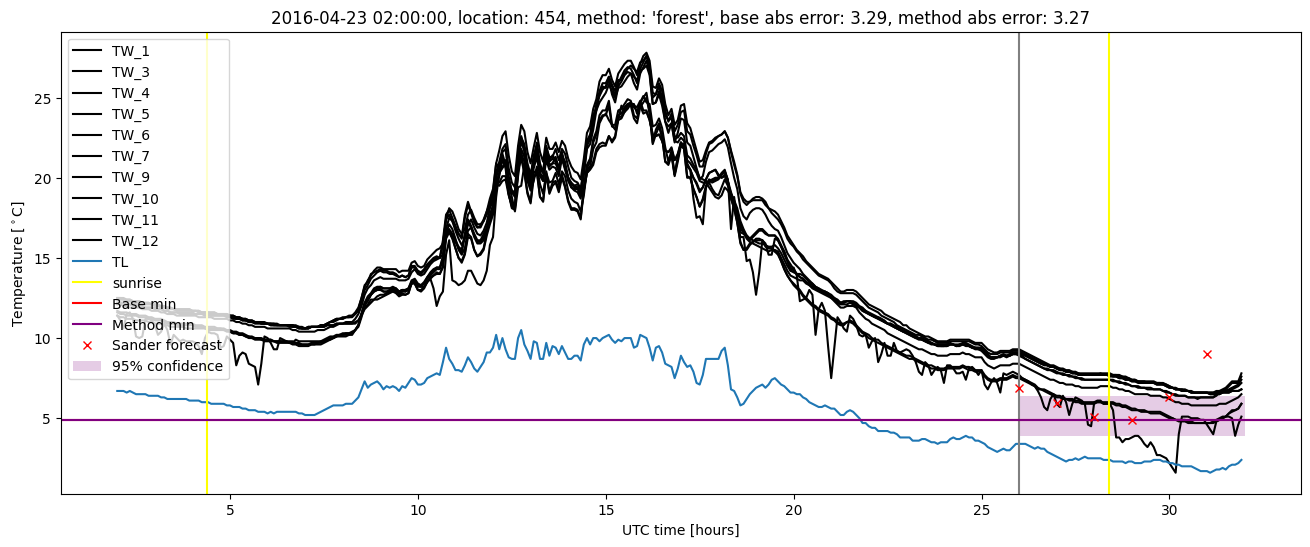
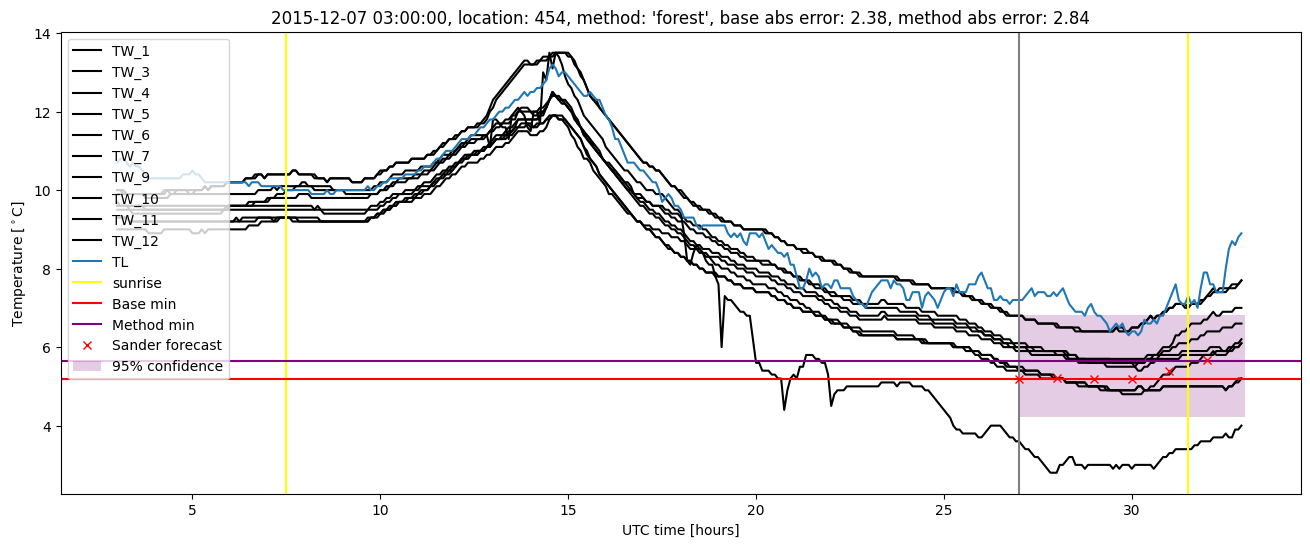
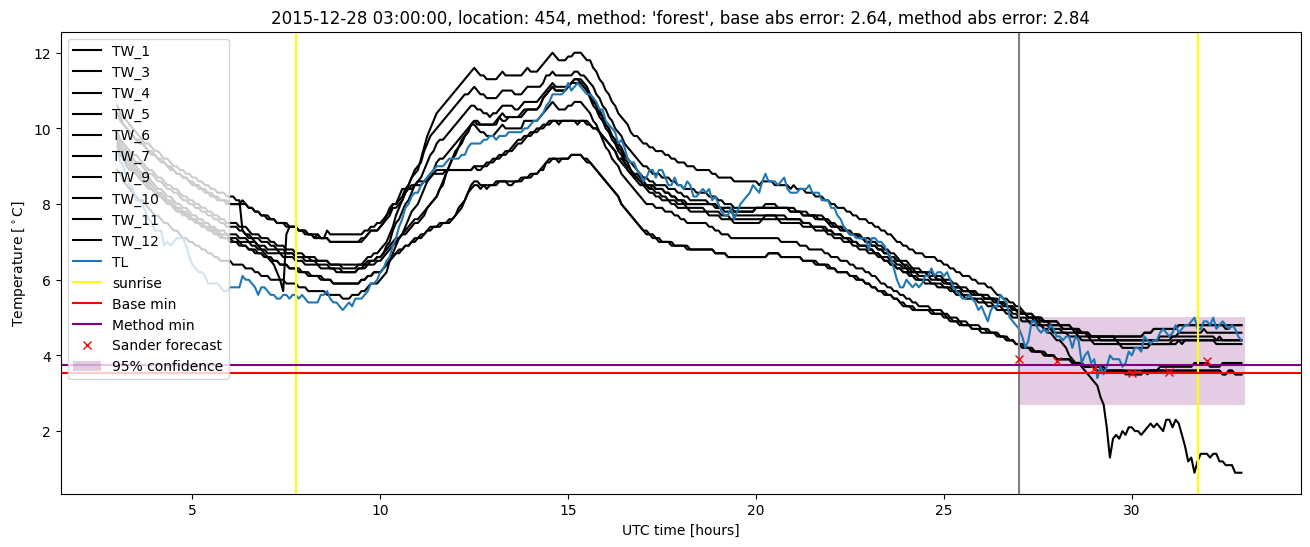
Random forest plots
Extended logistic regression results
| names |
period |
power |
significance |
meanSquareError |
absError |
maxError |
CRPS |
IGN |
| baseline |
winter 2016 |
0.983 |
0.133 |
1.013 |
0.684 |
4.398 |
NaN |
NaN |
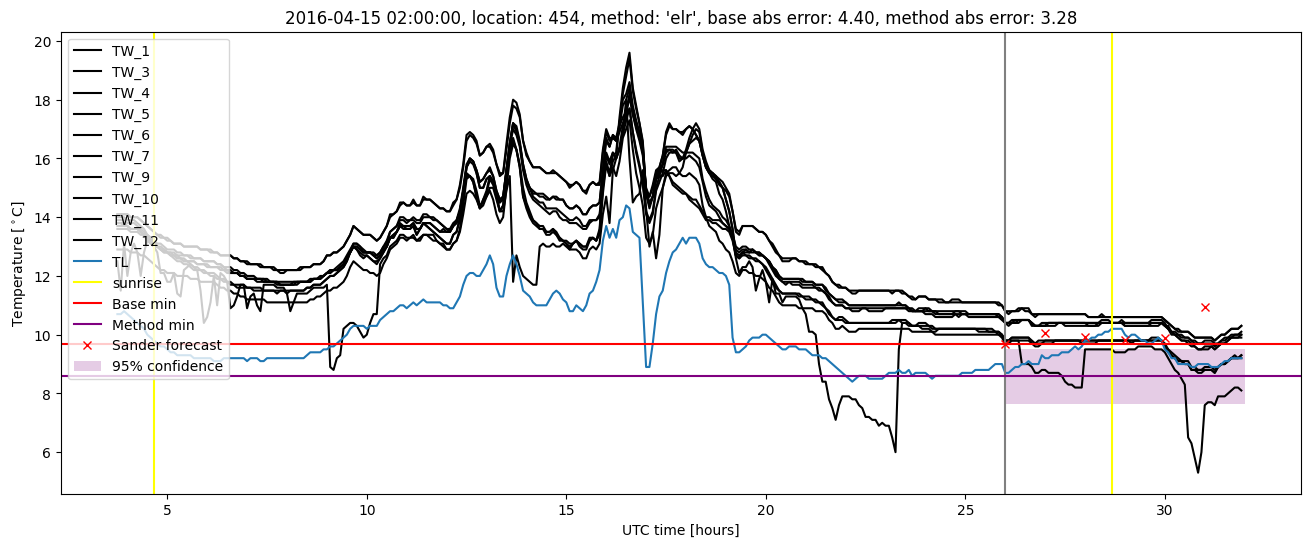
| elr |
winter 2016 |
0.989 |
0.133 |
0.871 |
0.634 |
3.282 |
0.589 |
3.936 |
| baseline |
winter 2017 |
0.981 |
0.065 |
0.533 |
0.515 |
3.499 |
NaN |
NaN |
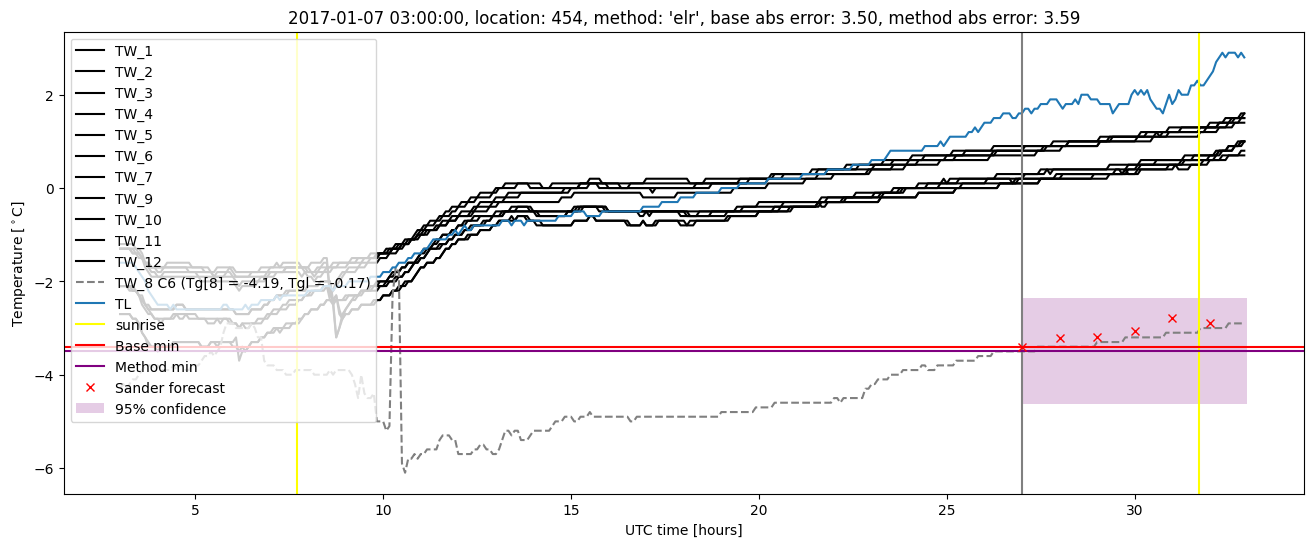
| elr |
winter 2017 |
0.981 |
0.043 |
0.526 |
0.549 |
3.588 |
0.573 |
2.223 |
| baseline |
winter 2018 |
0.991 |
0.029 |
0.368 |
0.447 |
2.039 |
NaN |
NaN |
| elr |
winter 2018 |
0.991 |
0.029 |
0.319 |
0.434 |
1.681 |
0.573 |
1.880 |
| baseline |
winter 2019 |
0.992 |
0.062 |
0.322 |
0.394 |
2.206 |
NaN |
NaN |
| elr |
winter 2019 |
1.000 |
0.000e+00 |
0.295 |
0.390 |
1.777 |
0.526 |
1.709 |
| baseline |
all |
0.987 |
0.071 |
0.598 |
0.525 |
4.398 |
NaN |
NaN |
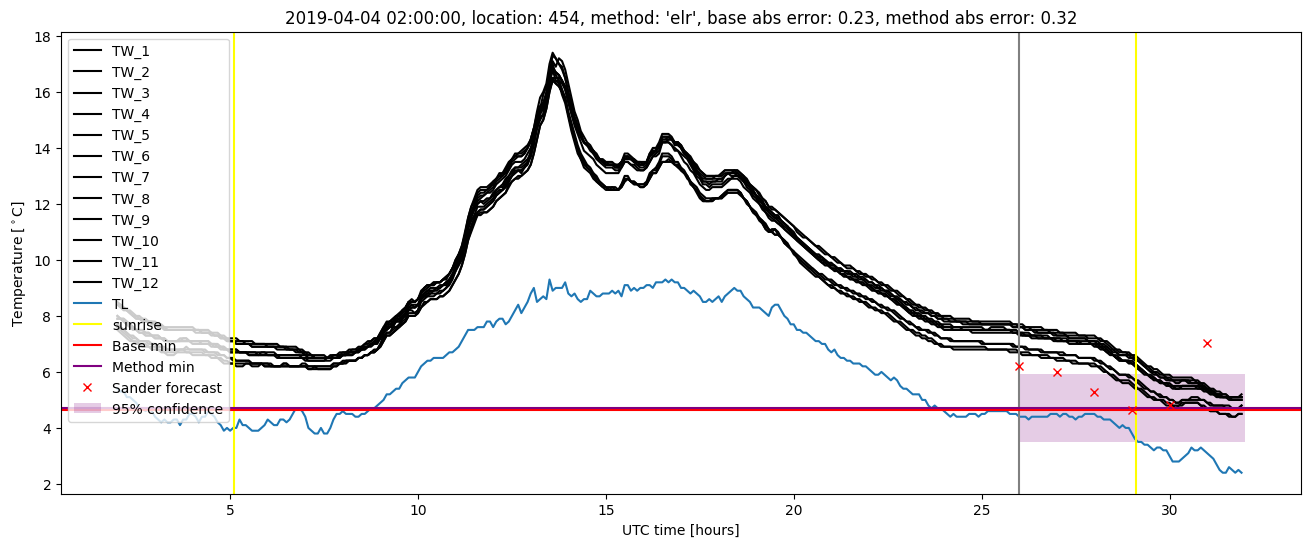
| elr |
all |
0.991 |
0.056 |
0.535 |
0.514 |
3.588 |
0.567 |
2.566 |
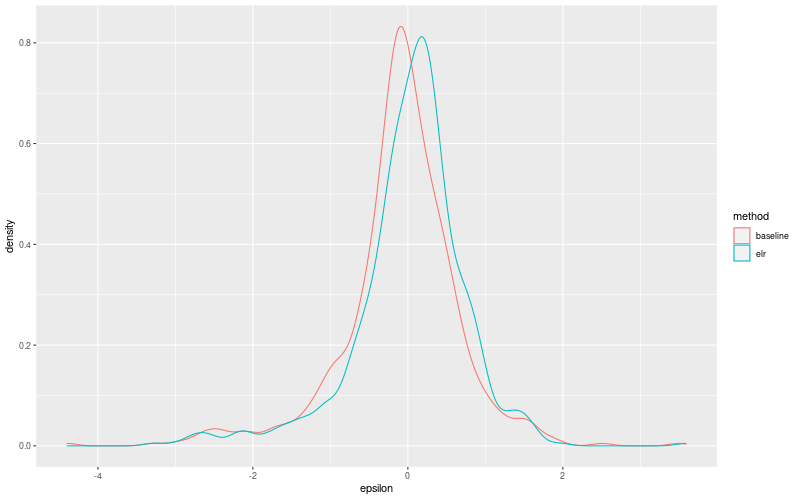
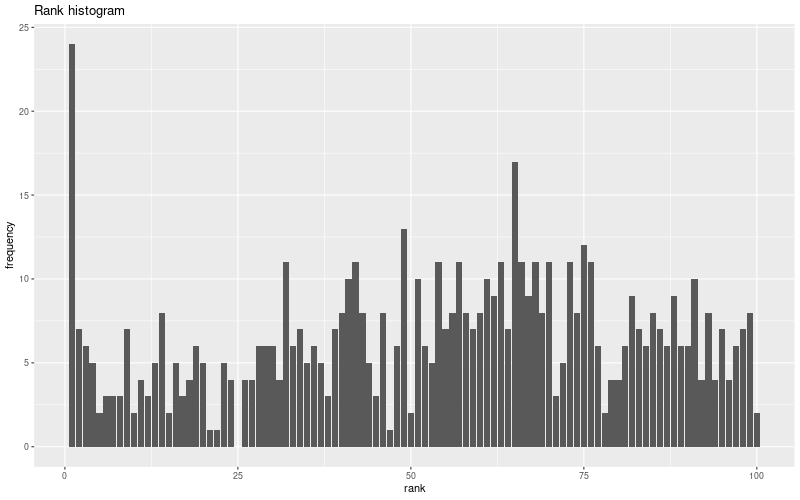
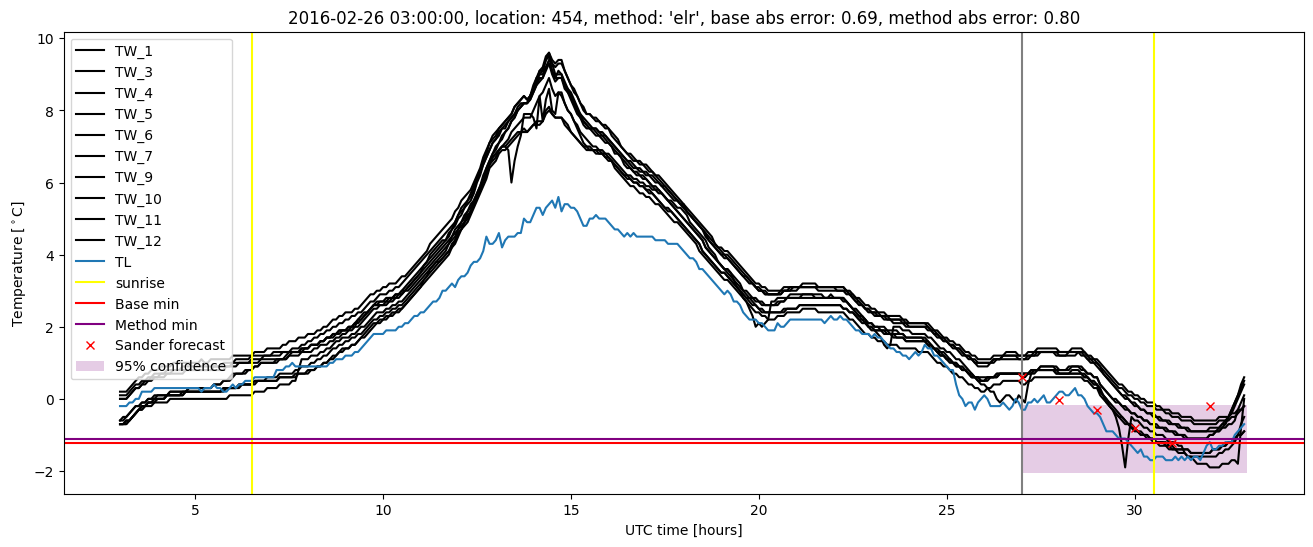
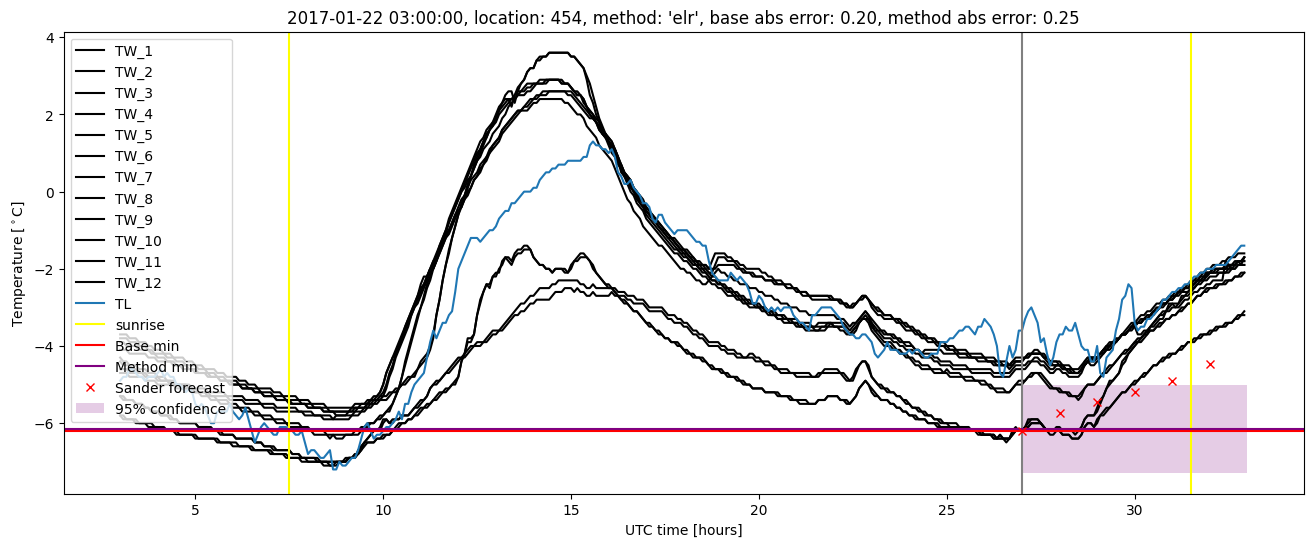
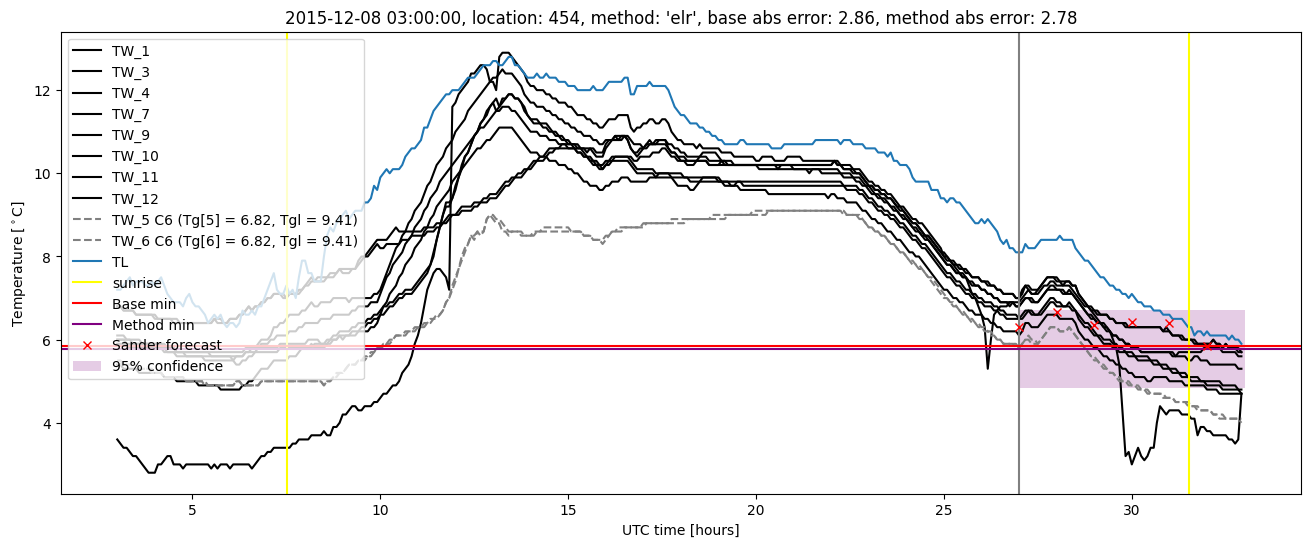
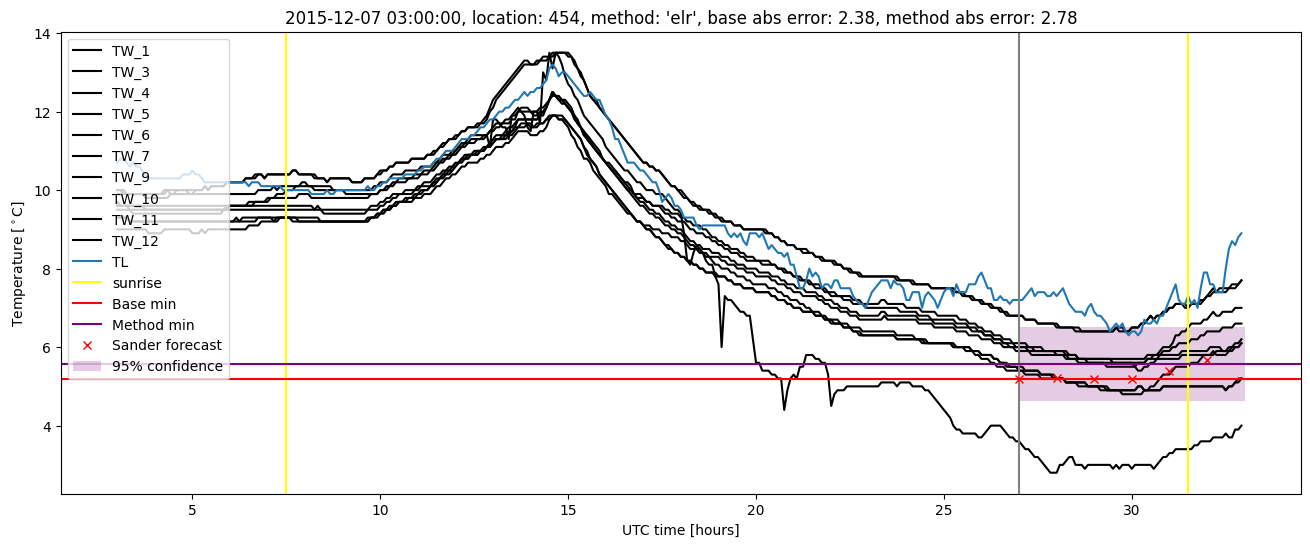
Extended logistic regression plots