GMS location: 453
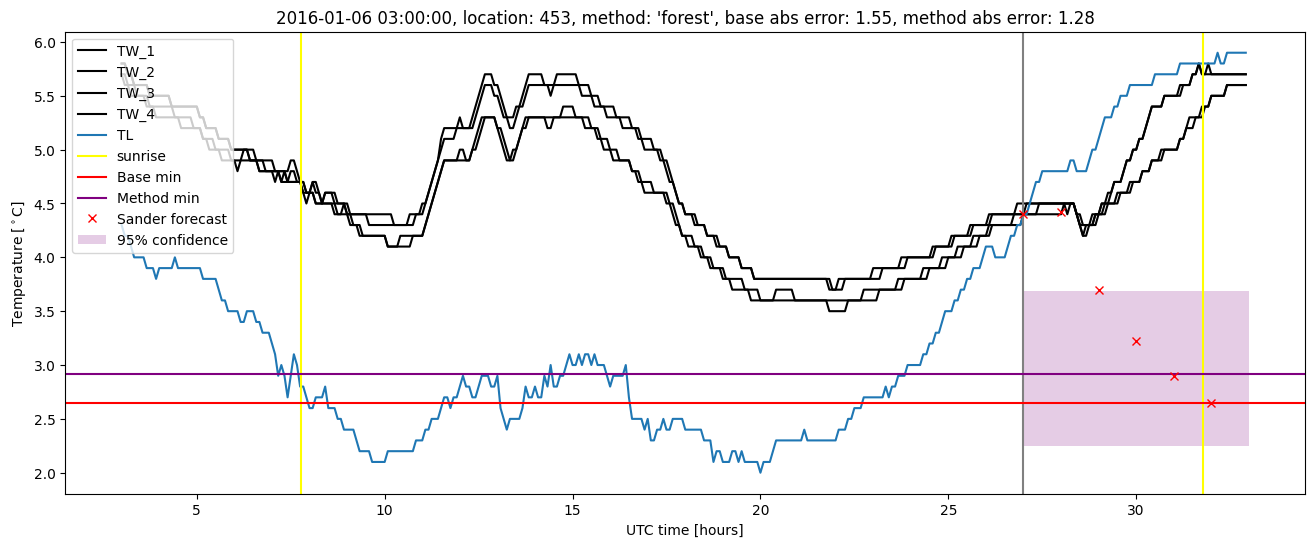
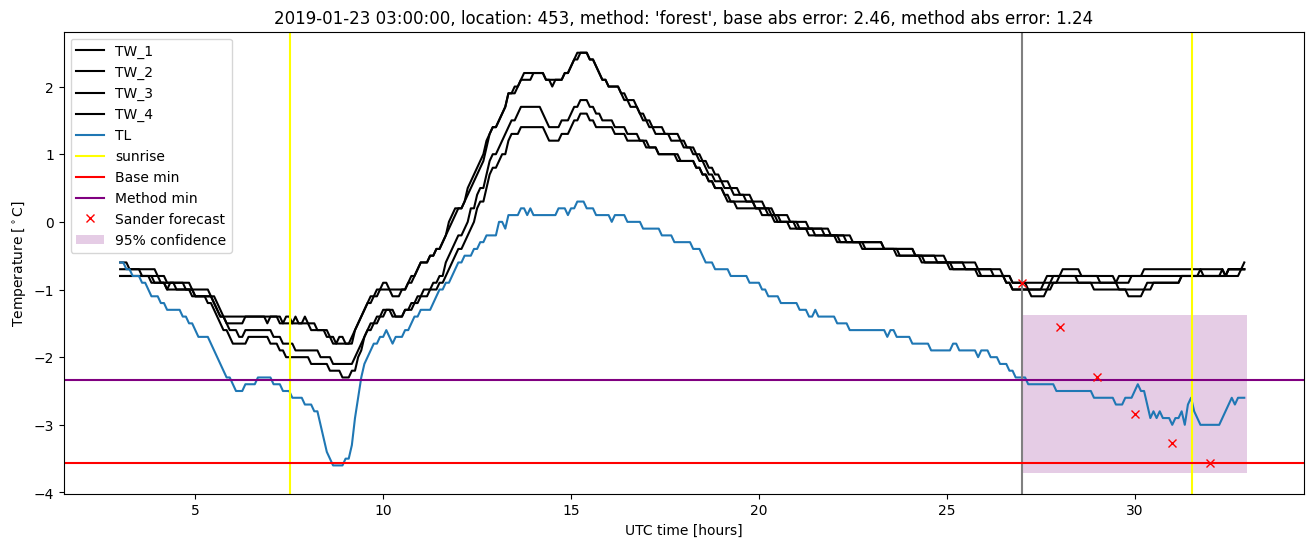
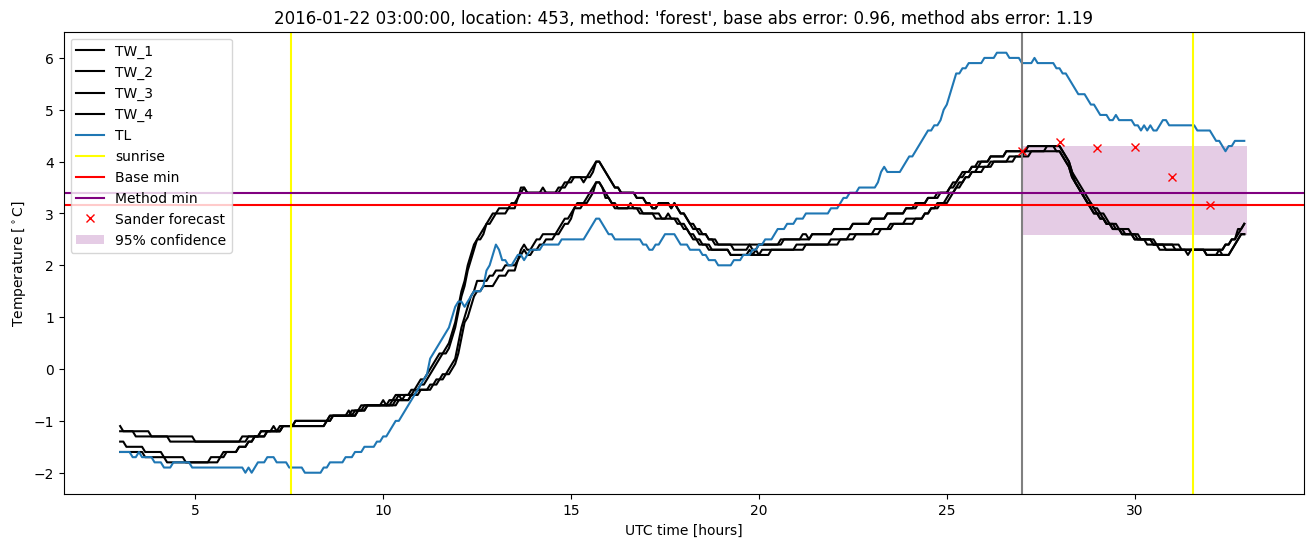
Random forest results
| names |
period |
power |
significance |
meanSquareError |
absError |
maxError |
CRPS |
IGN |
| baseline |
winter 2016 |
0.977 |
0.143 |
0.354 |
0.463 |
1.839 |
NaN |
NaN |
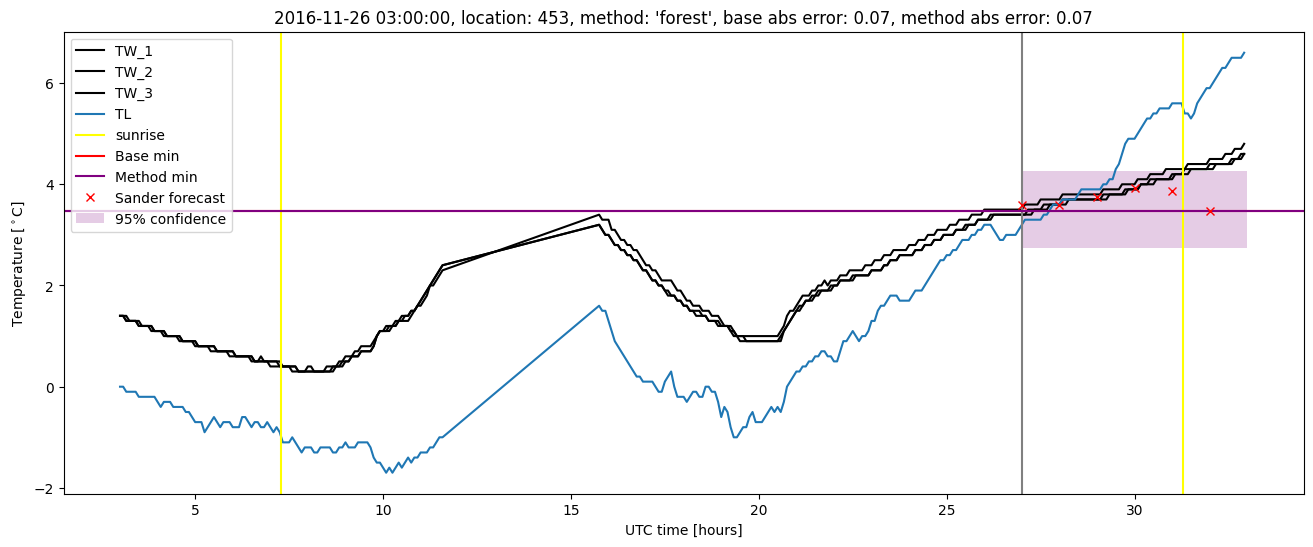
| forest |
winter 2016 |
0.994 |
0.143 |
0.232 |
0.373 |
1.471 |
0.437 |
7.321 |
| baseline |
winter 2017 |
0.976 |
0.103 |
0.385 |
0.456 |
2.186 |
NaN |
NaN |
| forest |
winter 2017 |
0.976 |
0.172 |
0.215 |
0.354 |
1.137 |
0.432 |
4.546 |
| baseline |
winter 2018 |
1.000 |
NaN |
0.245 |
0.360 |
1.272 |
NaN |
NaN |
| forest |
winter 2018 |
1.000 |
NaN |
0.190 |
0.328 |
1.038 |
0.432 |
3.355 |
| baseline |
winter 2019 |
0.990 |
0.000e+00 |
0.330 |
0.420 |
2.457 |
NaN |
NaN |
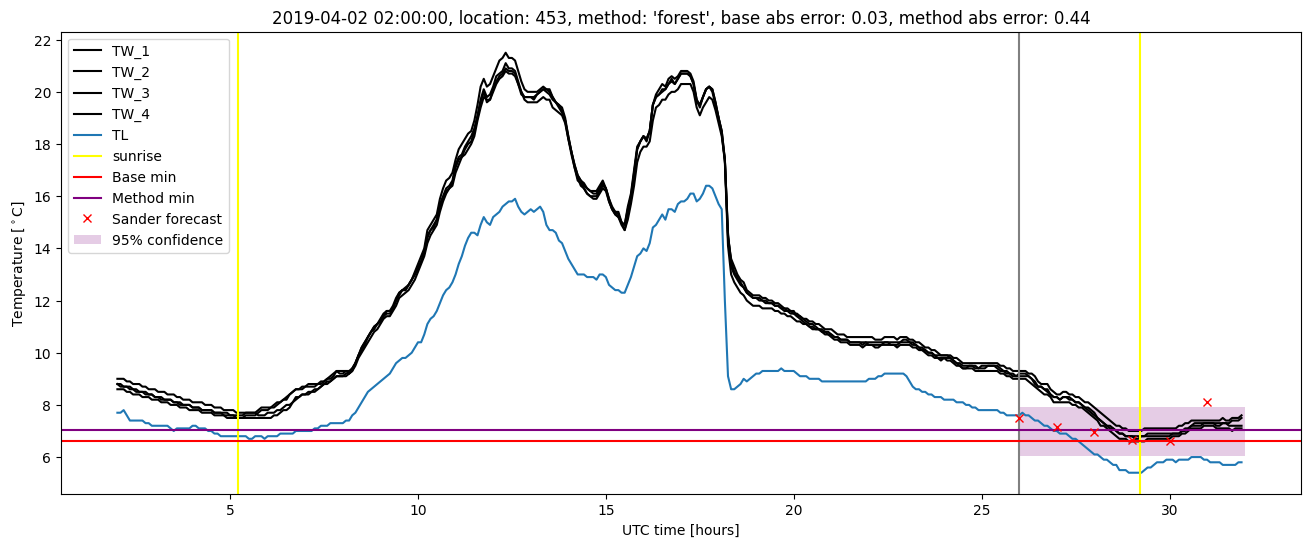
| forest |
winter 2019 |
1.000 |
0.077 |
0.212 |
0.353 |
1.238 |
0.426 |
4.786 |
| baseline |
all |
0.981 |
0.089 |
0.351 |
0.444 |
2.457 |
NaN |
NaN |
| forest |
all |
0.991 |
0.143 |
0.219 |
0.359 |
1.471 |
0.432 |
5.593 |
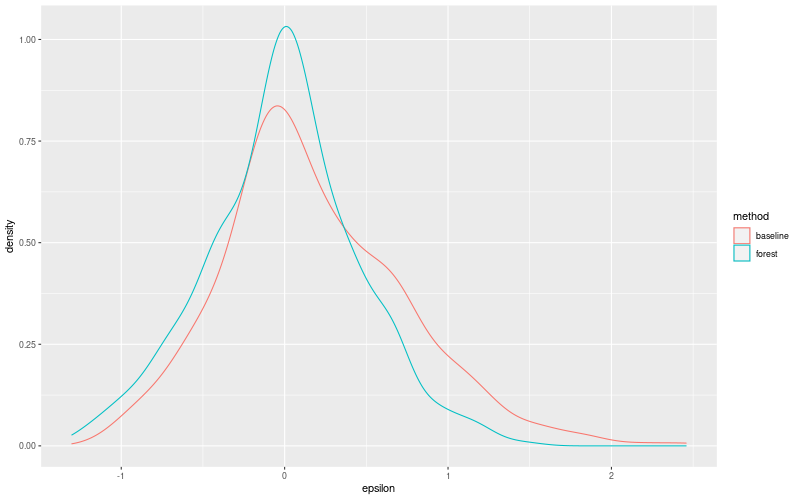
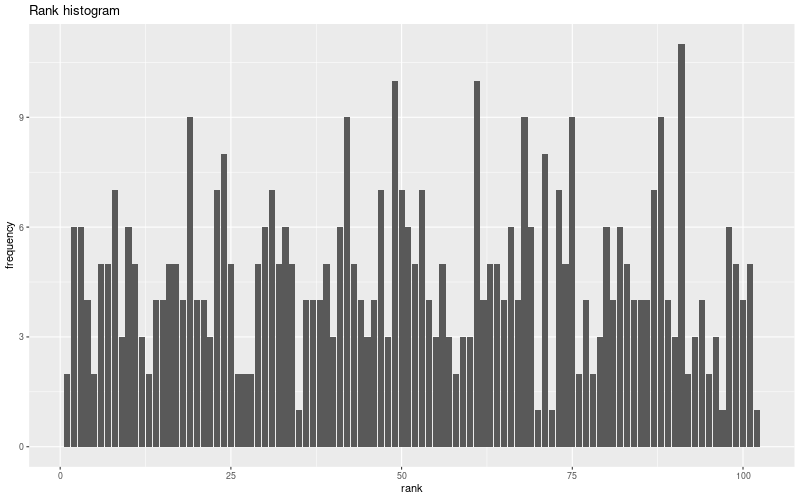
Random forest plots

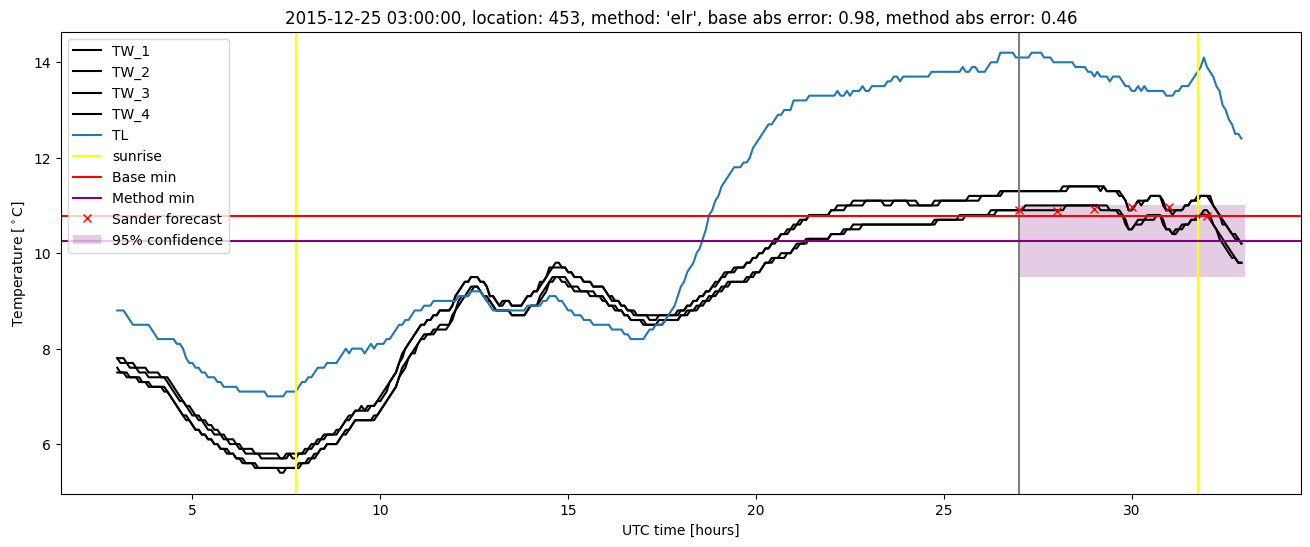
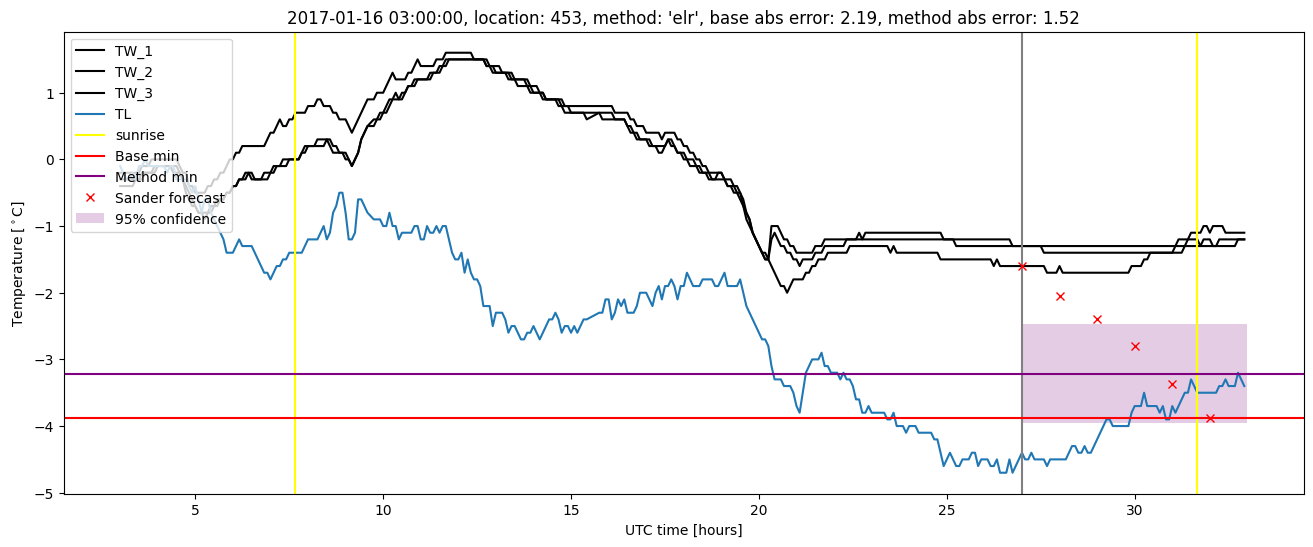
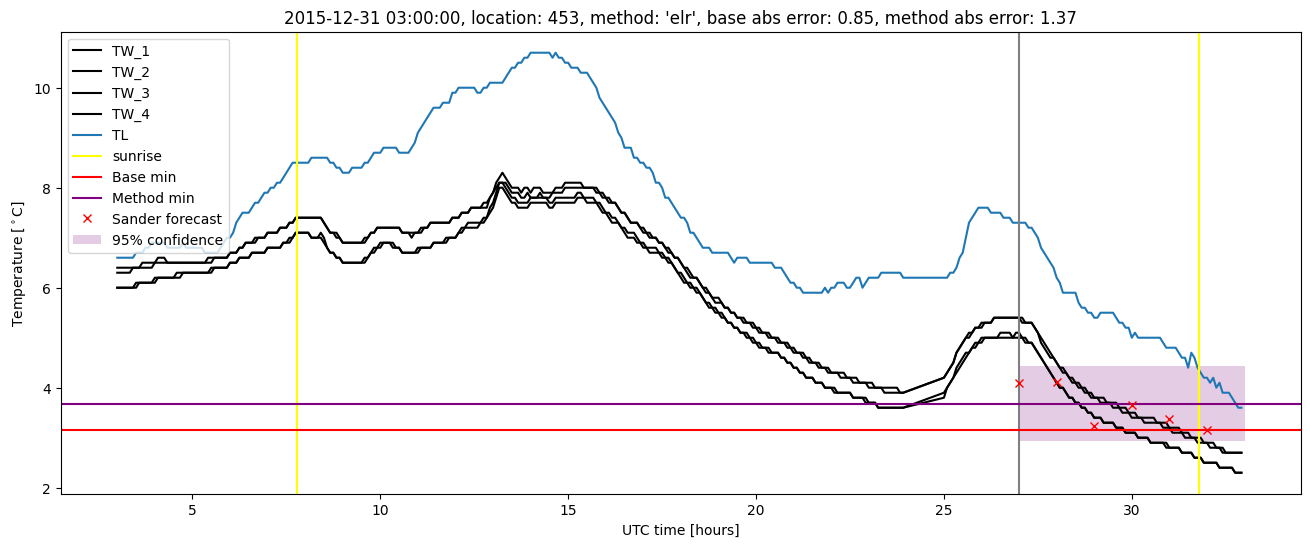
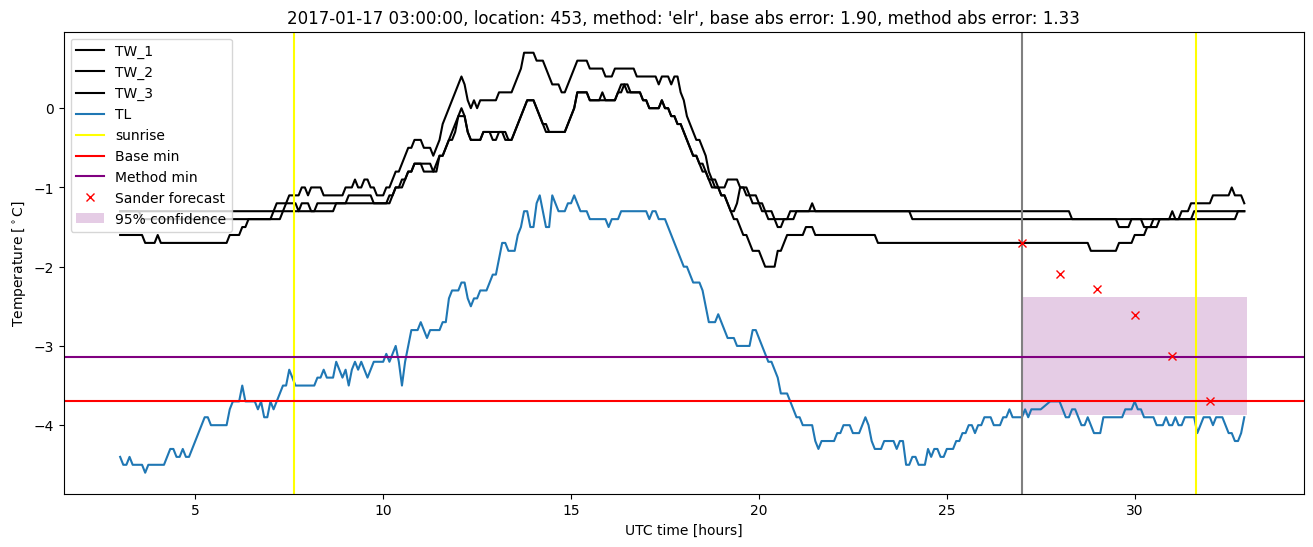
Extended logistic regression results
| names |
period |
power |
significance |
meanSquareError |
absError |
maxError |
CRPS |
IGN |
| baseline |
winter 2016 |
0.977 |
0.143 |
0.354 |
0.463 |
1.839 |
NaN |
NaN |
| elr |
winter 2016 |
0.988 |
0.143 |
0.270 |
0.423 |
1.374 |
0.509 |
6.564 |
| baseline |
winter 2017 |
0.976 |
0.103 |
0.385 |
0.456 |
2.186 |
NaN |
NaN |
| elr |
winter 2017 |
0.984 |
0.103 |
0.234 |
0.363 |
1.522 |
0.496 |
6.582 |
| baseline |
winter 2018 |
1.000 |
NaN |
0.245 |
0.360 |
1.272 |
NaN |
NaN |
| elr |
winter 2018 |
1.000 |
NaN |
0.195 |
0.336 |
1.182 |
0.504 |
6.681 |
| baseline |
winter 2019 |
0.990 |
0.000e+00 |
0.330 |
0.420 |
2.457 |
NaN |
NaN |
| elr |
winter 2019 |
1.000 |
0.077 |
0.239 |
0.384 |
1.278 |
0.507 |
6.456 |
| baseline |
all |
0.981 |
0.089 |
0.351 |
0.444 |
2.457 |
NaN |
NaN |
| elr |
all |
0.991 |
0.107 |
0.246 |
0.389 |
1.522 |
0.504 |
6.553 |
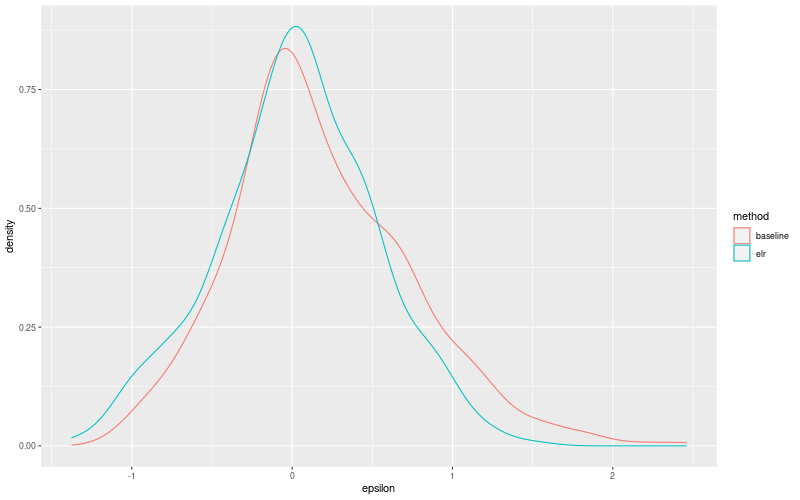
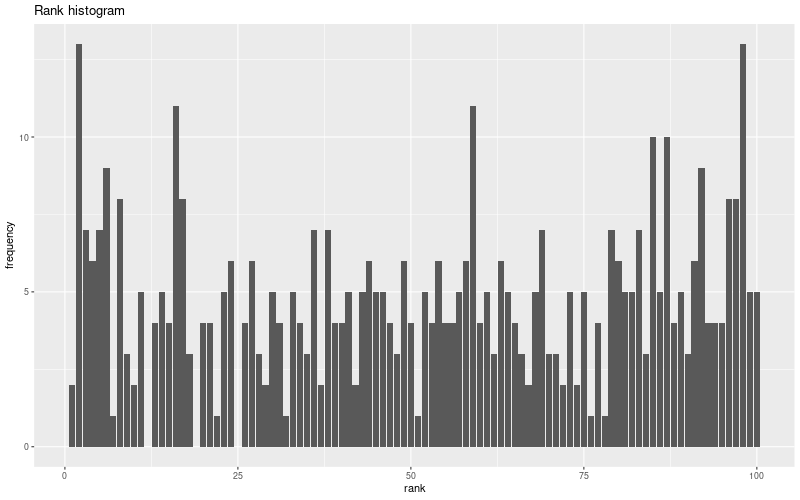
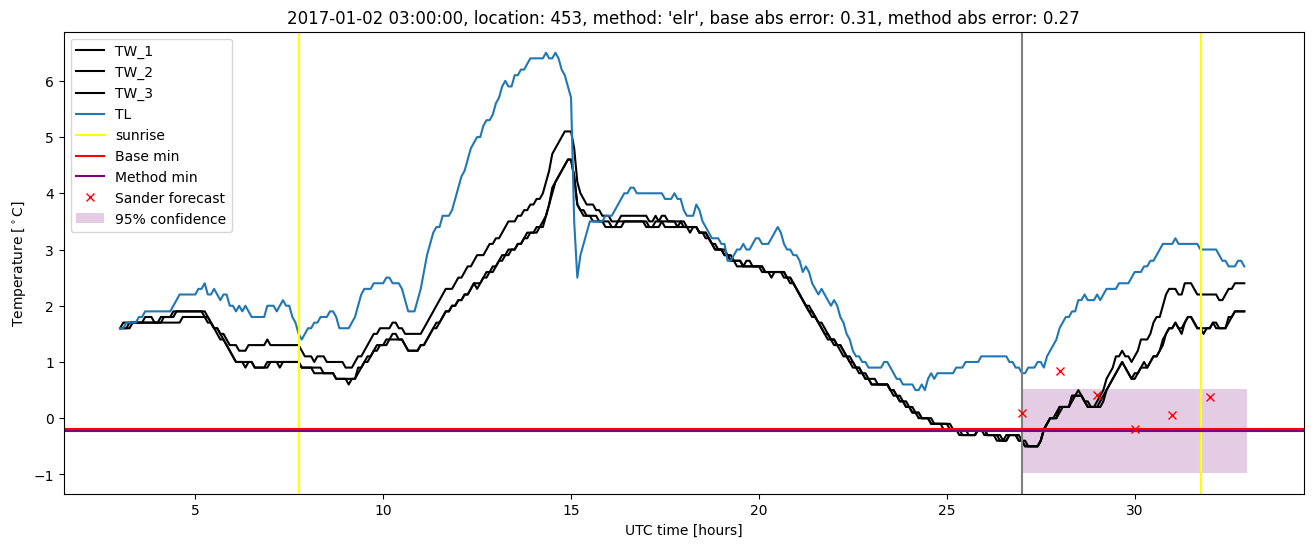
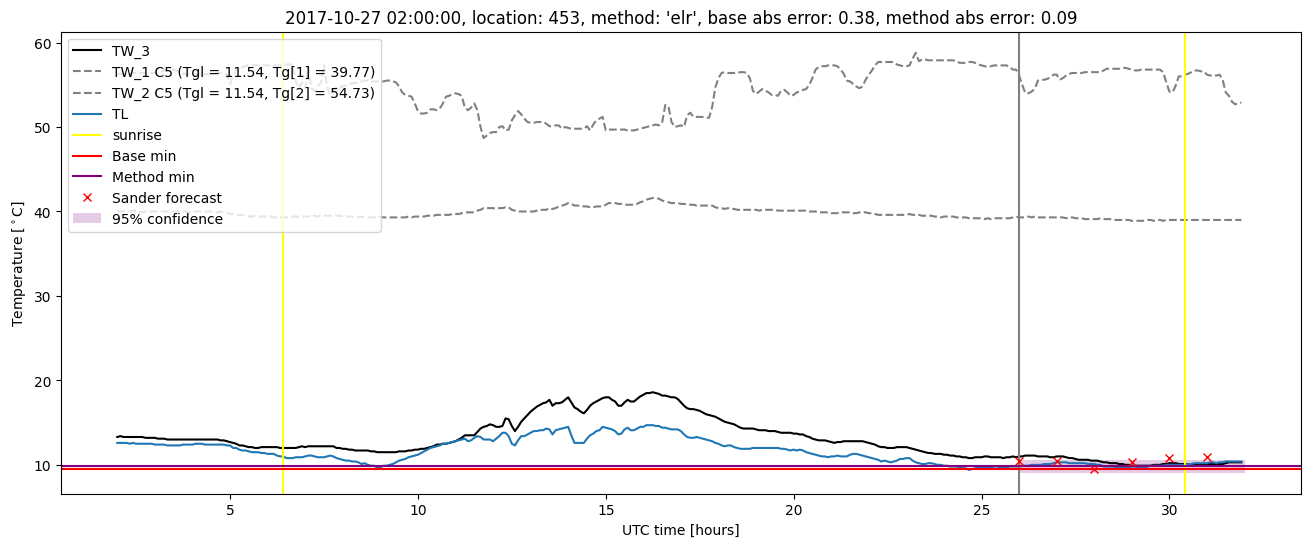
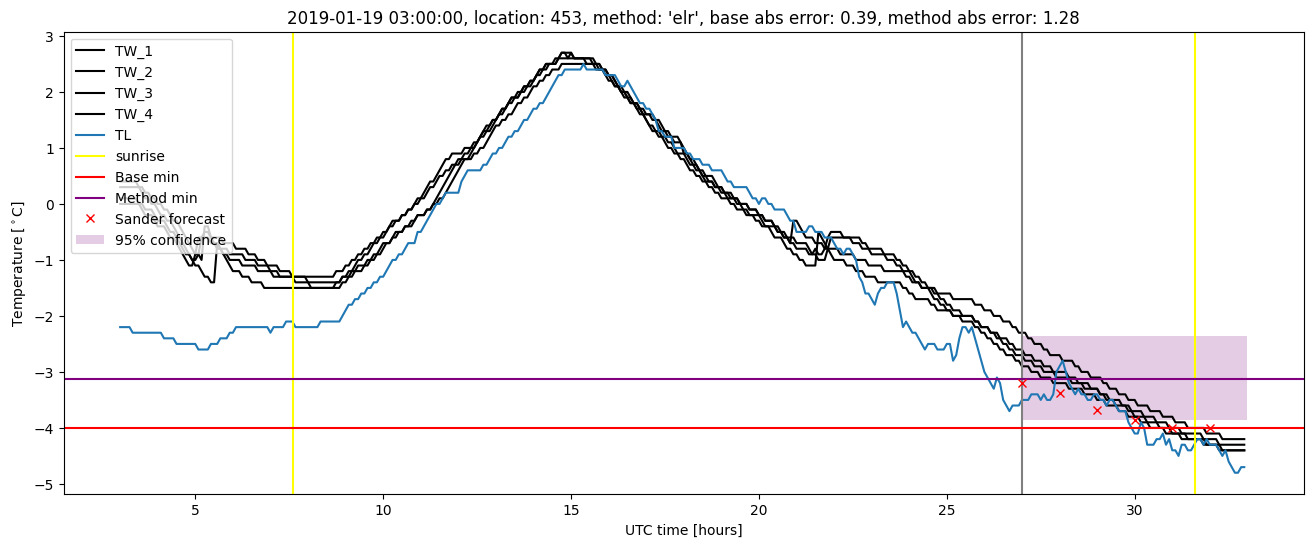
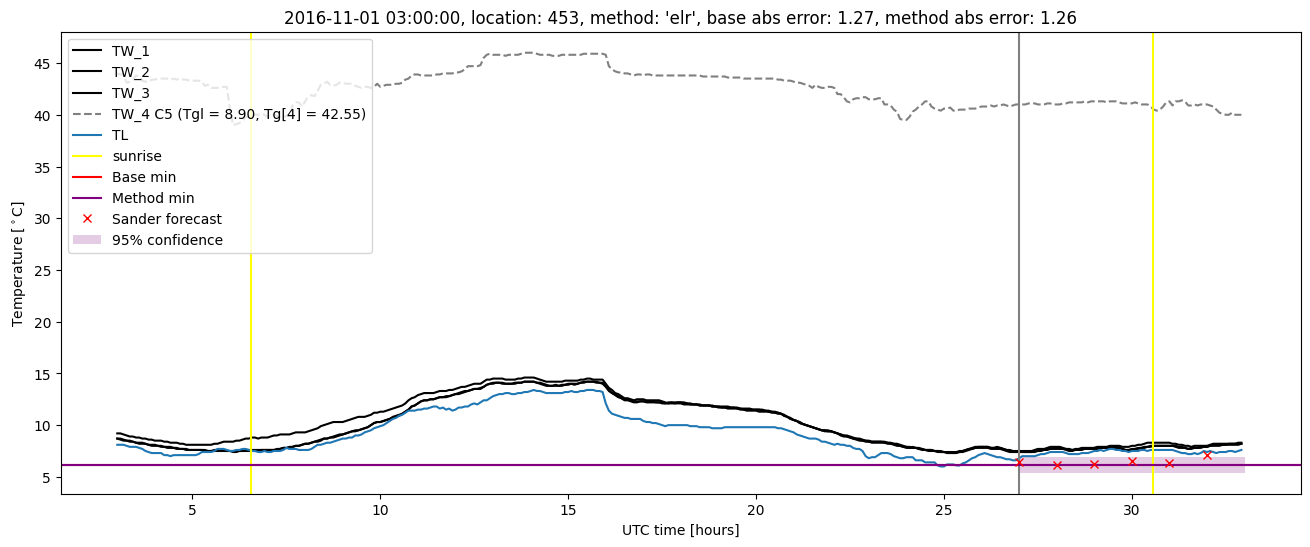
Extended logistic regression plots