GMS location: 452
Random forest results
| names |
period |
power |
significance |
meanSquareError |
absError |
maxError |
CRPS |
IGN |
| baseline |
winter 2016 |
0.993 |
0.048 |
0.311 |
0.418 |
1.796 |
NaN |
NaN |
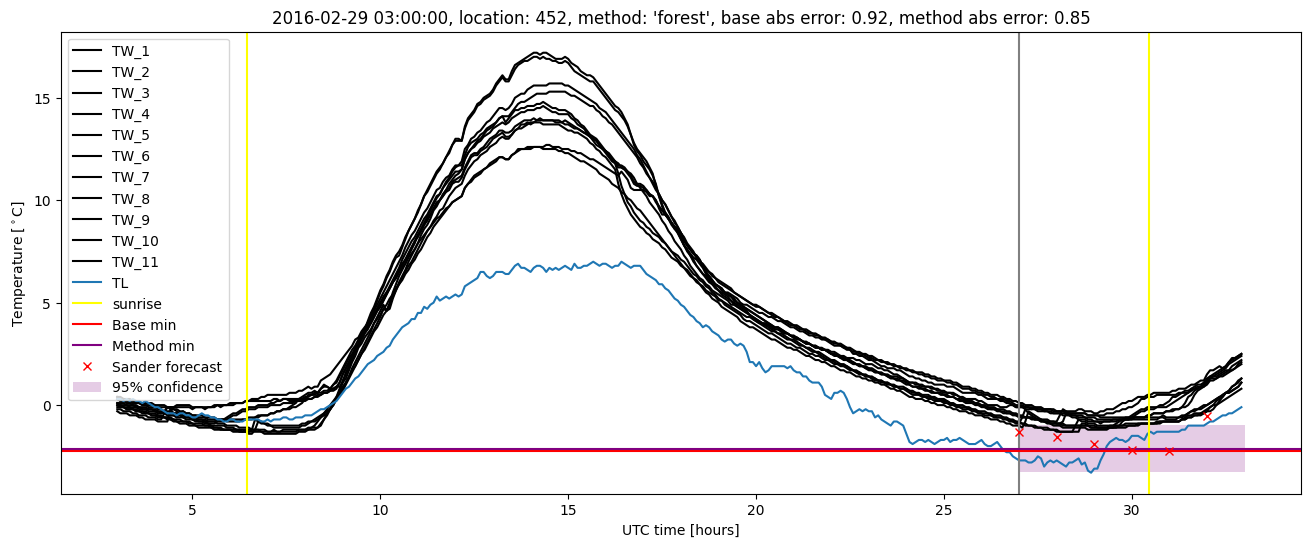
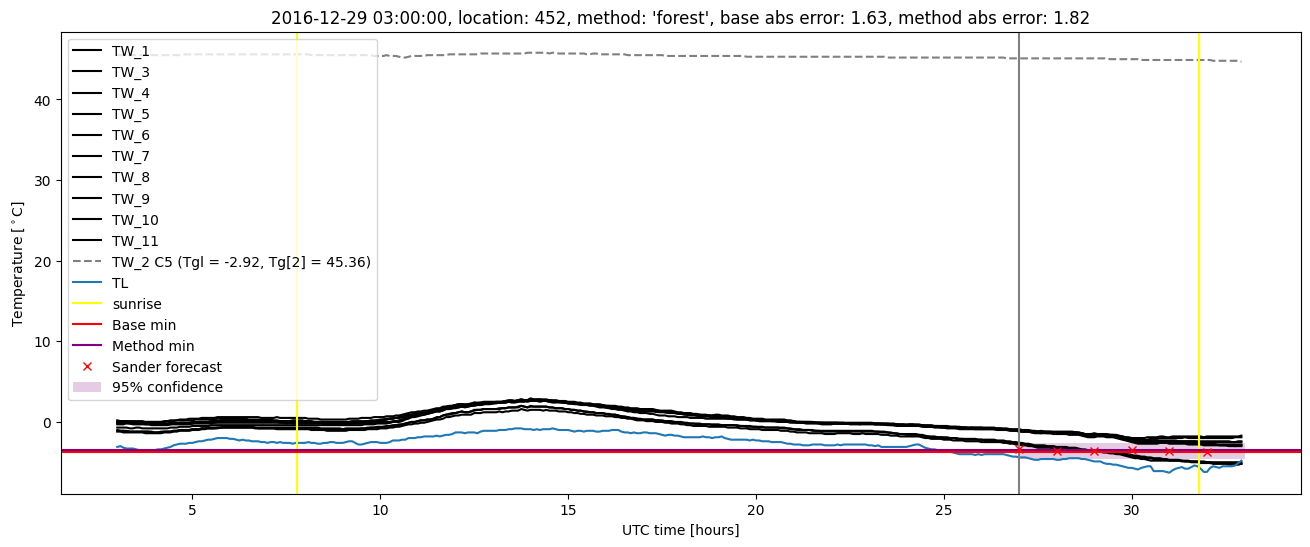
| forest |
winter 2016 |
0.993 |
0.048 |
0.245 |
0.362 |
1.554 |
0.504 |
3.094 |
| baseline |
winter 2017 |
0.973 |
0.025 |
0.453 |
0.497 |
2.318 |
NaN |
NaN |
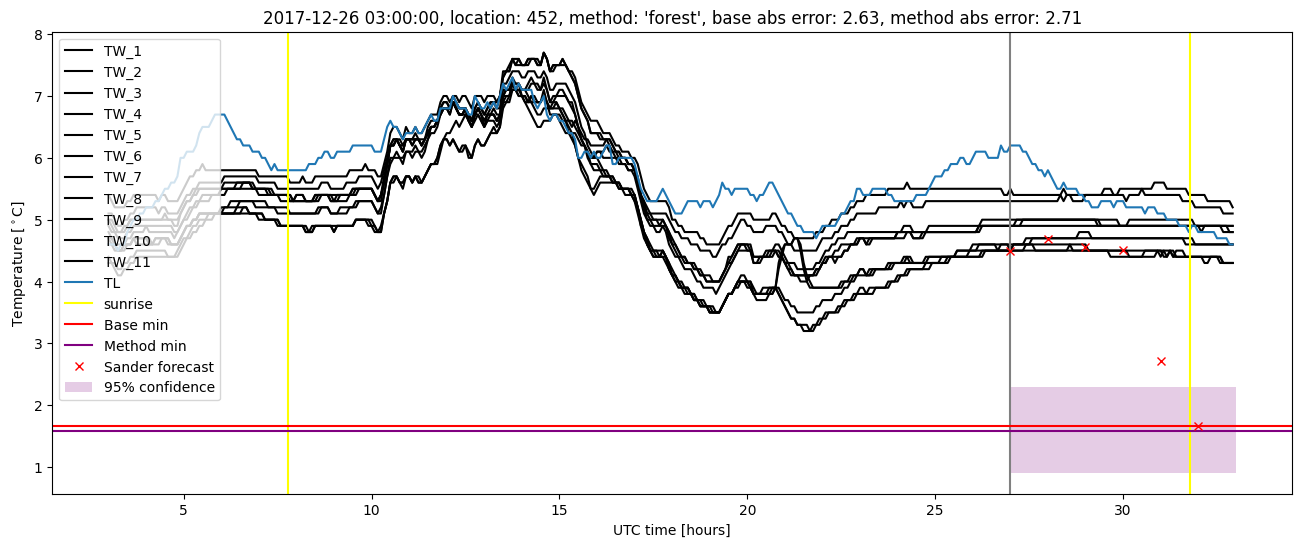
| forest |
winter 2017 |
0.964 |
0.000e+00 |
0.378 |
0.453 |
1.819 |
0.502 |
3.983 |
| baseline |
winter 2018 |
0.993 |
0.125 |
0.378 |
0.426 |
2.630 |
NaN |
NaN |
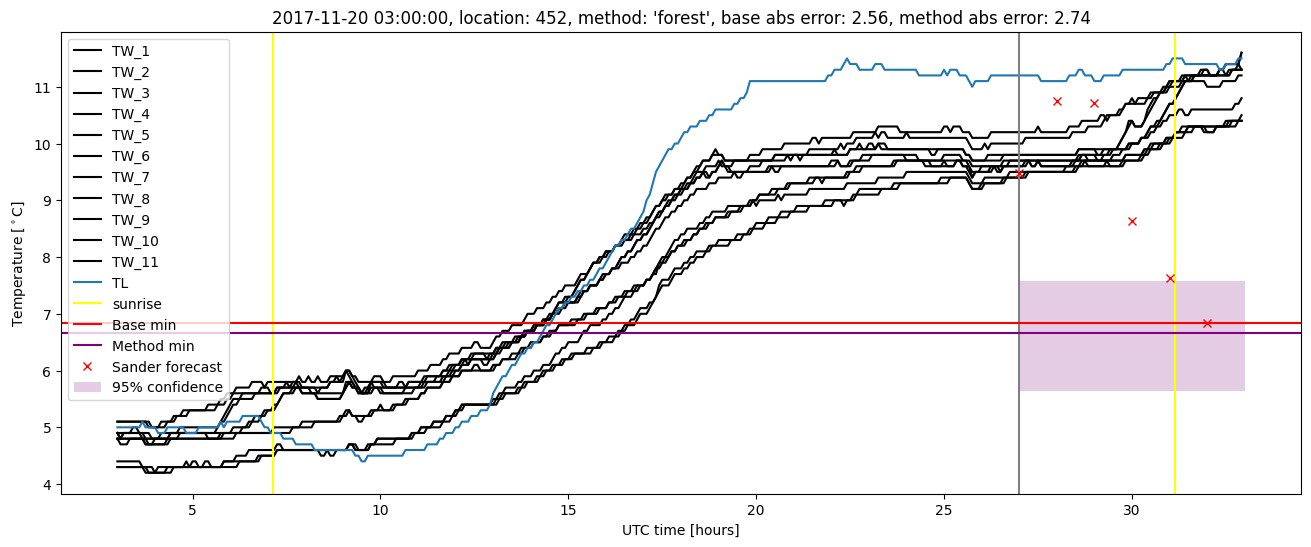
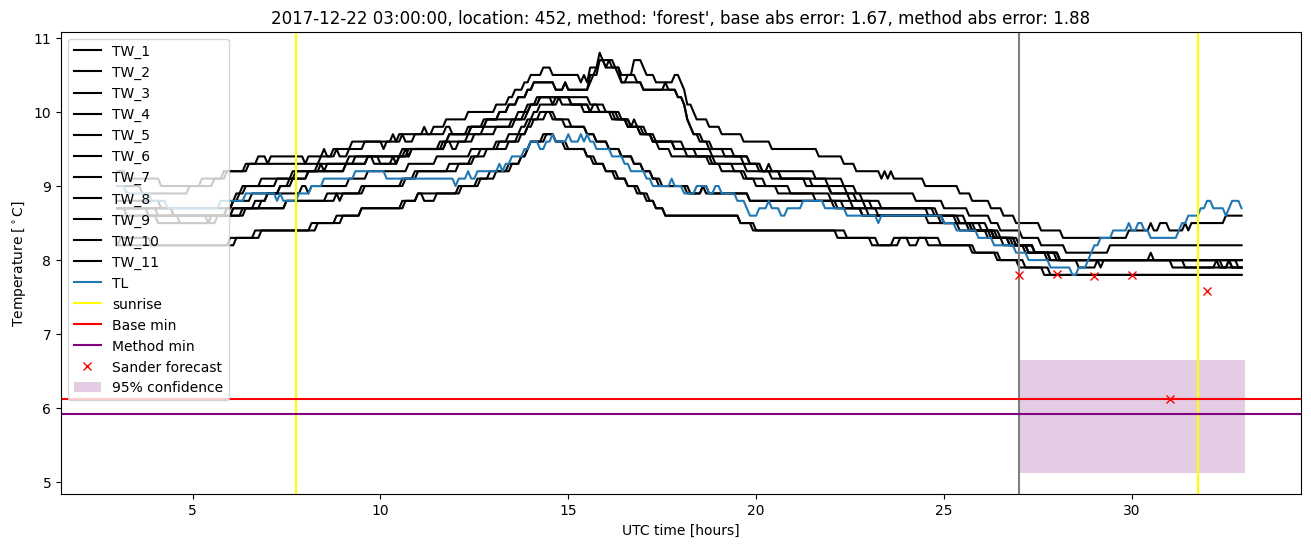
| forest |
winter 2018 |
1.000 |
0.125 |
0.365 |
0.427 |
2.744 |
0.513 |
3.678 |
| baseline |
winter 2019 |
0.985 |
0.000e+00 |
0.290 |
0.401 |
2.509 |
NaN |
NaN |
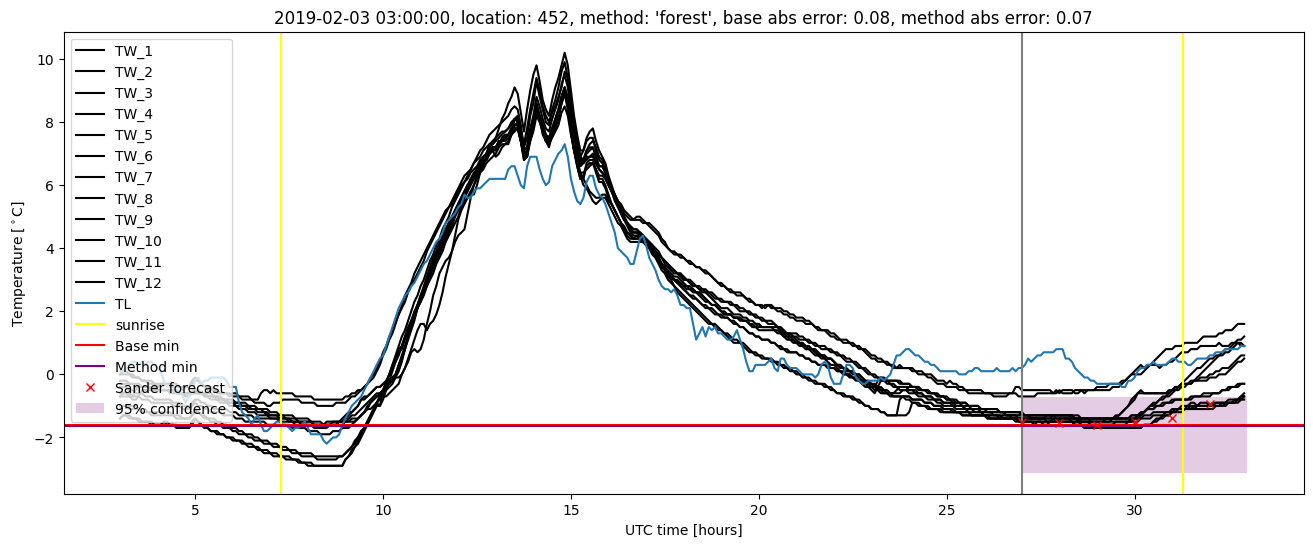
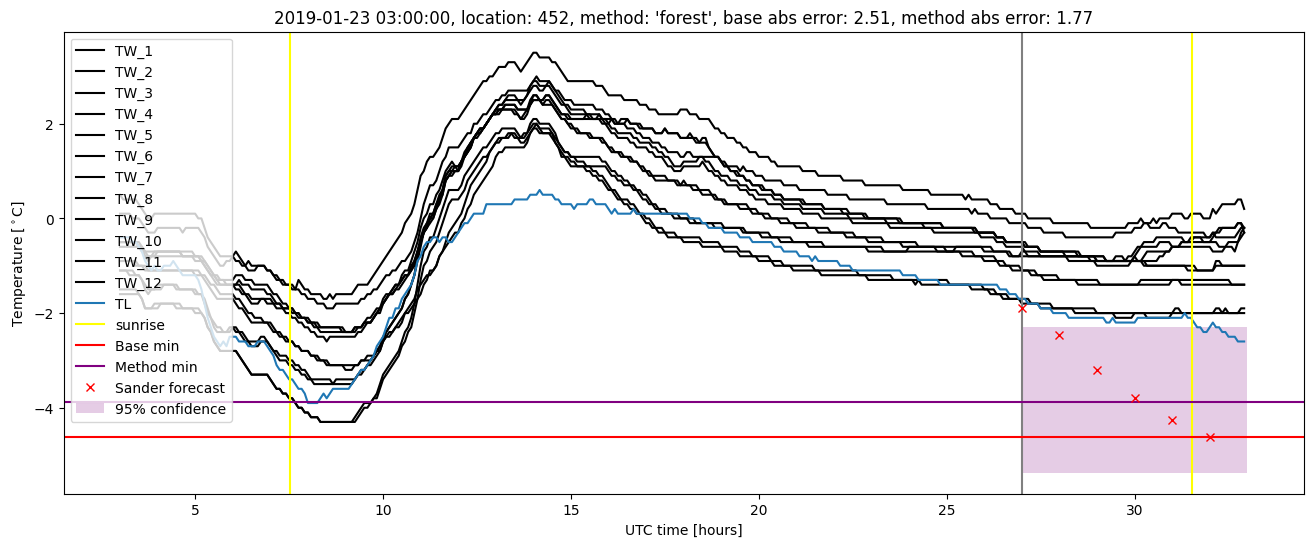
| forest |
winter 2019 |
0.985 |
0.000e+00 |
0.236 |
0.374 |
1.773 |
0.496 |
2.771 |
| baseline |
all |
0.987 |
0.059 |
0.358 |
0.435 |
2.630 |
NaN |
NaN |
| forest |
all |
0.987 |
0.050 |
0.308 |
0.405 |
2.744 |
0.504 |
3.390 |
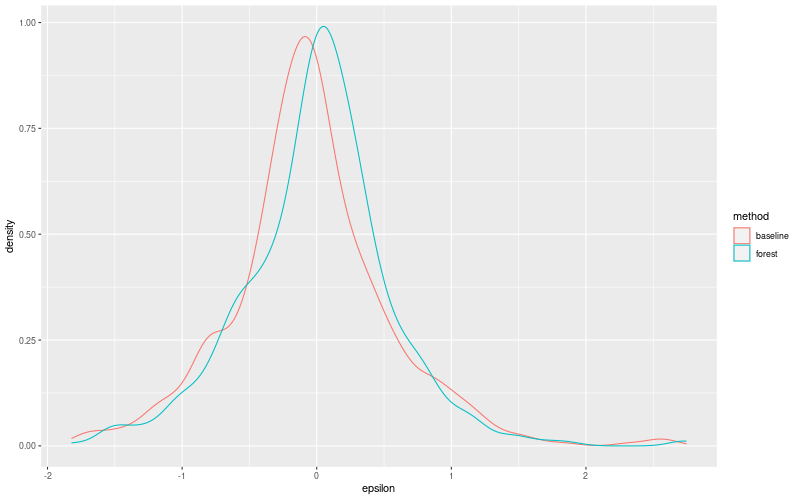
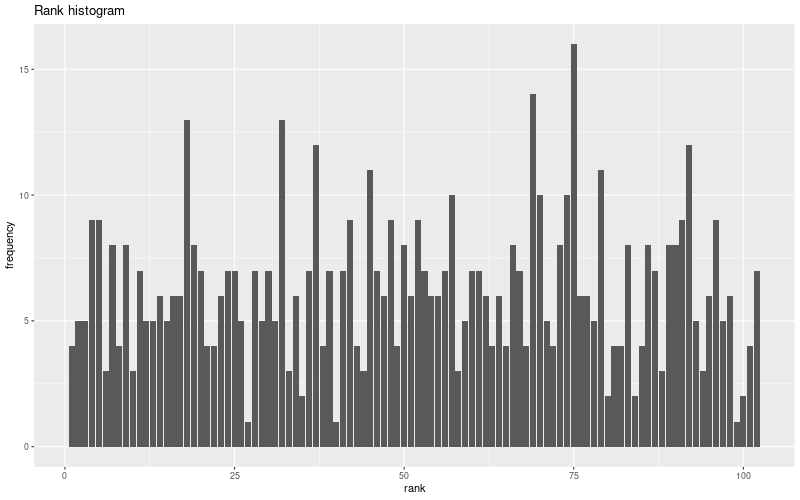
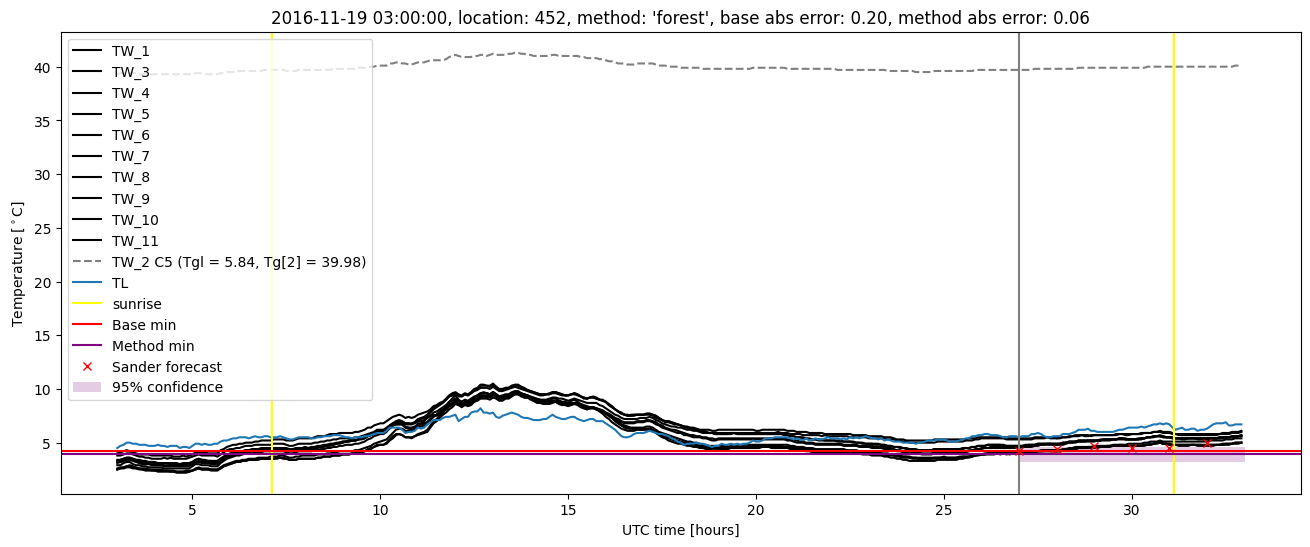
Random forest plots
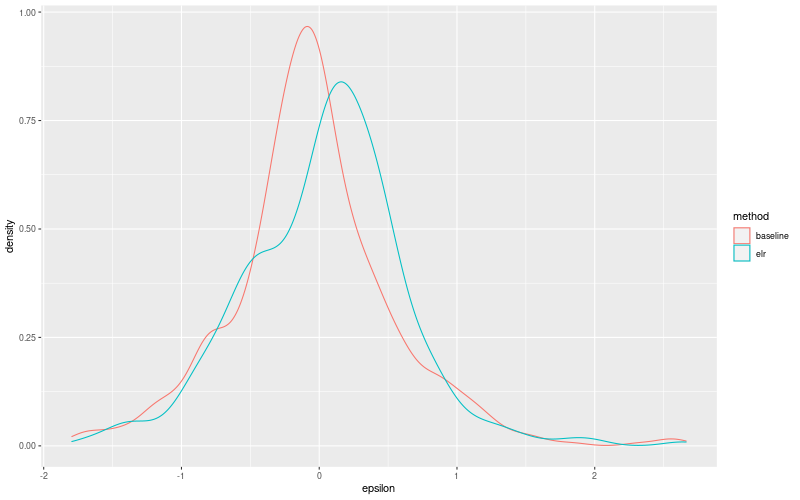
Extended logistic regression results
| names |
period |
power |
significance |
meanSquareError |
absError |
maxError |
CRPS |
IGN |
| baseline |
winter 2016 |
0.993 |
0.048 |
0.311 |
0.418 |
1.796 |
NaN |
NaN |
| elr |
winter 2016 |
0.986 |
0.048 |
0.327 |
0.447 |
1.788 |
0.586 |
4.500 |
| baseline |
winter 2017 |
0.973 |
0.025 |
0.453 |
0.497 |
2.318 |
NaN |
NaN |
| elr |
winter 2017 |
0.955 |
0.025 |
0.386 |
0.473 |
1.984 |
0.582 |
4.670 |
| baseline |
winter 2018 |
0.993 |
0.125 |
0.378 |
0.426 |
2.630 |
NaN |
NaN |
| elr |
winter 2018 |
1.000 |
0.125 |
0.371 |
0.442 |
2.663 |
0.536 |
3.852 |
| baseline |
winter 2019 |
0.985 |
0.000e+00 |
0.290 |
0.401 |
2.509 |
NaN |
NaN |
| elr |
winter 2019 |
0.985 |
0.000e+00 |
0.283 |
0.420 |
1.903 |
0.539 |
3.519 |
| baseline |
all |
0.987 |
0.059 |
0.358 |
0.435 |
2.630 |
NaN |
NaN |
| elr |
all |
0.983 |
0.059 |
0.343 |
0.446 |
2.663 |
0.560 |
4.128 |
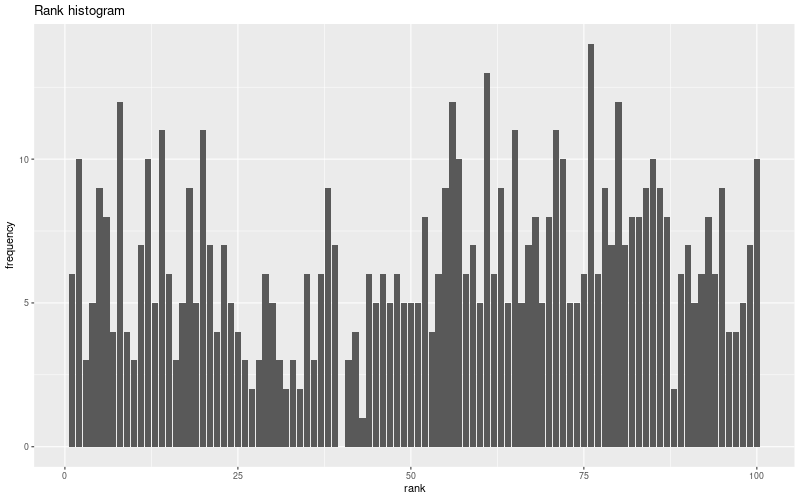
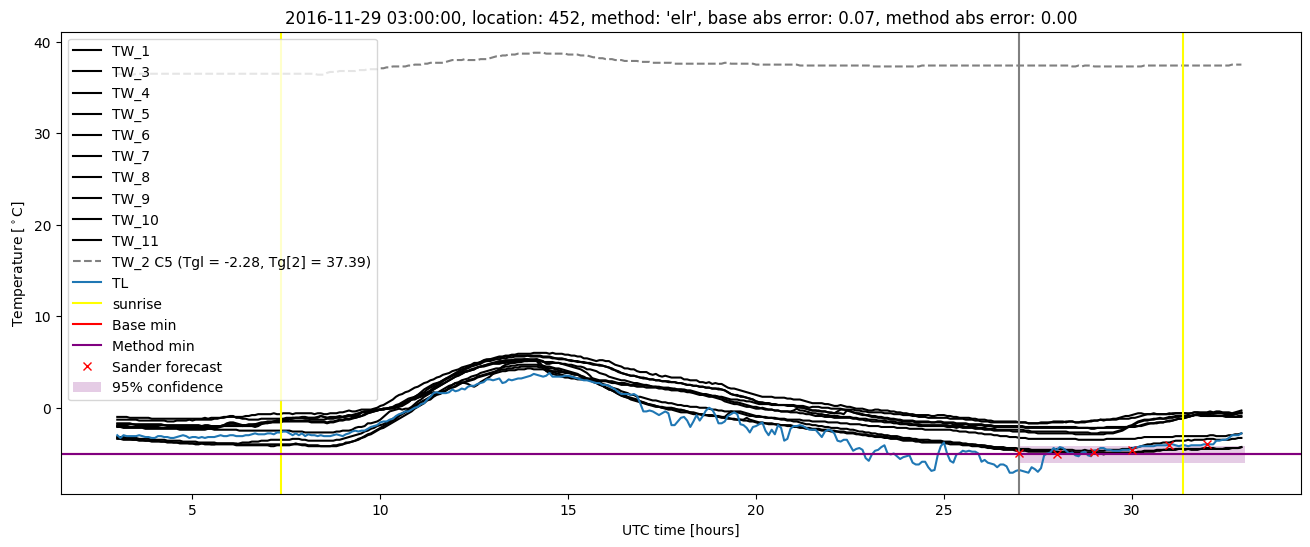
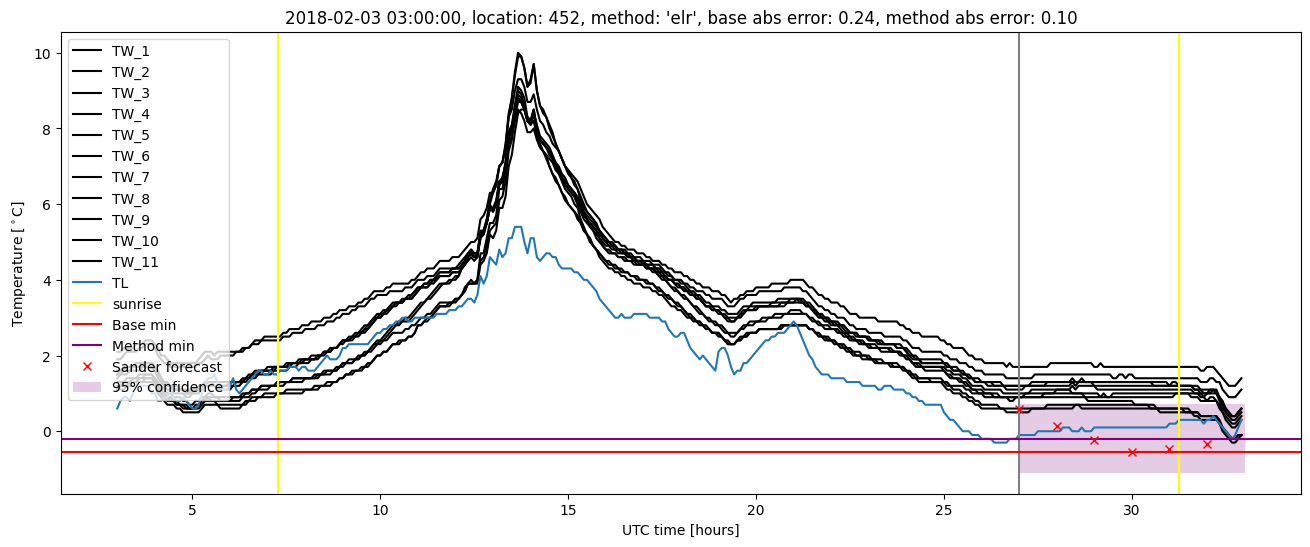
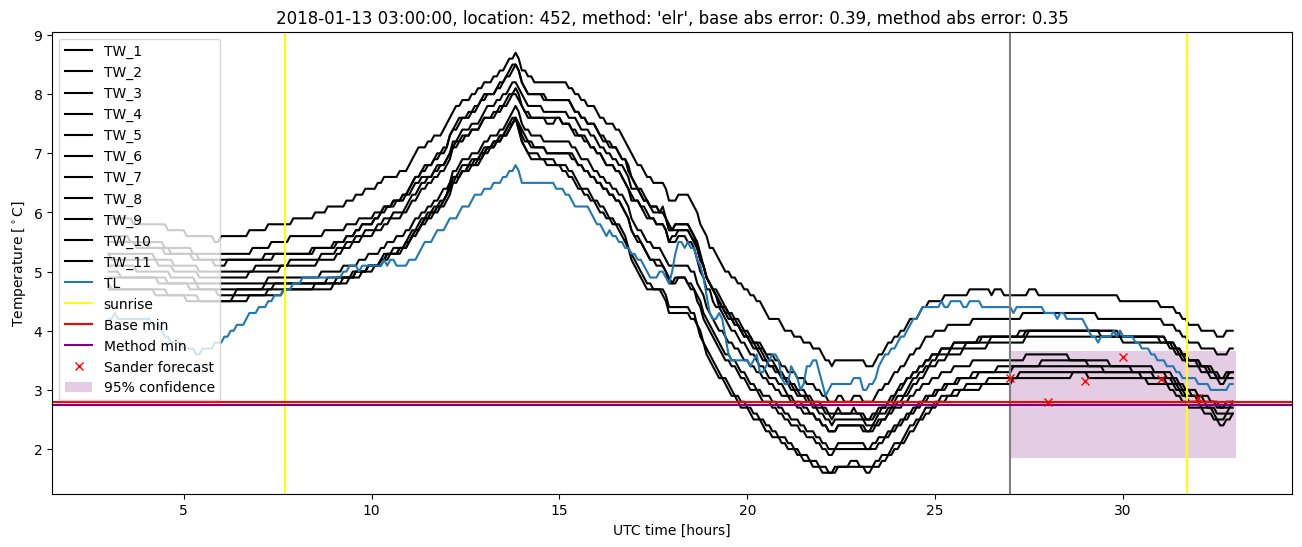
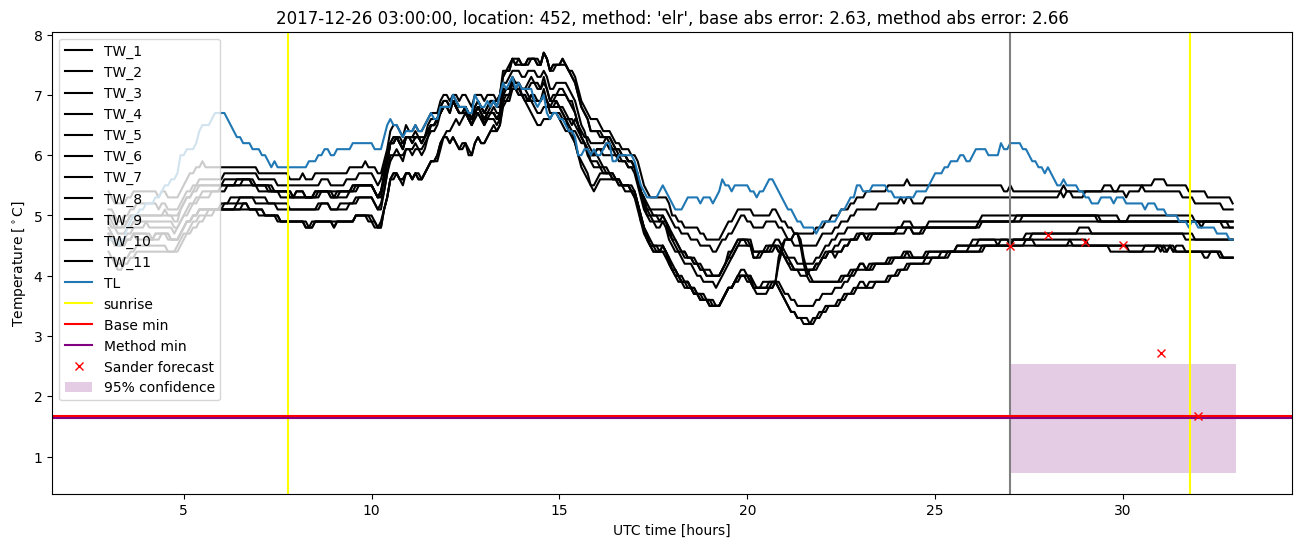
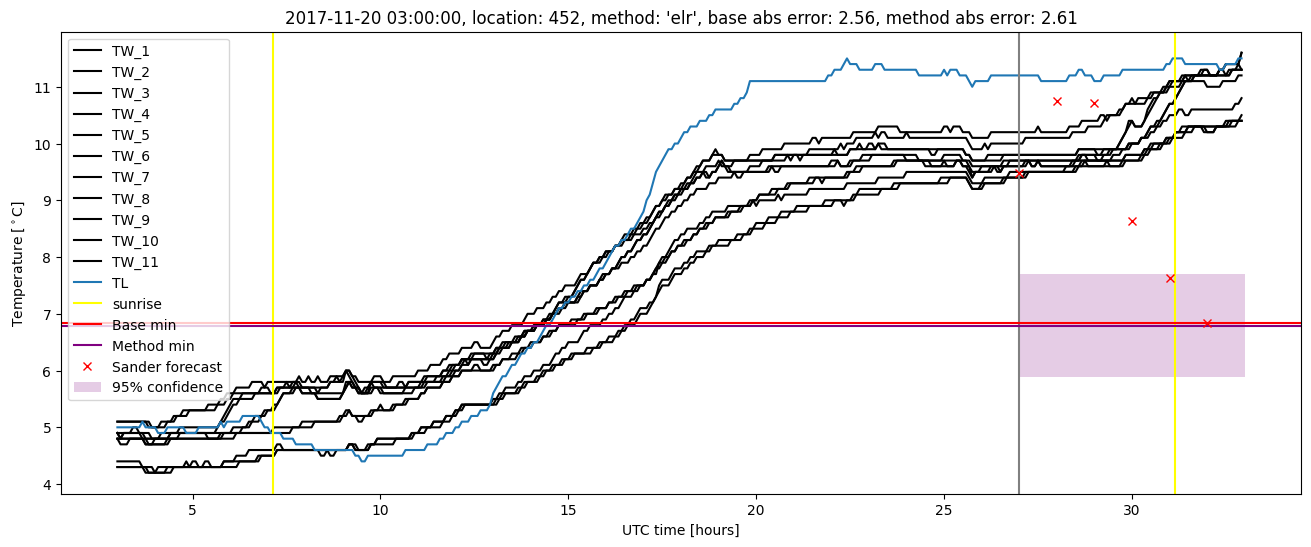
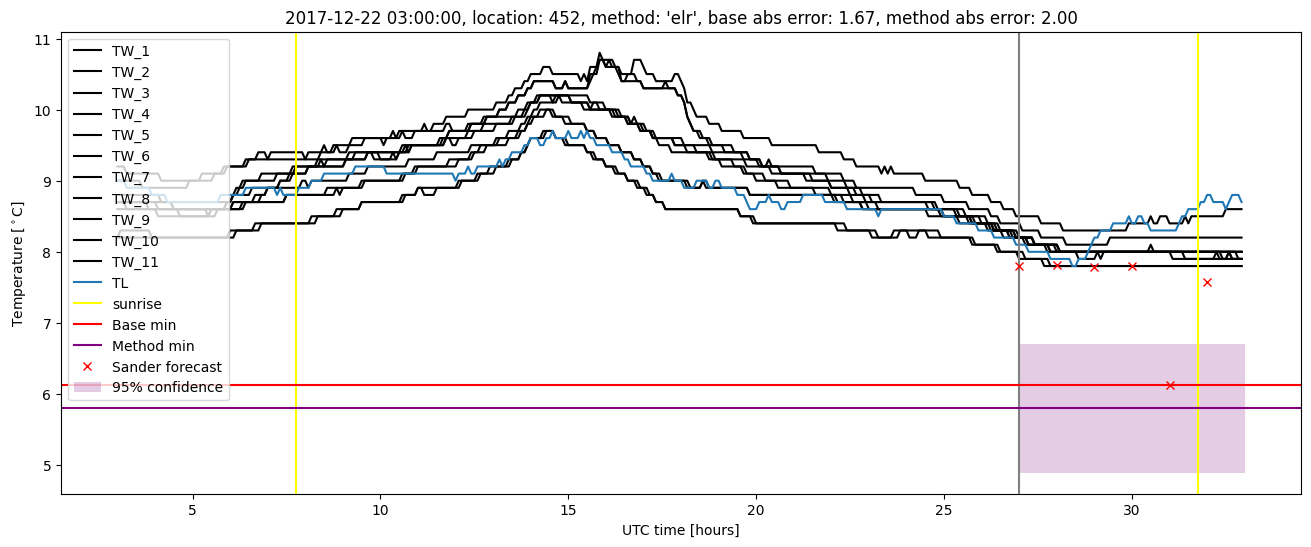
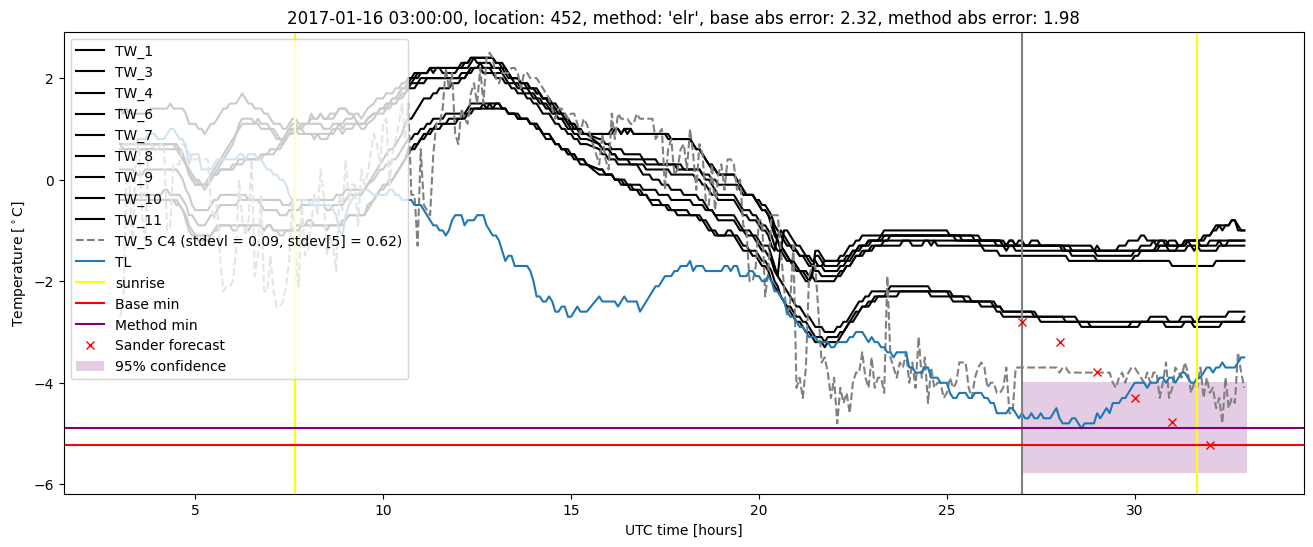
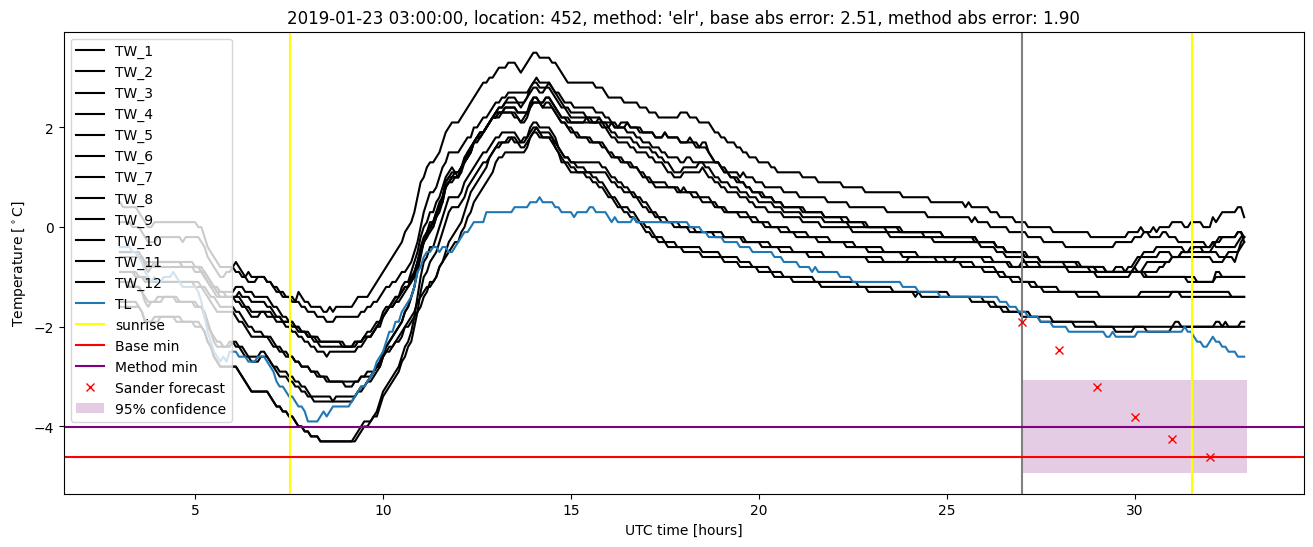
Extended logistic regression plots