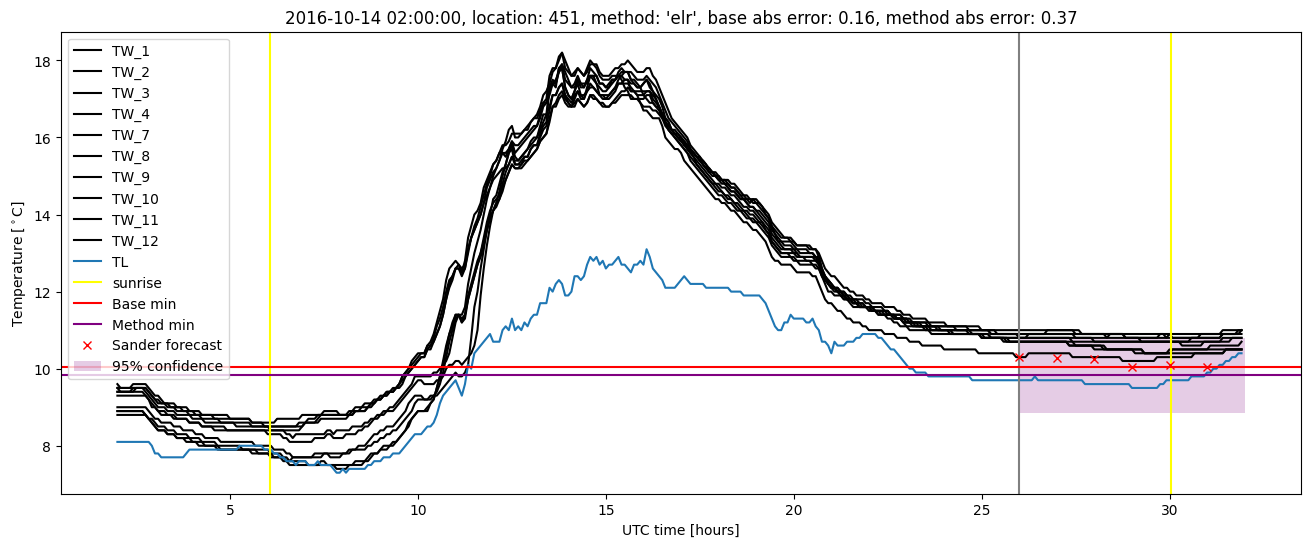
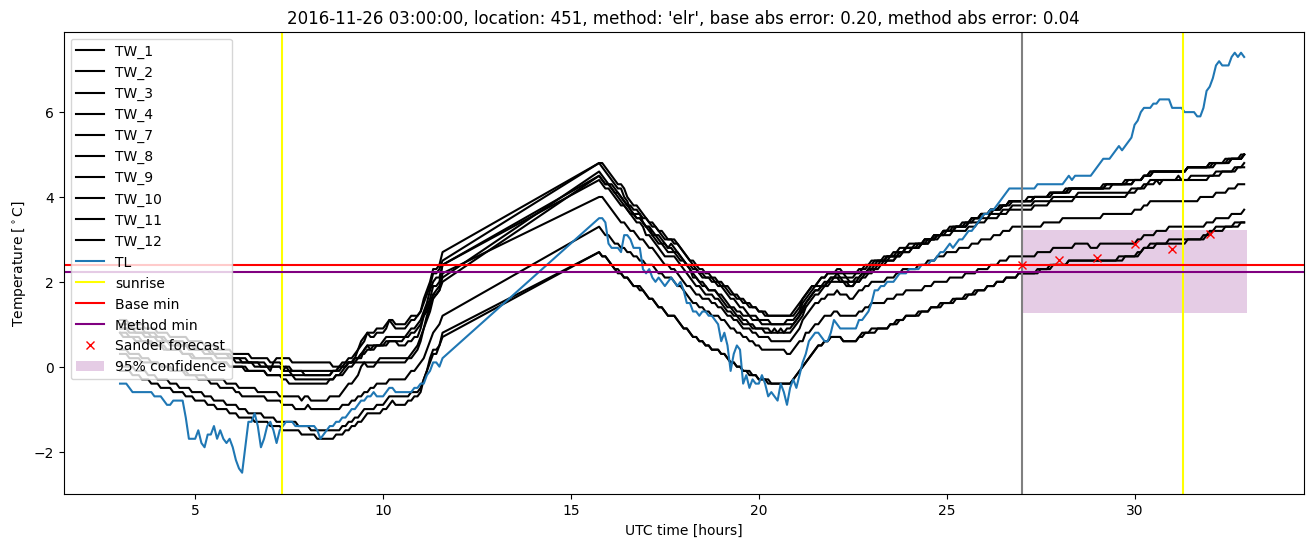
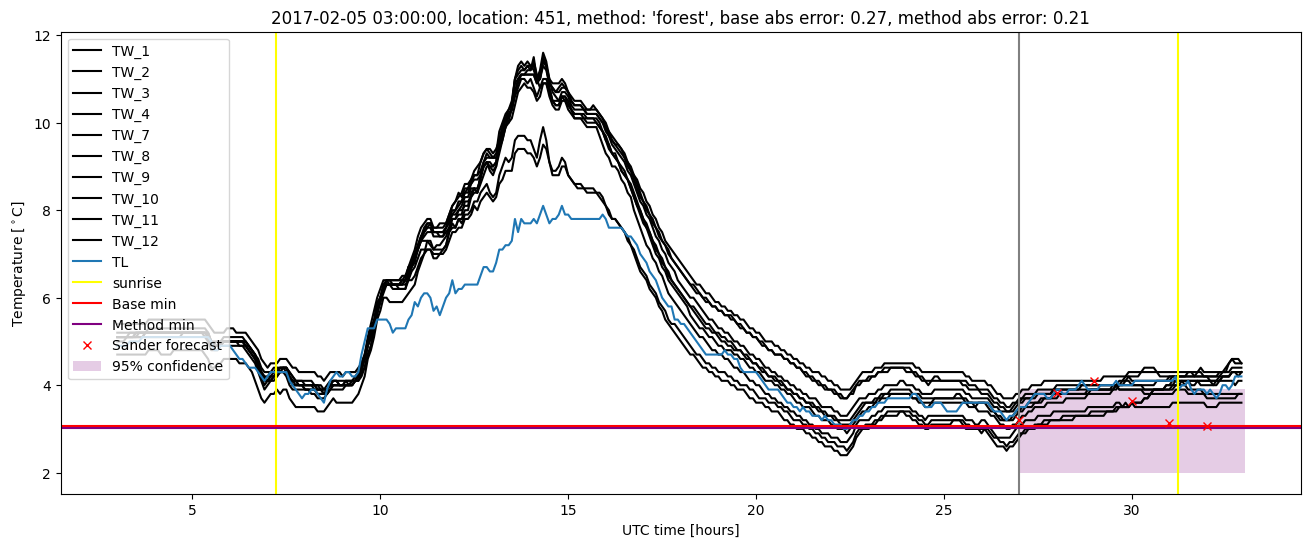
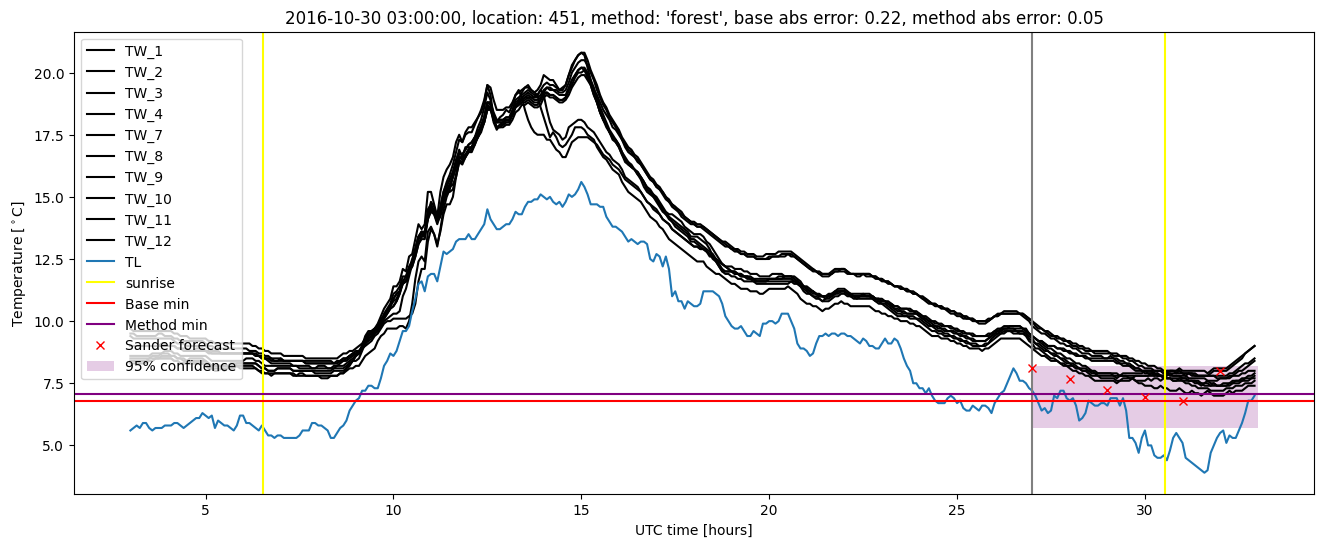
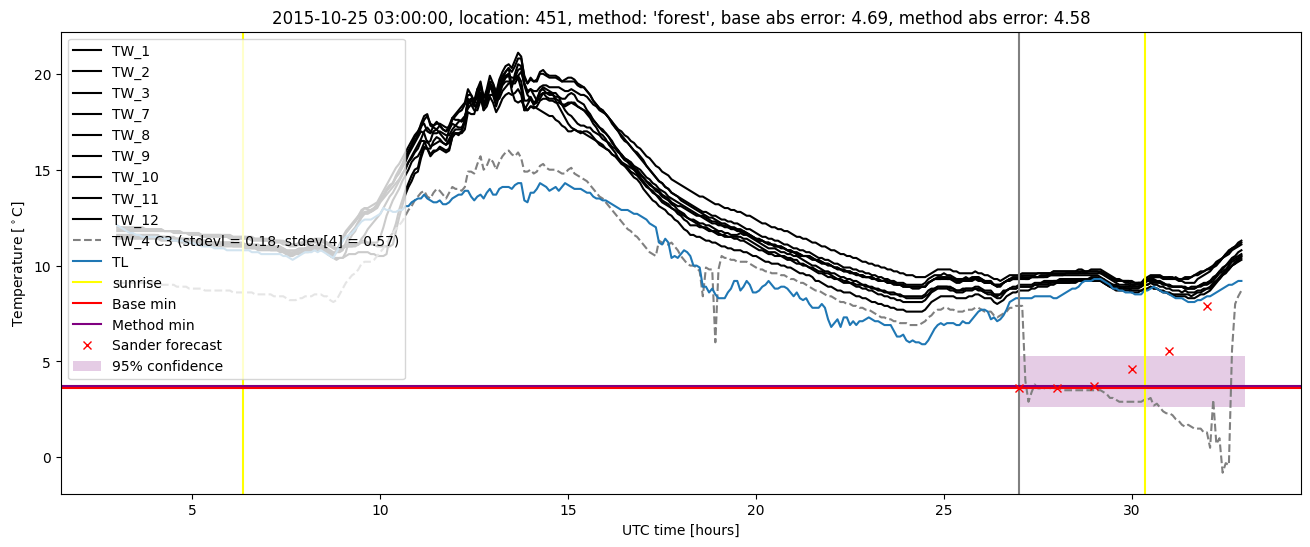
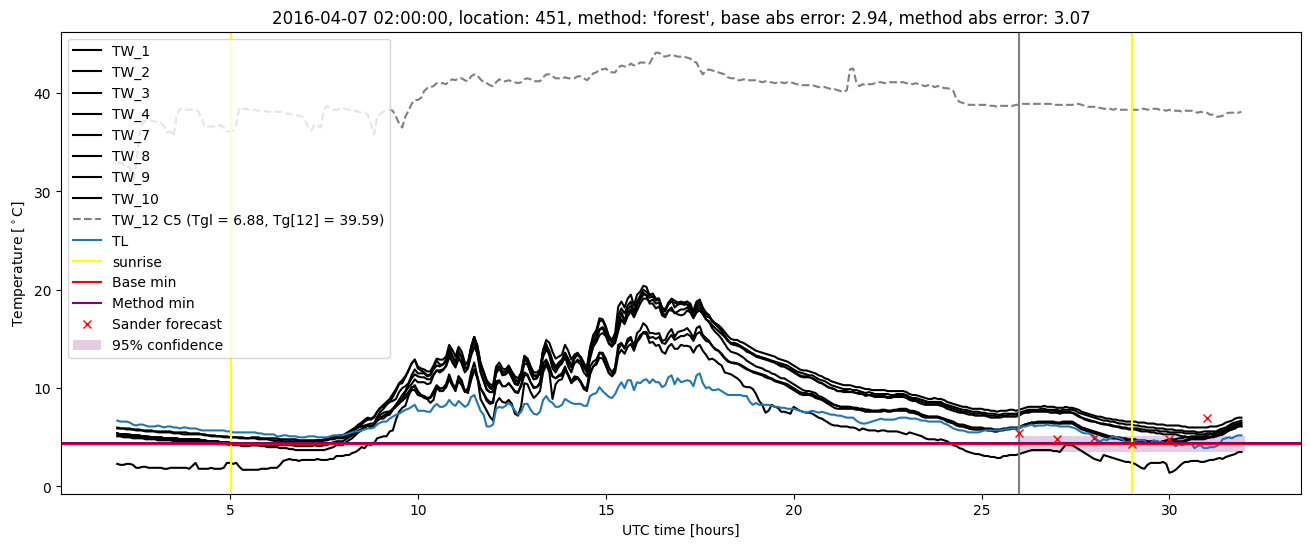
GMS location: 451
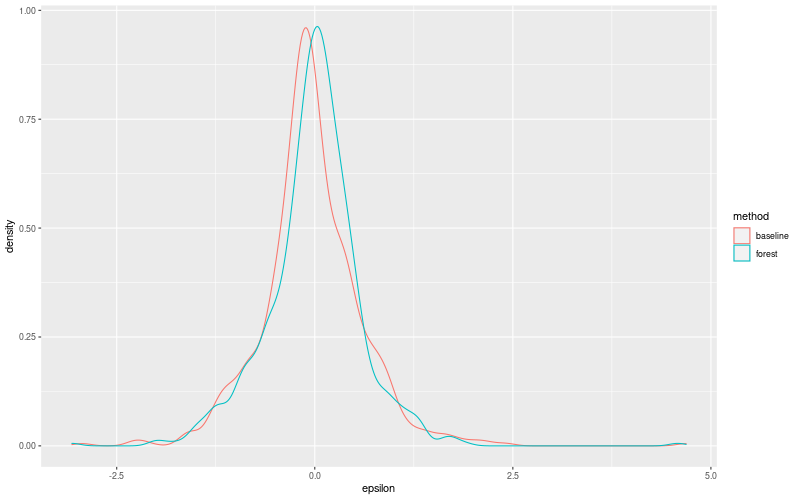
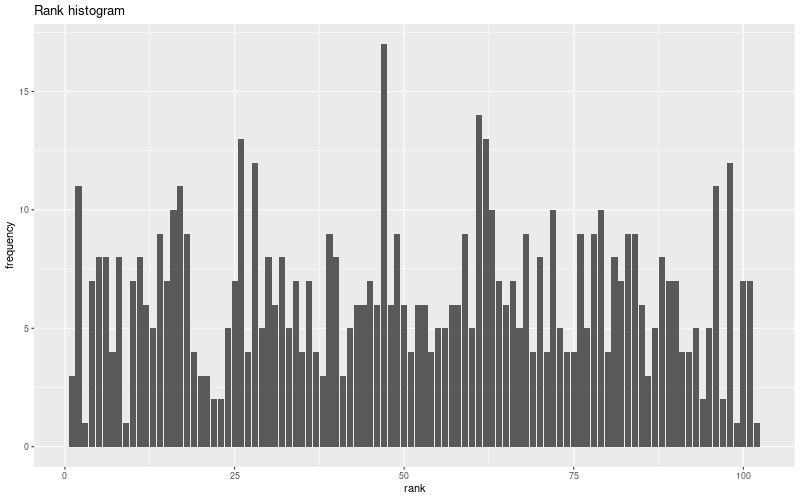
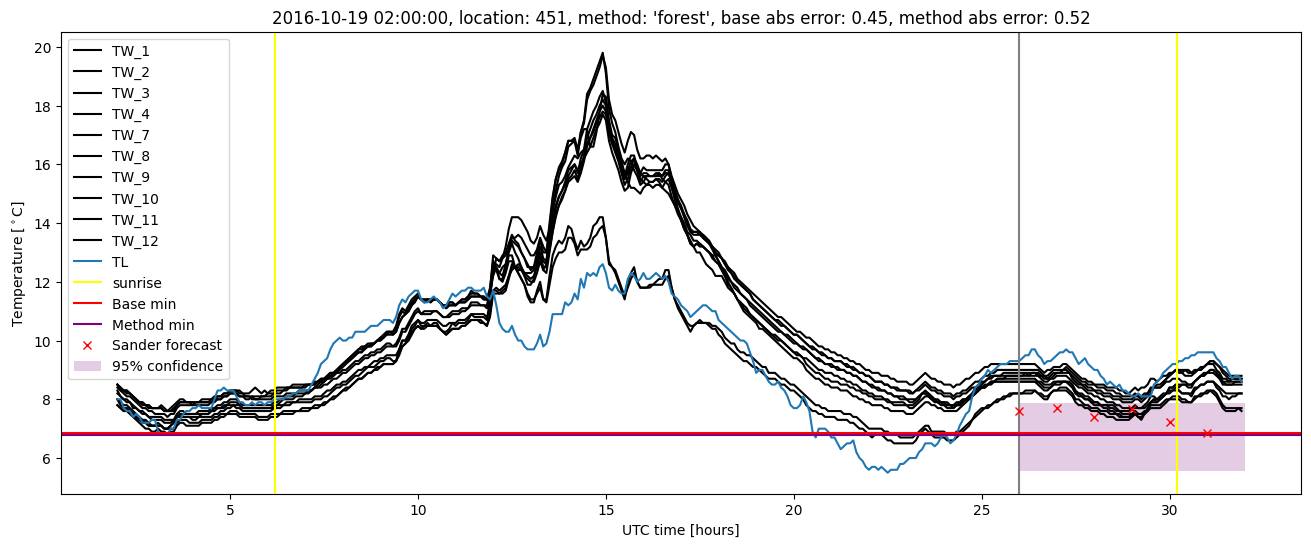
Random forest results
| names |
period |
power |
significance |
meanSquareError |
absError |
maxError |
CRPS |
IGN |
| baseline |
winter 2016 |
0.983 |
0.040 |
0.555 |
0.499 |
4.687 |
NaN |
NaN |
| forest |
winter 2016 |
0.983 |
0.040 |
0.491 |
0.465 |
4.581 |
0.503 |
4.895 |
| baseline |
winter 2017 |
0.963 |
0.025 |
0.399 |
0.456 |
2.417 |
NaN |
NaN |
| forest |
winter 2017 |
0.963 |
0.000e+00 |
0.335 |
0.410 |
1.890 |
0.478 |
3.315 |
| baseline |
winter 2018 |
0.993 |
0.184 |
0.316 |
0.407 |
2.119 |
NaN |
NaN |
| forest |
winter 2018 |
0.993 |
0.132 |
0.295 |
0.401 |
1.806 |
0.484 |
2.506 |
| baseline |
winter 2019 |
1.000 |
0.059 |
0.344 |
0.444 |
1.994 |
NaN |
NaN |
| forest |
winter 2019 |
1.000 |
0.059 |
0.284 |
0.402 |
1.616 |
0.488 |
2.830 |
| baseline |
all |
0.985 |
0.083 |
0.413 |
0.454 |
4.687 |
NaN |
NaN |
| forest |
all |
0.985 |
0.058 |
0.361 |
0.423 |
4.581 |
0.489 |
3.481 |
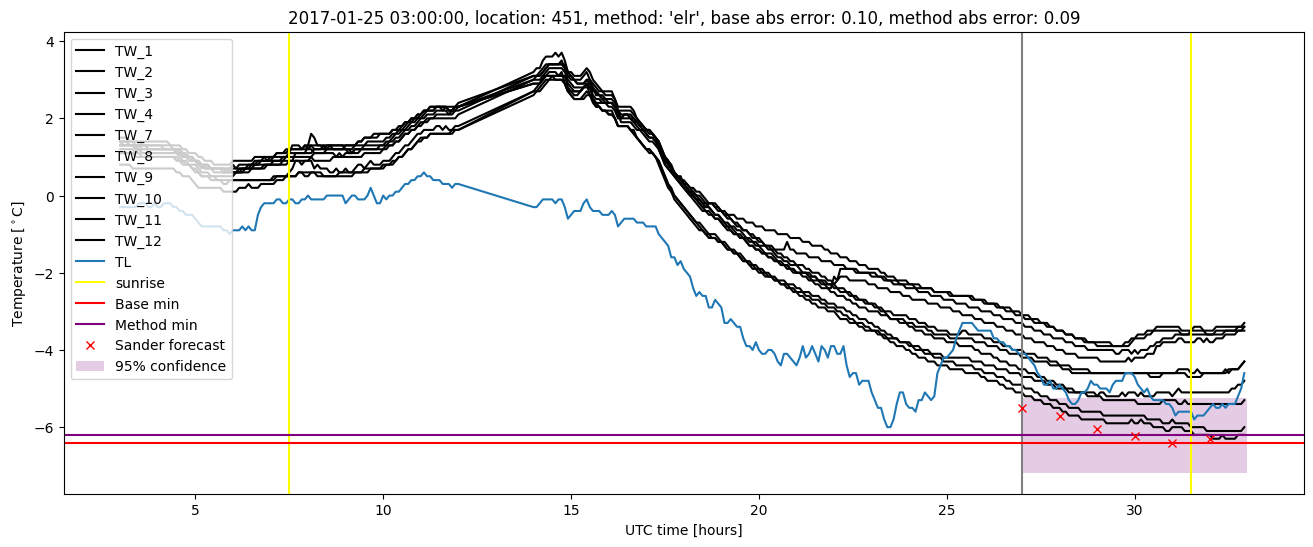
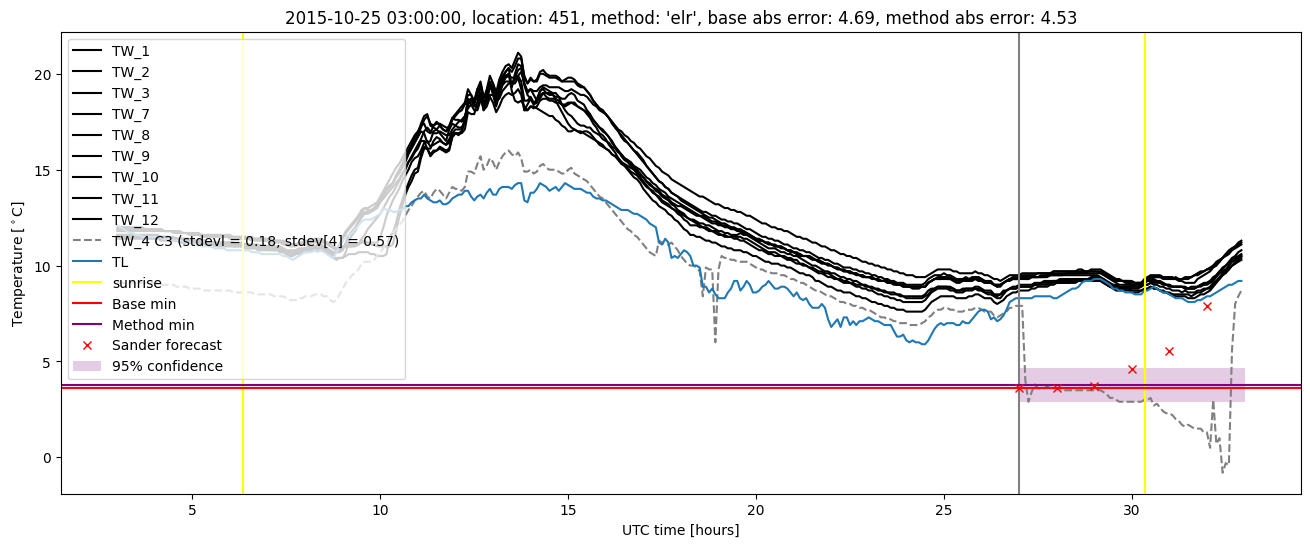
Random forest plots
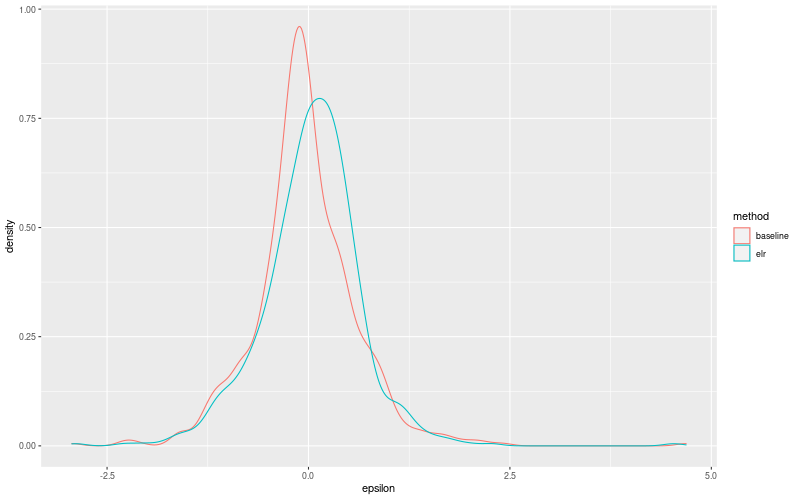
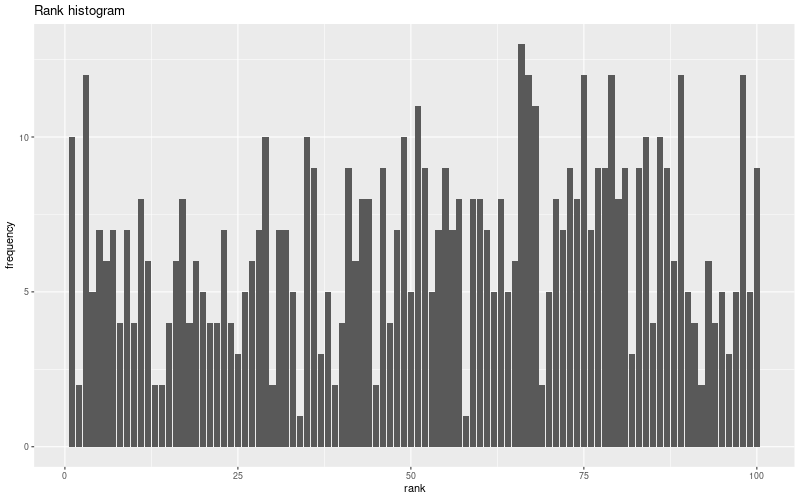
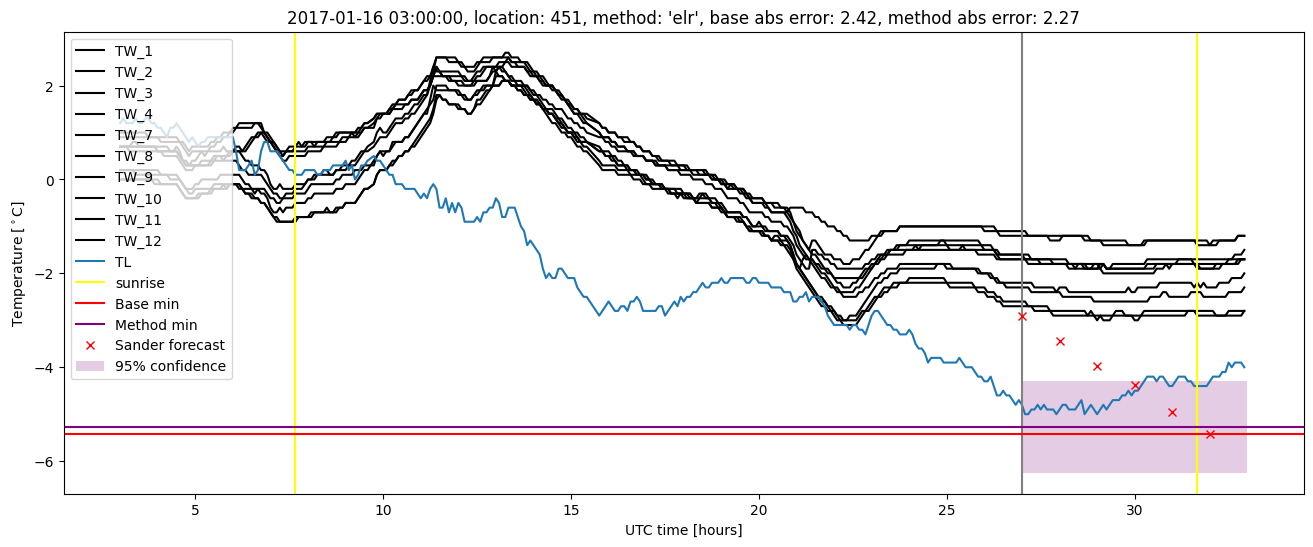
Extended logistic regression results
| names |
period |
power |
significance |
meanSquareError |
absError |
maxError |
CRPS |
IGN |
| baseline |
winter 2016 |
0.983 |
0.040 |
0.555 |
0.499 |
4.687 |
NaN |
NaN |
| elr |
winter 2016 |
0.977 |
0.080 |
0.507 |
0.493 |
4.533 |
0.571 |
4.341 |
| baseline |
winter 2017 |
0.963 |
0.025 |
0.399 |
0.456 |
2.417 |
NaN |
NaN |
| elr |
winter 2017 |
0.972 |
0.000e+00 |
0.381 |
0.460 |
2.274 |
0.541 |
3.102 |
| baseline |
winter 2018 |
0.993 |
0.184 |
0.316 |
0.407 |
2.119 |
NaN |
NaN |
| elr |
winter 2018 |
1.000 |
0.132 |
0.314 |
0.420 |
2.286 |
0.542 |
2.992 |
| baseline |
winter 2019 |
1.000 |
0.059 |
0.344 |
0.444 |
1.994 |
NaN |
NaN |
| elr |
winter 2019 |
1.000 |
0.118 |
0.299 |
0.420 |
1.818 |
0.509 |
2.488 |
| baseline |
all |
0.985 |
0.083 |
0.413 |
0.454 |
4.687 |
NaN |
NaN |
| elr |
all |
0.987 |
0.075 |
0.385 |
0.451 |
4.533 |
0.544 |
3.321 |
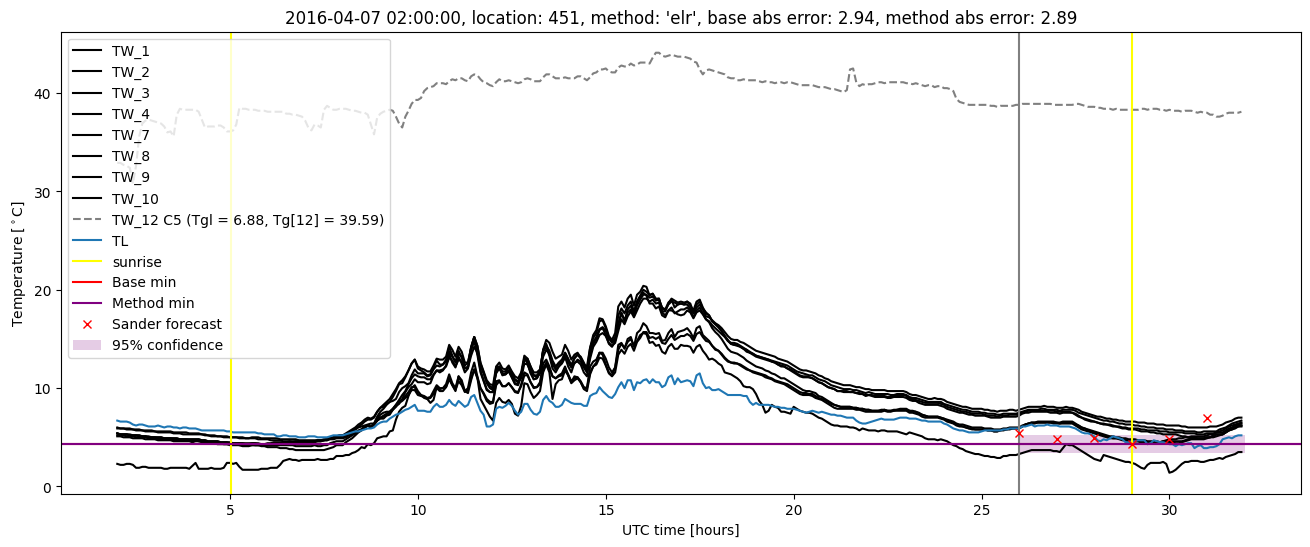
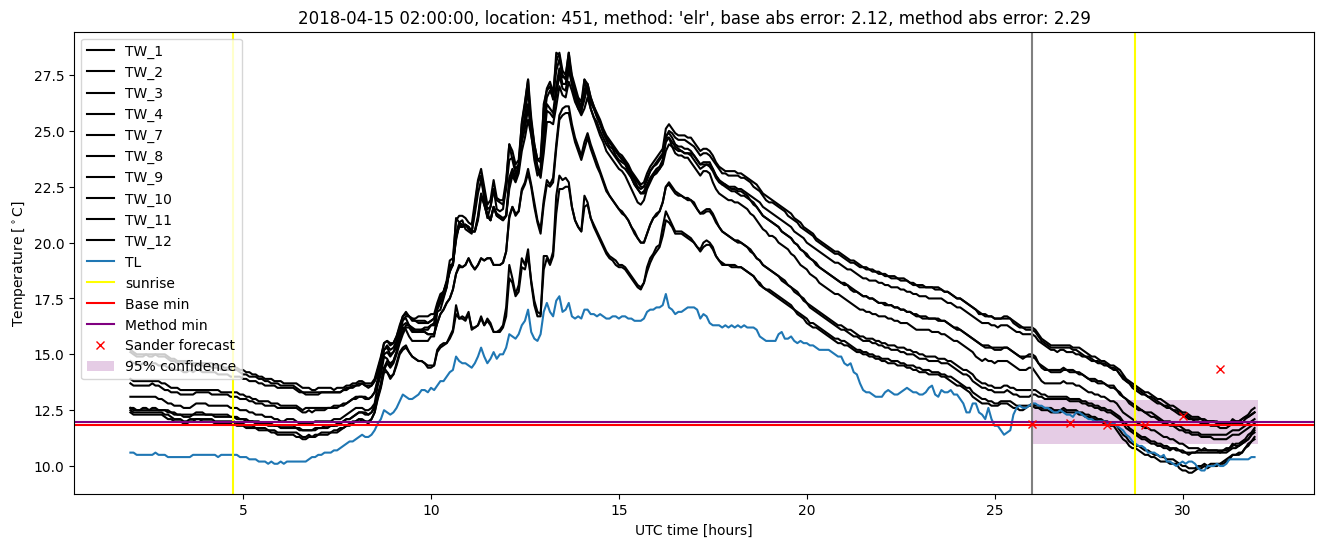
Extended logistic regression plots