GMS location: 430
Random forest results
| names |
period |
power |
significance |
meanSquareError |
absError |
maxError |
CRPS |
IGN |
| baseline |
winter 2016 |
0.958 |
0.116 |
0.708 |
0.623 |
2.987 |
NaN |
NaN |
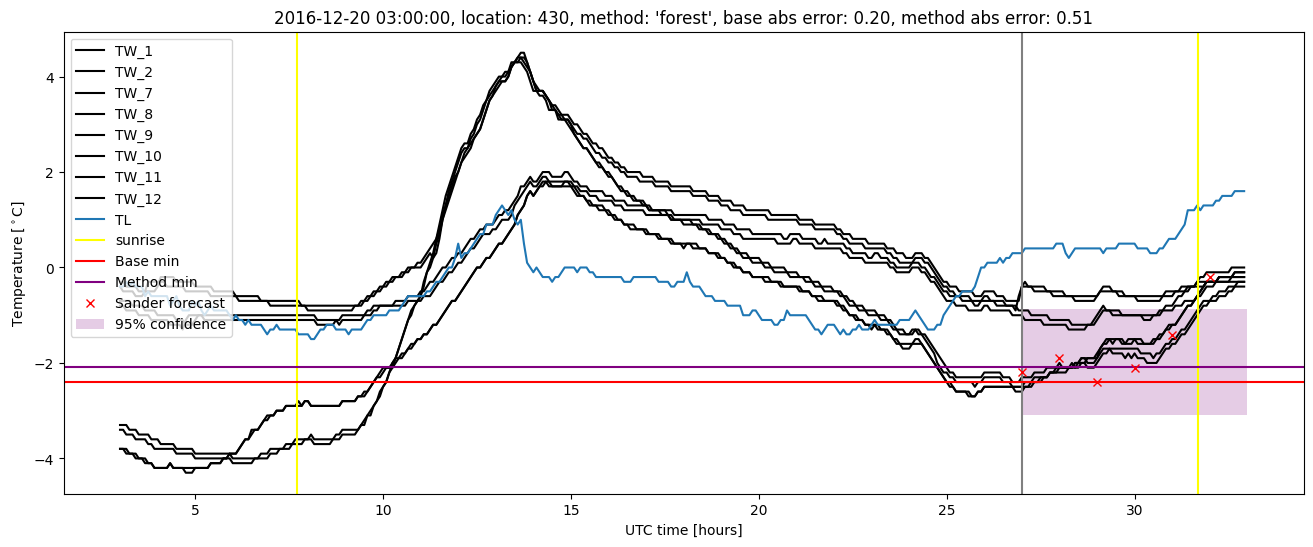
| forest |
winter 2016 |
0.958 |
0.070 |
0.555 |
0.550 |
2.278 |
0.472 |
2.140 |
| baseline |
winter 2017 |
0.969 |
0.054 |
1.160 |
0.749 |
3.668 |
NaN |
NaN |
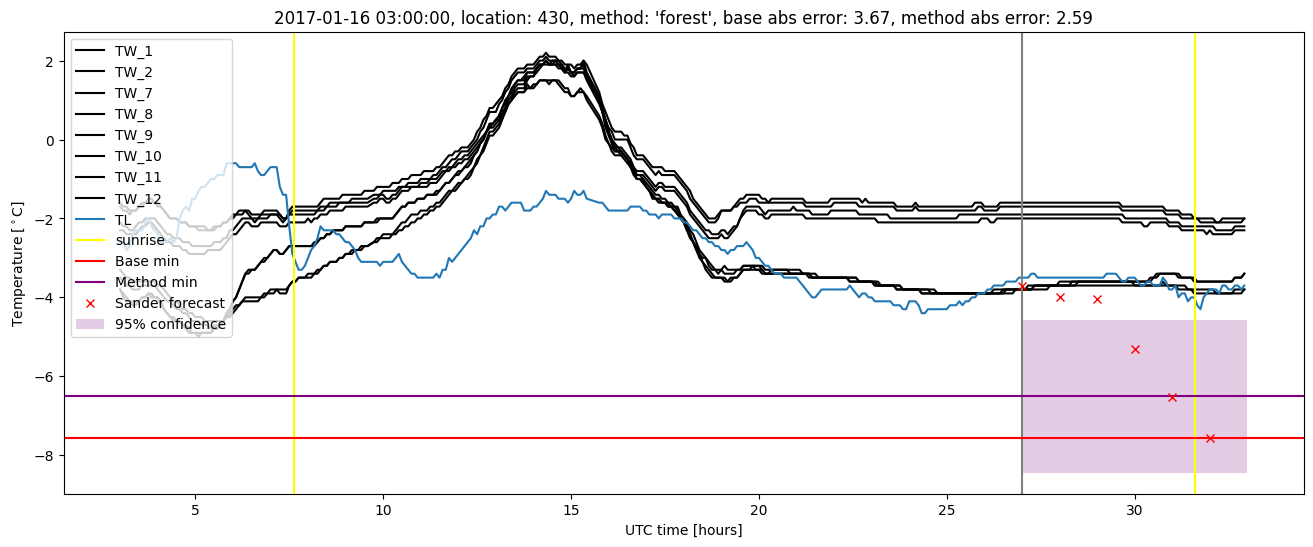
| forest |
winter 2017 |
0.990 |
0.036 |
0.696 |
0.619 |
2.591 |
0.468 |
2.008 |
| baseline |
winter 2018 |
0.965 |
0.095 |
0.504 |
0.516 |
2.354 |
NaN |
NaN |
| forest |
winter 2018 |
0.965 |
0.095 |
0.538 |
0.555 |
2.541 |
0.484 |
1.855 |
| baseline |
winter 2019 |
0.990 |
0.051 |
0.785 |
0.600 |
3.935 |
NaN |
NaN |
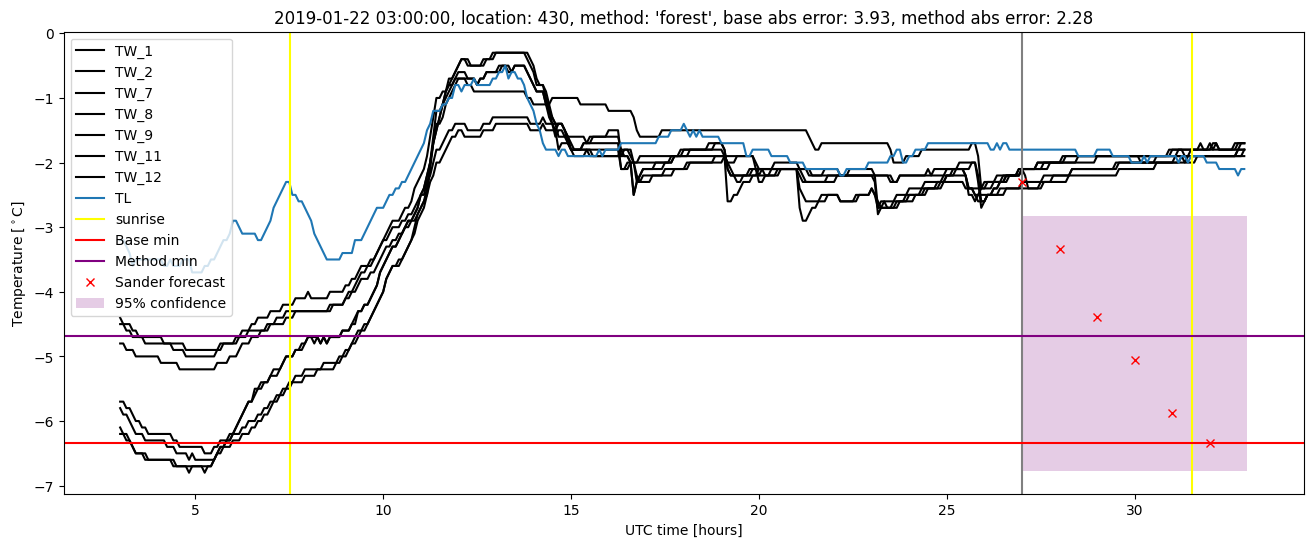
| forest |
winter 2019 |
1.000 |
0.128 |
0.540 |
0.518 |
2.307 |
0.466 |
1.663 |
| baseline |
all |
0.969 |
0.078 |
0.784 |
0.622 |
3.935 |
NaN |
NaN |
| forest |
all |
0.976 |
0.078 |
0.581 |
0.561 |
2.591 |
0.473 |
1.932 |
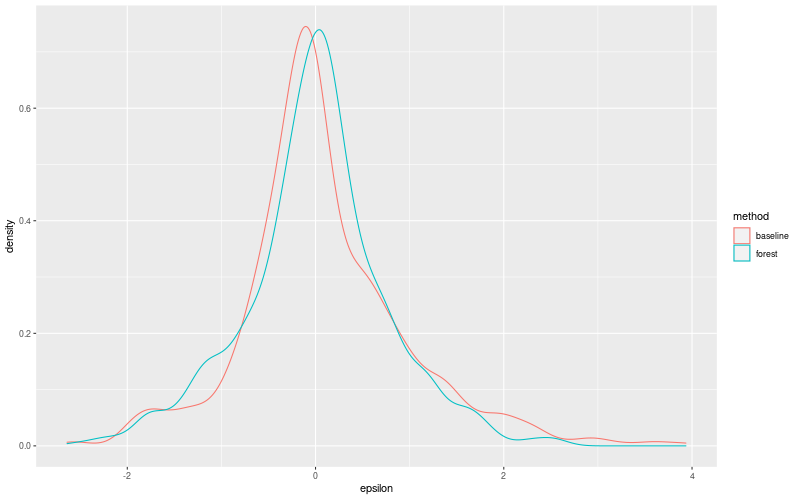
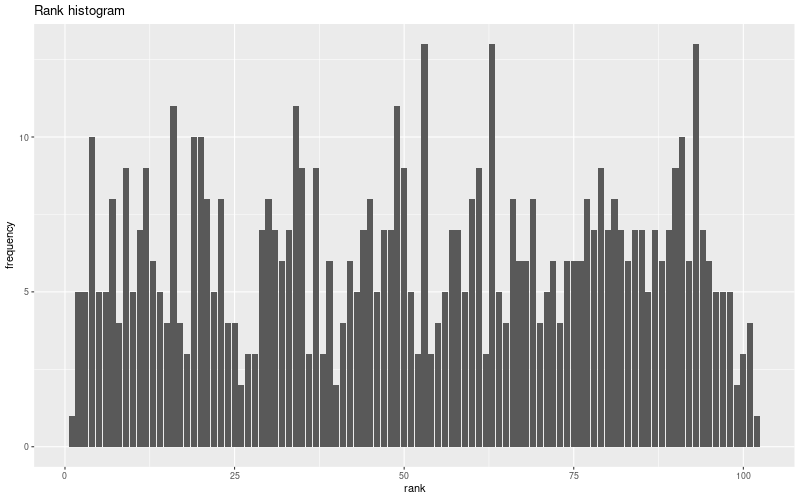
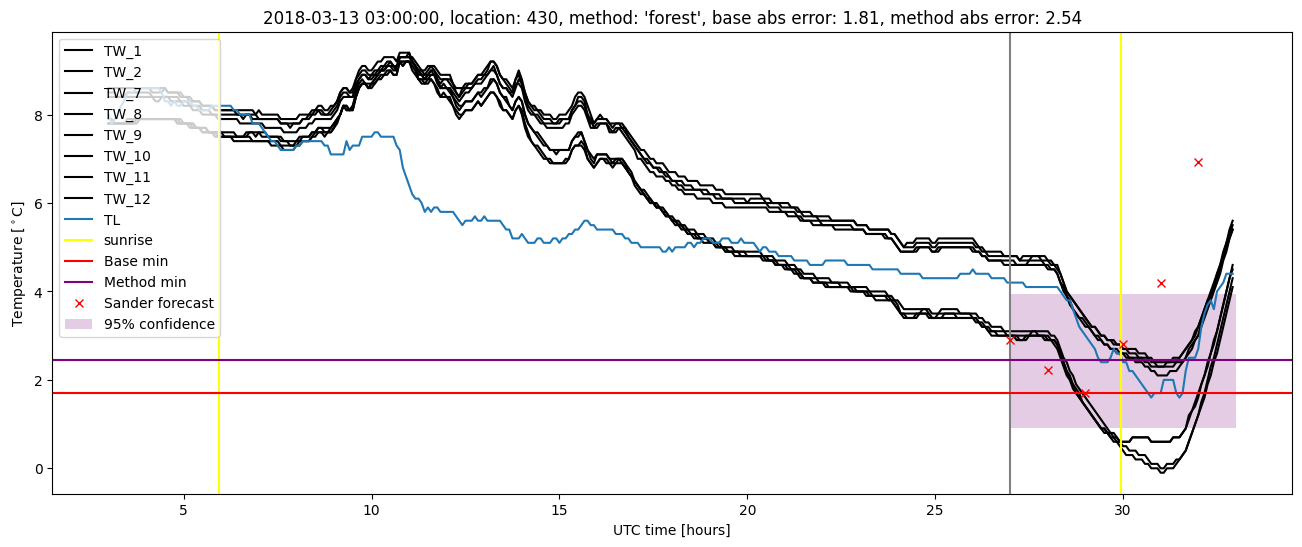
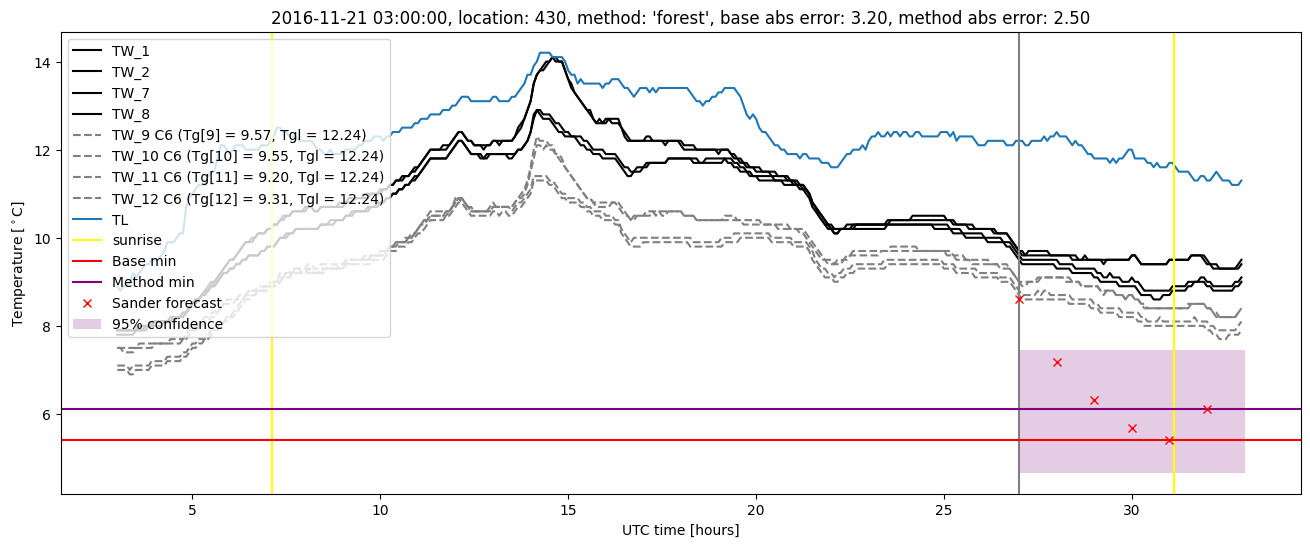
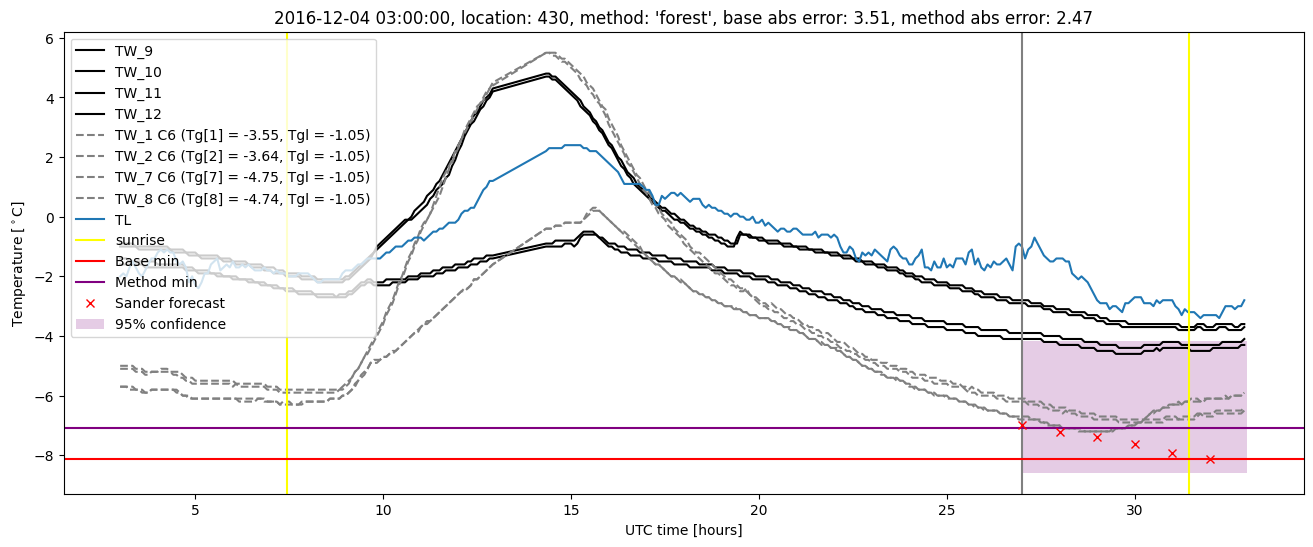
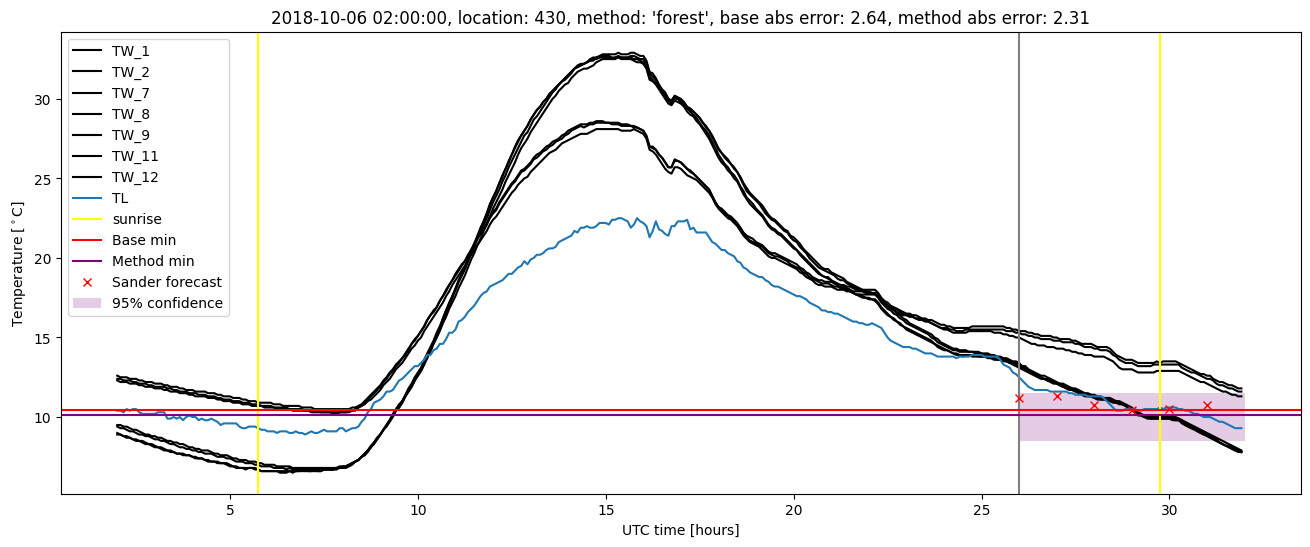
Random forest plots
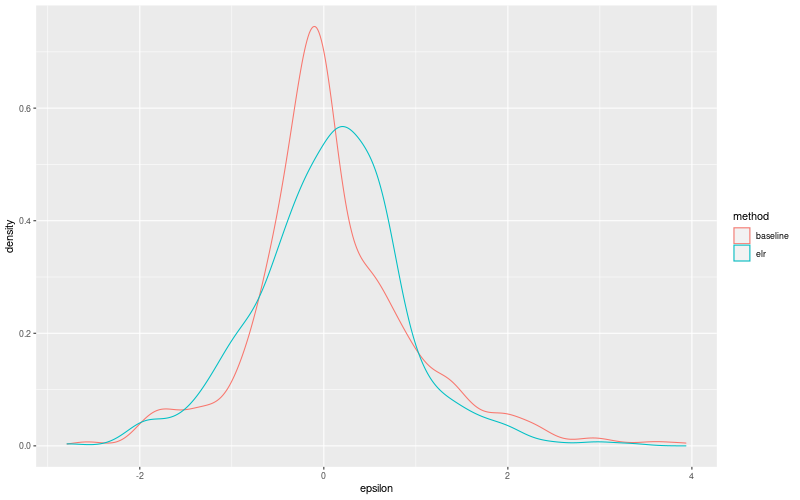
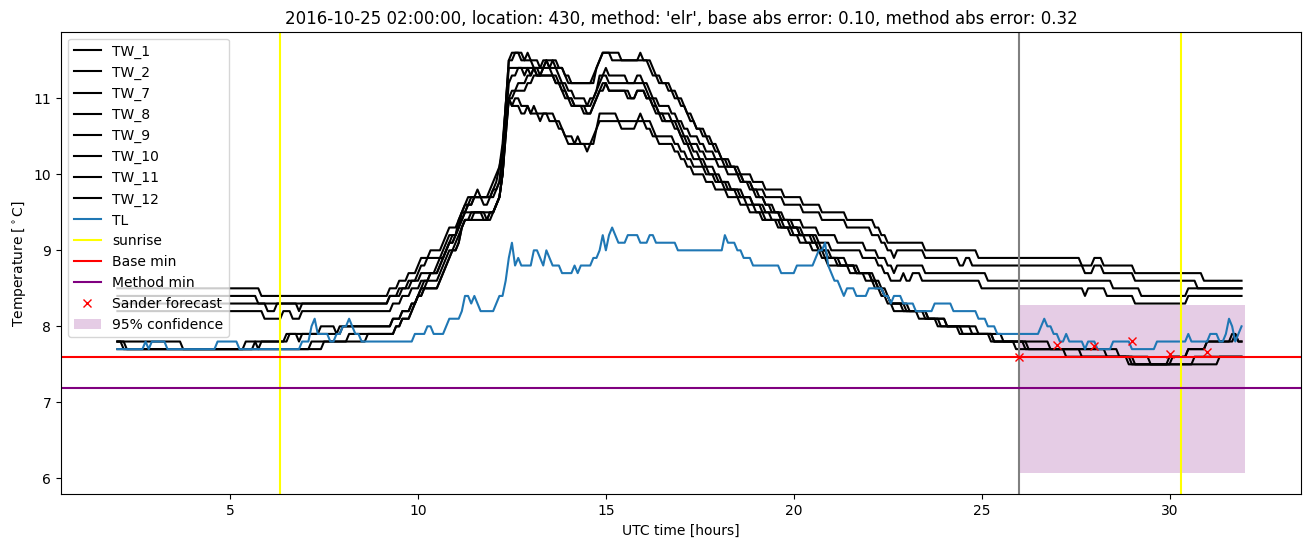
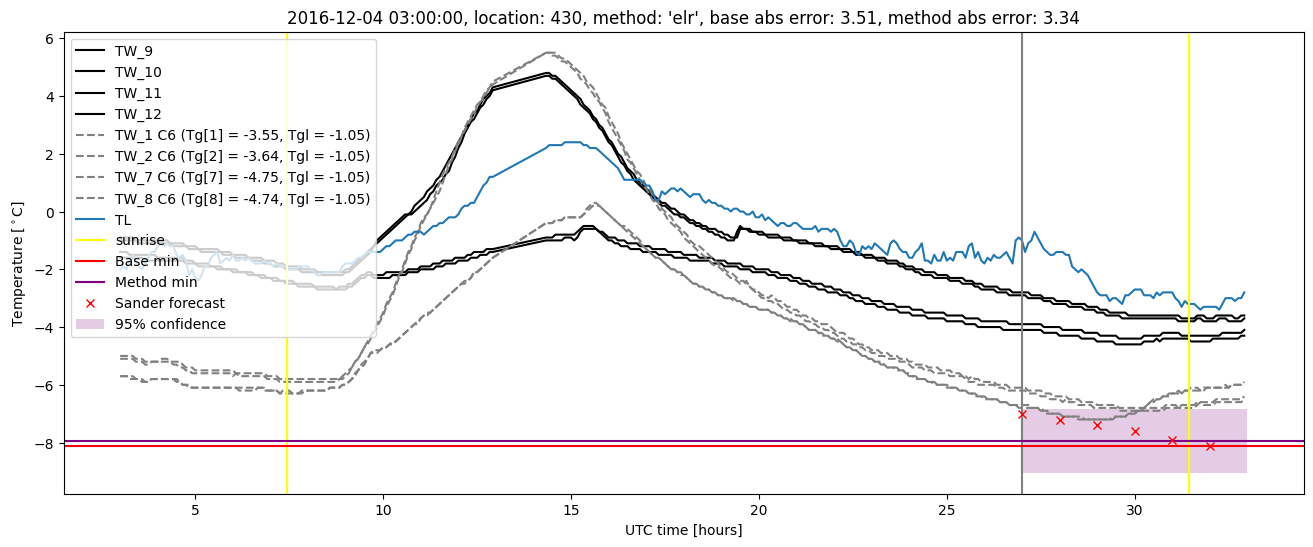
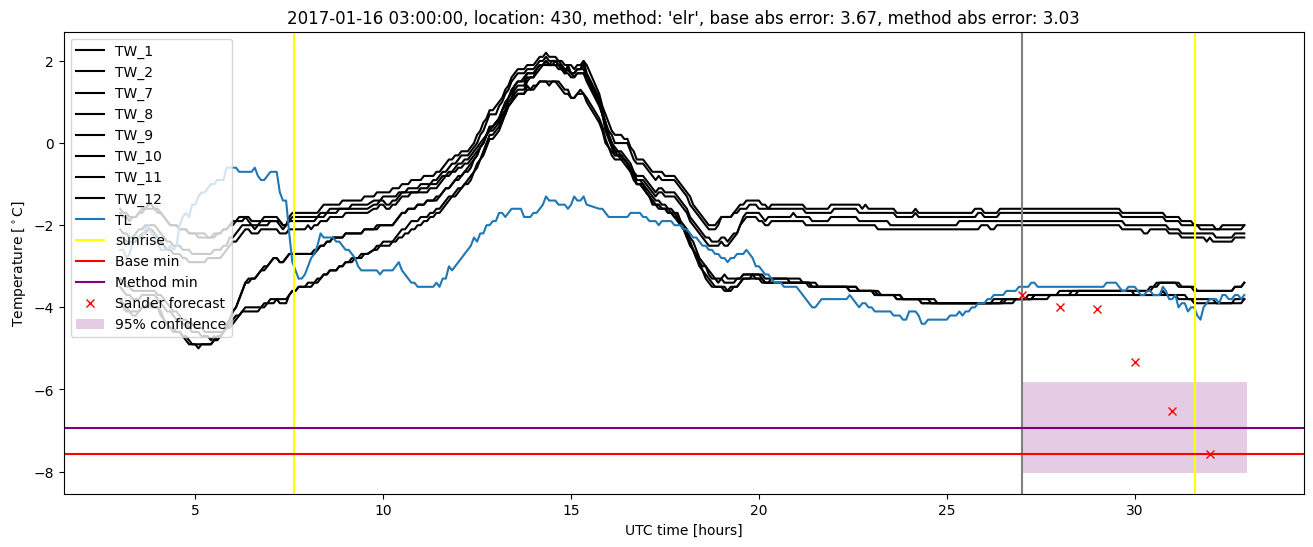
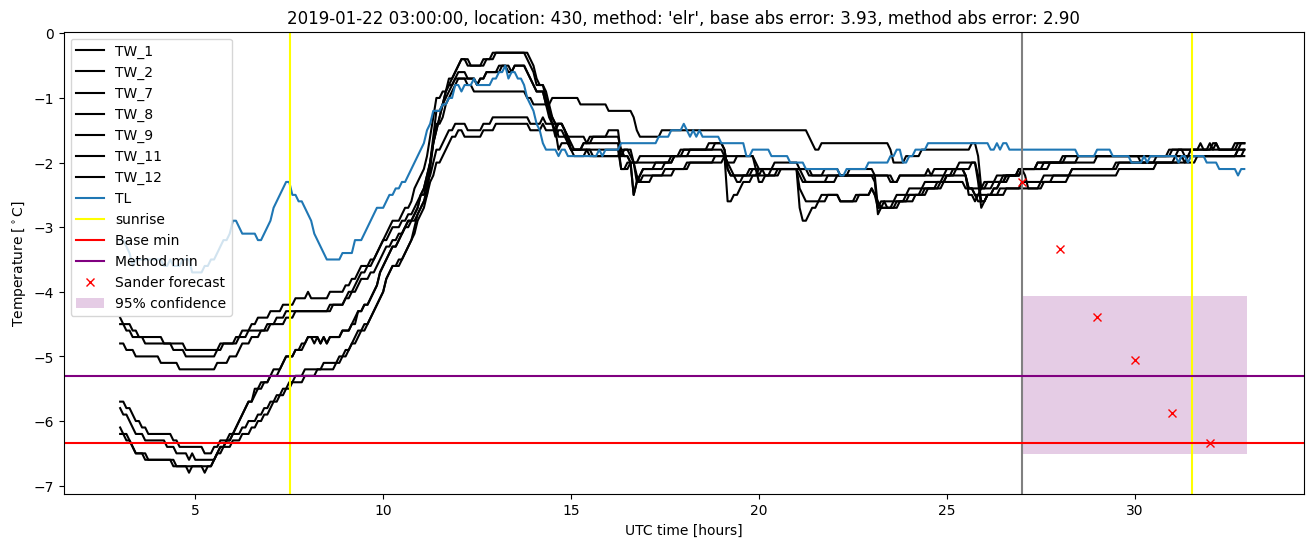
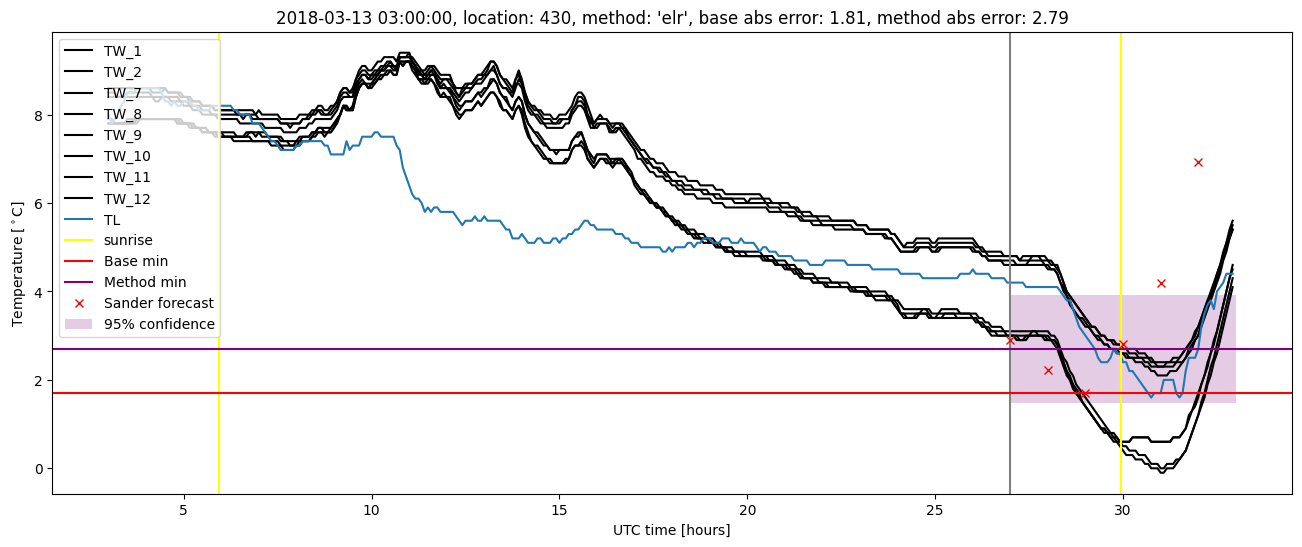
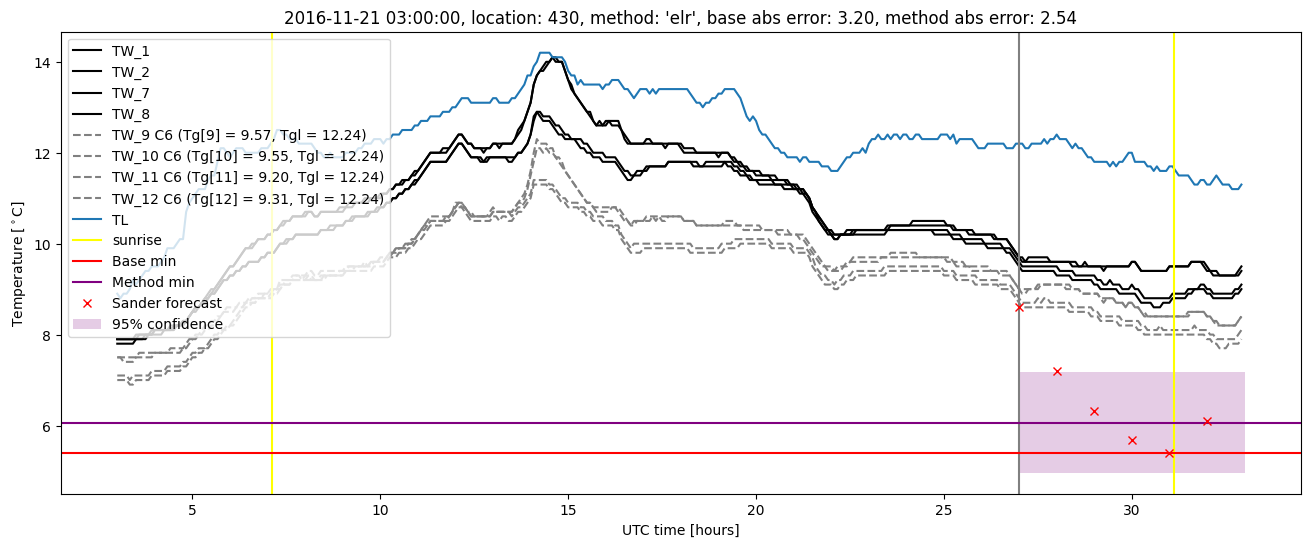
Extended logistic regression results
| names |
period |
power |
significance |
meanSquareError |
absError |
maxError |
CRPS |
IGN |
| baseline |
winter 2016 |
0.958 |
0.116 |
0.708 |
0.623 |
2.987 |
NaN |
NaN |
| elr |
winter 2016 |
0.972 |
0.070 |
0.591 |
0.594 |
2.354 |
0.516 |
1.657 |
| baseline |
winter 2017 |
0.969 |
0.054 |
1.160 |
0.749 |
3.668 |
NaN |
NaN |
| elr |
winter 2017 |
0.990 |
0.054 |
0.867 |
0.691 |
3.340 |
0.522 |
2.047 |
| baseline |
winter 2018 |
0.965 |
0.095 |
0.504 |
0.516 |
2.354 |
NaN |
NaN |
| elr |
winter 2018 |
0.965 |
0.143 |
0.571 |
0.610 |
2.790 |
0.566 |
1.897 |
| baseline |
winter 2019 |
0.990 |
0.051 |
0.785 |
0.600 |
3.935 |
NaN |
NaN |
| elr |
winter 2019 |
1.000 |
0.179 |
0.564 |
0.553 |
2.896 |
0.497 |
1.553 |
| baseline |
all |
0.969 |
0.078 |
0.784 |
0.622 |
3.935 |
NaN |
NaN |
| elr |
all |
0.980 |
0.106 |
0.646 |
0.612 |
3.340 |
0.525 |
1.786 |
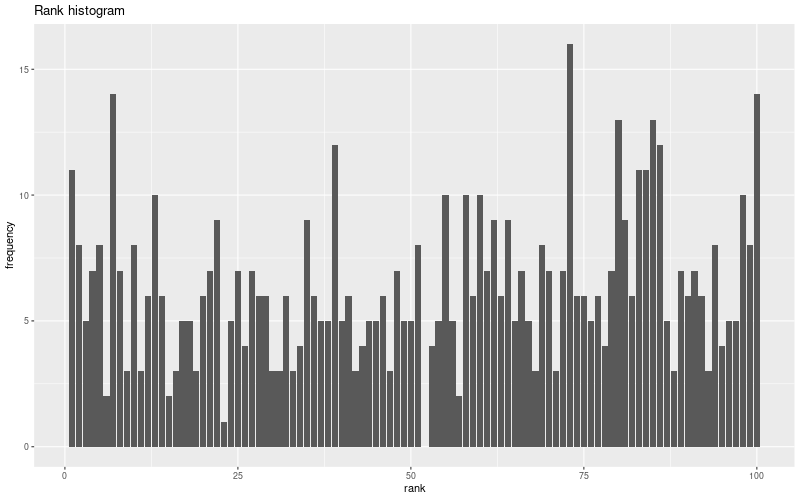
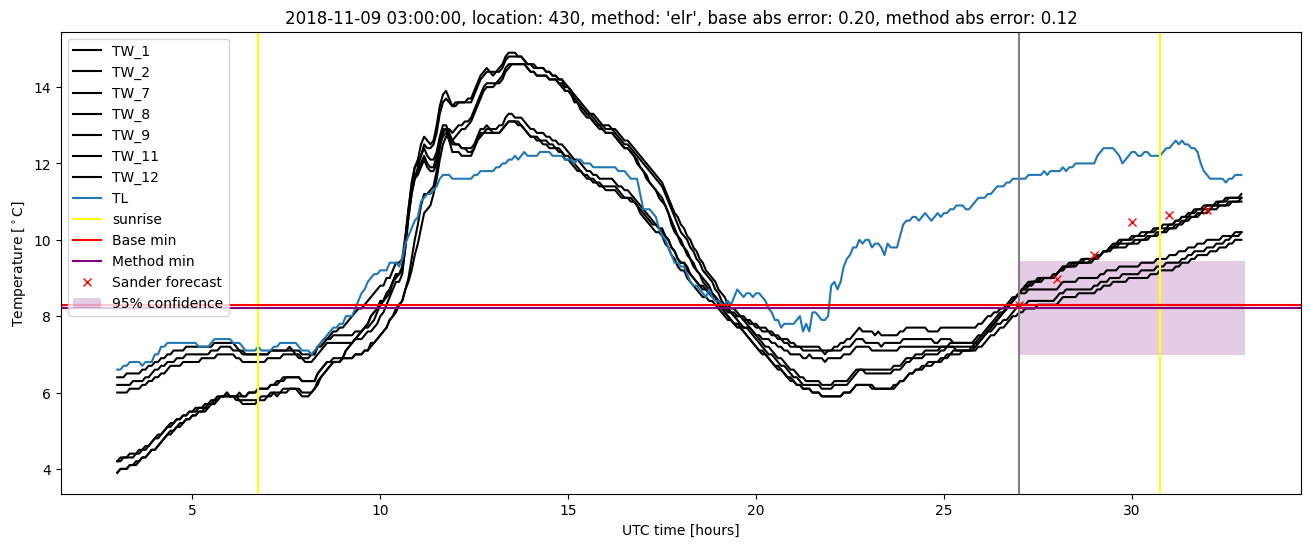
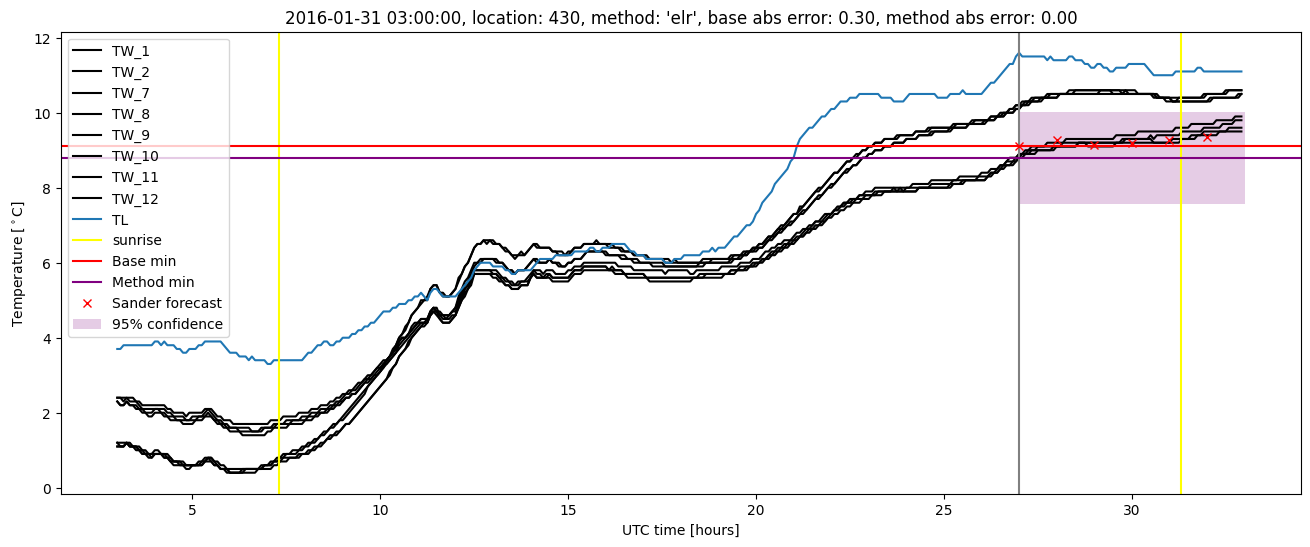
Extended logistic regression plots