GMS location: 427
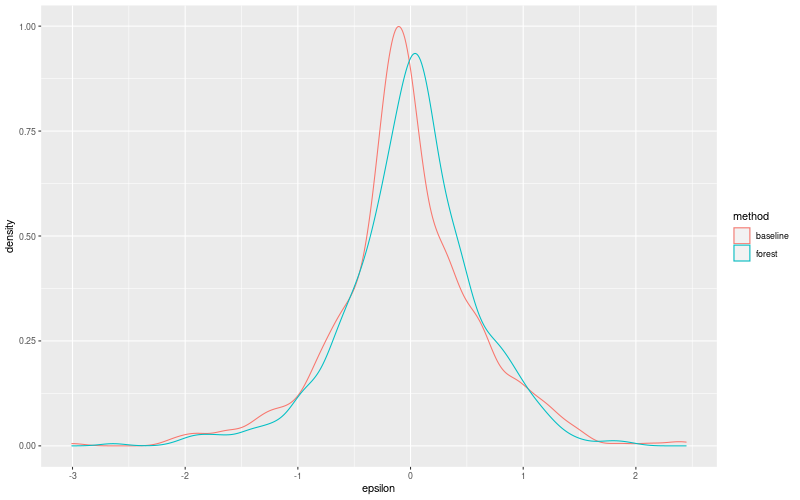
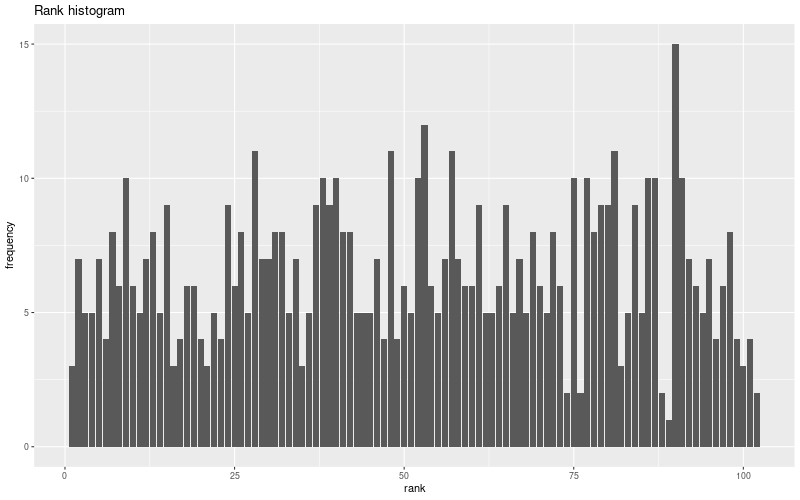
Random forest results
| names |
period |
power |
significance |
meanSquareError |
absError |
maxError |
CRPS |
IGN |
| baseline |
winter 2016 |
0.982 |
0.172 |
0.298 |
0.401 |
2.011 |
NaN |
NaN |
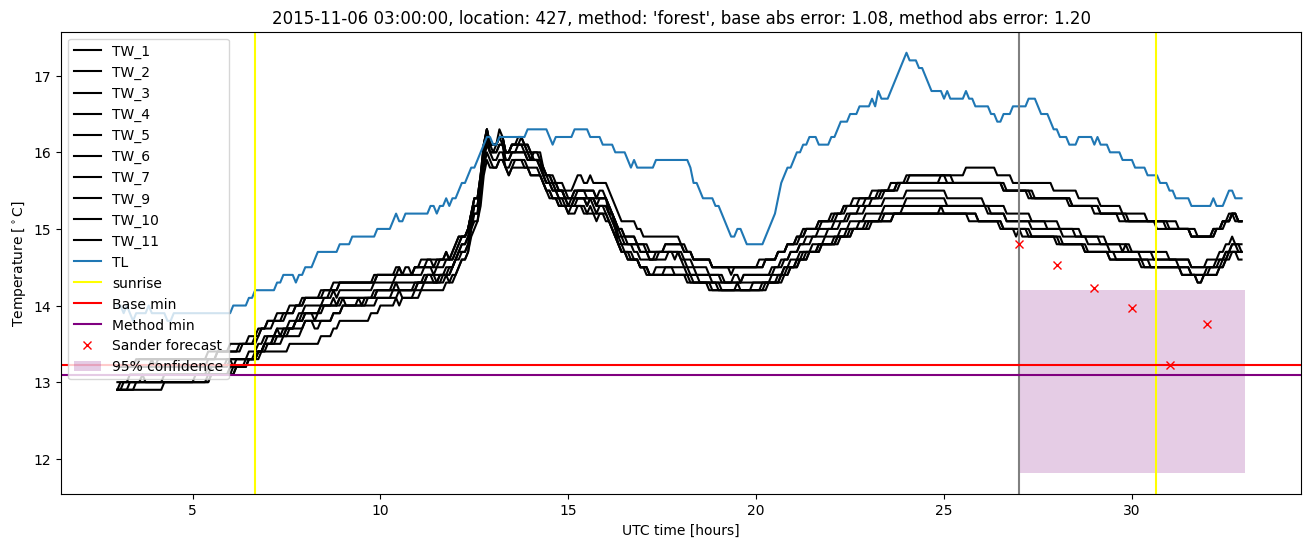
| forest |
winter 2016 |
0.963 |
0.138 |
0.274 |
0.402 |
1.946 |
0.503 |
2.741 |
| baseline |
winter 2017 |
0.962 |
0.067 |
0.515 |
0.528 |
2.344 |
NaN |
NaN |
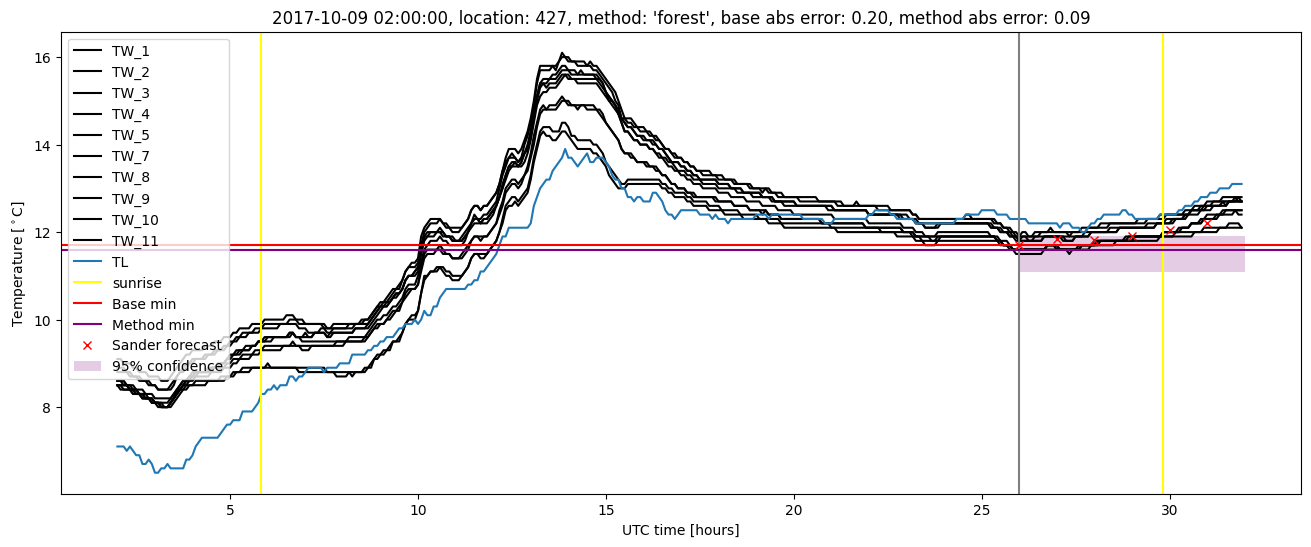
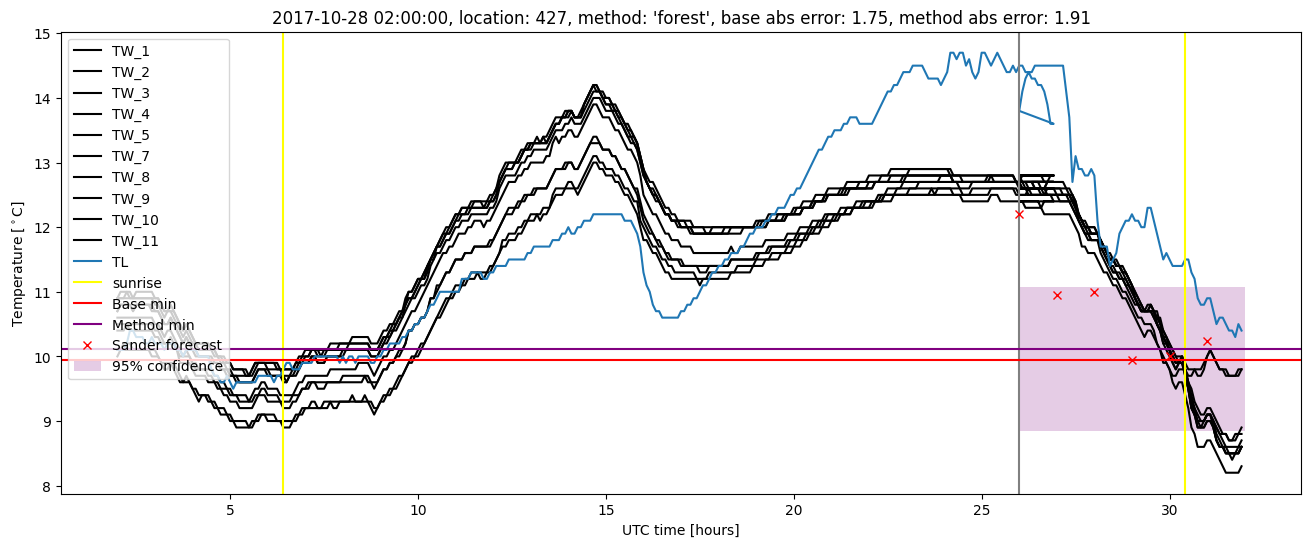
| forest |
winter 2017 |
0.962 |
0.067 |
0.394 |
0.465 |
2.052 |
0.489 |
2.995 |
| baseline |
winter 2018 |
0.993 |
0.077 |
0.405 |
0.445 |
3.006 |
NaN |
NaN |
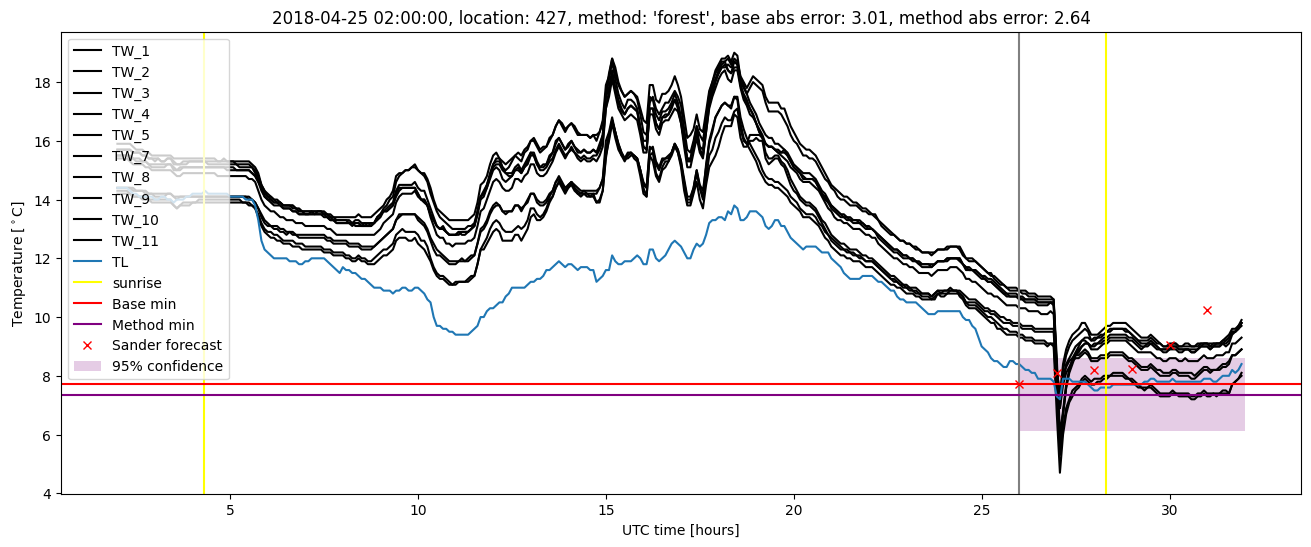
| forest |
winter 2018 |
0.985 |
0.077 |
0.343 |
0.417 |
2.640 |
0.490 |
2.773 |
| baseline |
winter 2019 |
0.992 |
0.056 |
0.415 |
0.469 |
2.446 |
NaN |
NaN |
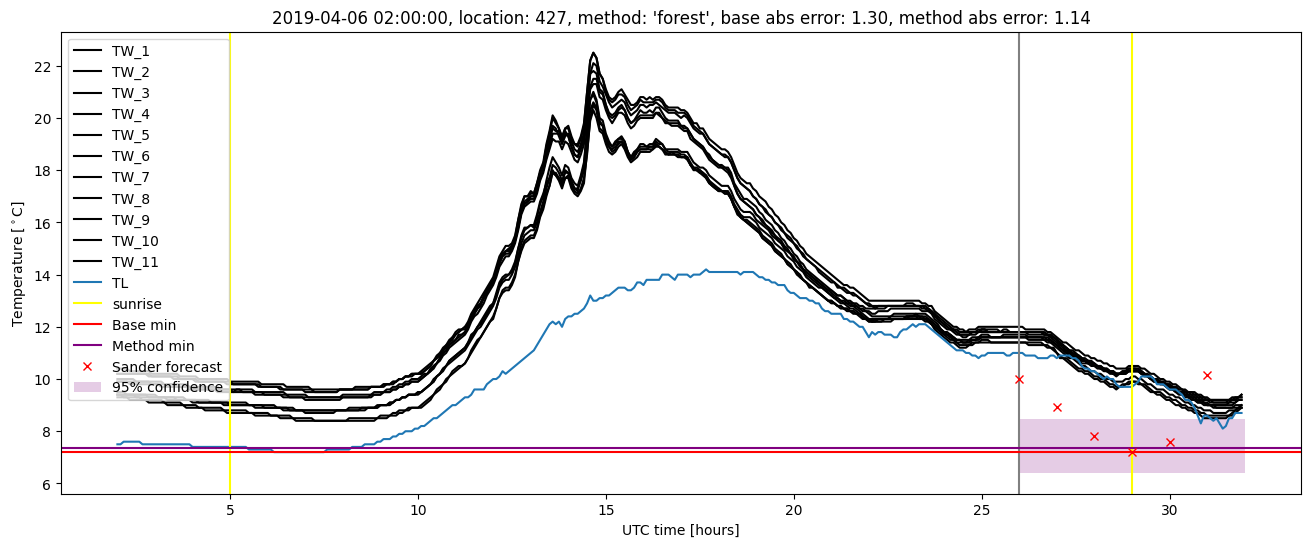
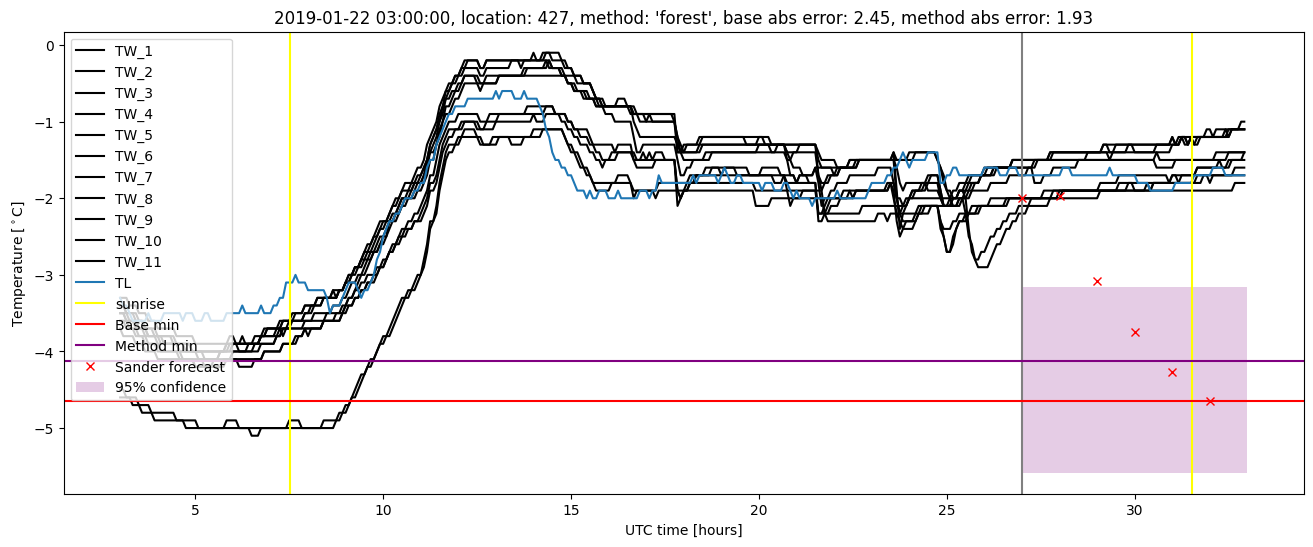
| forest |
winter 2019 |
0.992 |
0.000e+00 |
0.325 |
0.411 |
1.928 |
0.489 |
2.497 |
| baseline |
all |
0.983 |
0.092 |
0.401 |
0.457 |
3.006 |
NaN |
NaN |
| forest |
all |
0.976 |
0.076 |
0.331 |
0.422 |
2.640 |
0.493 |
2.752 |
Random forest plots


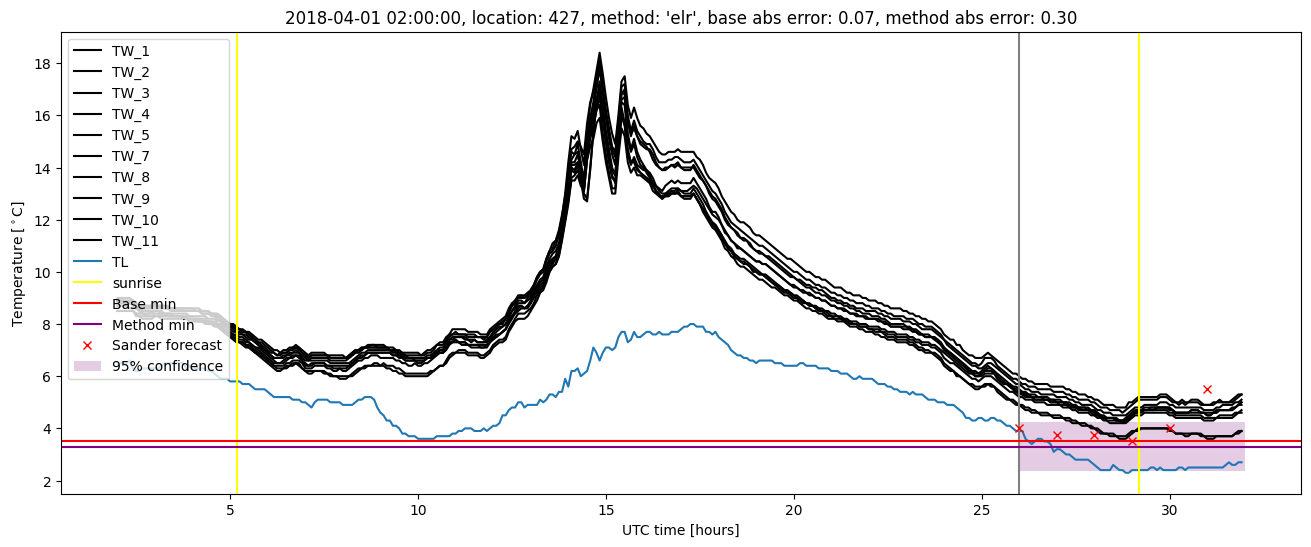
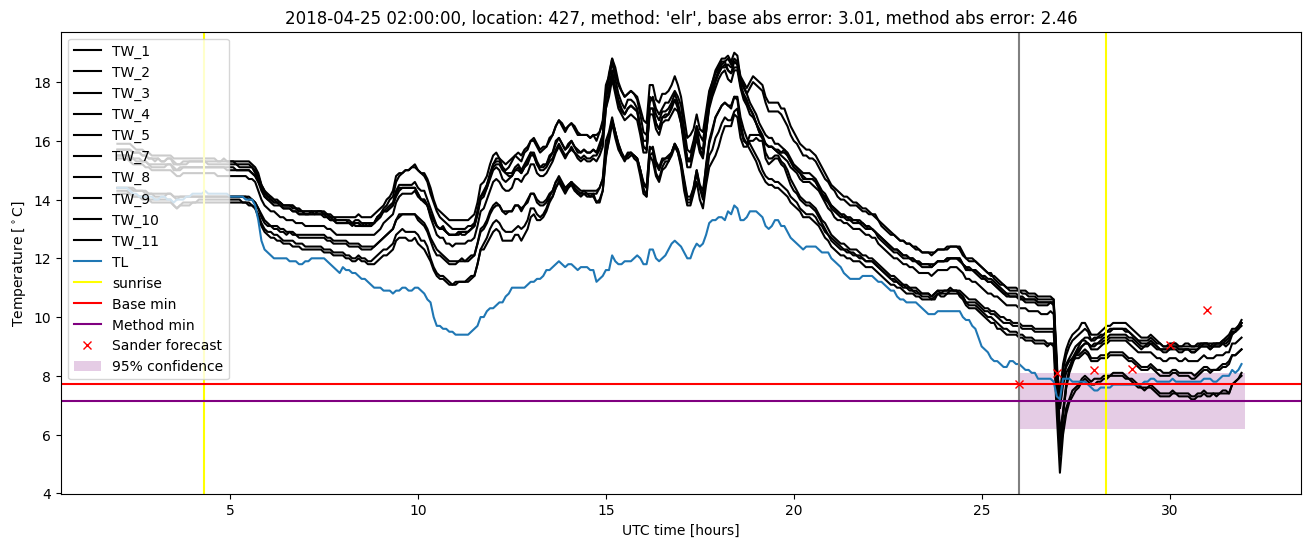
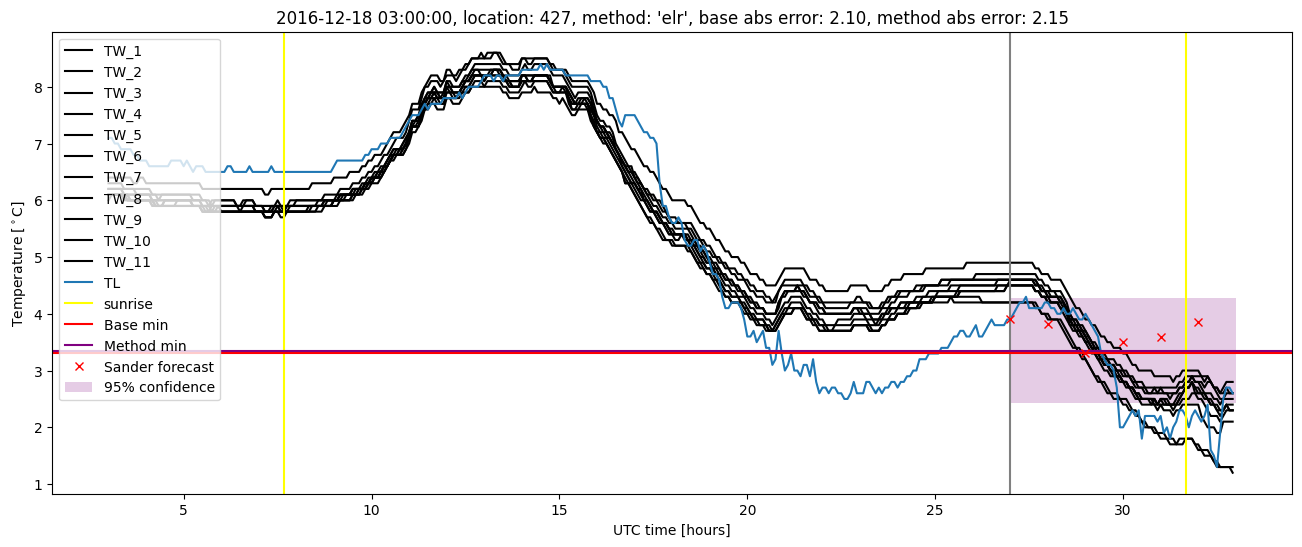
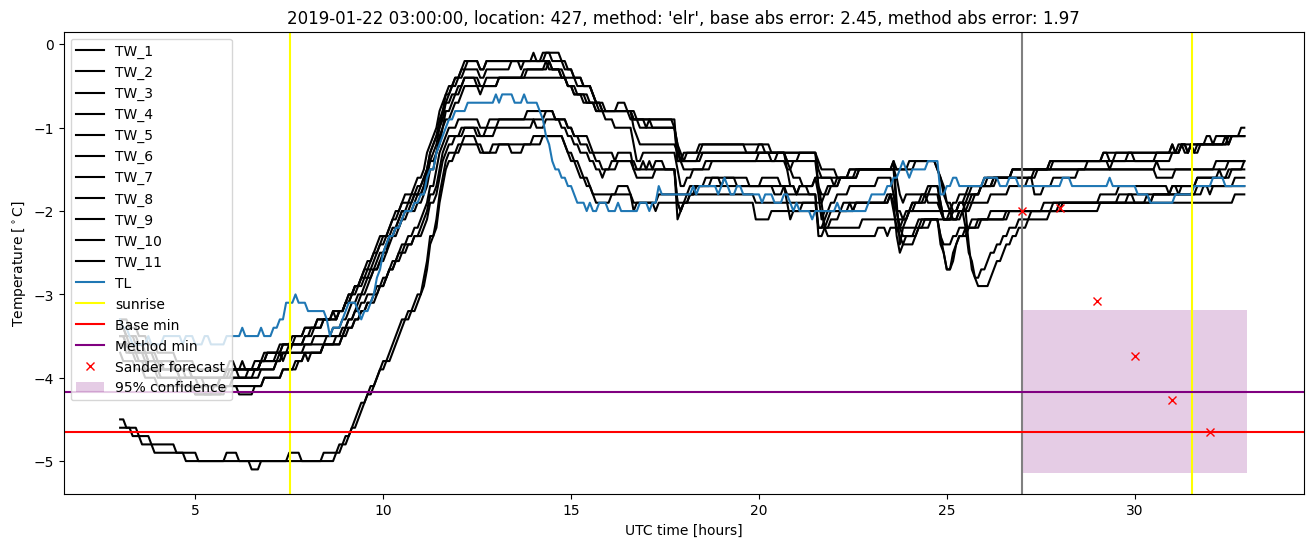
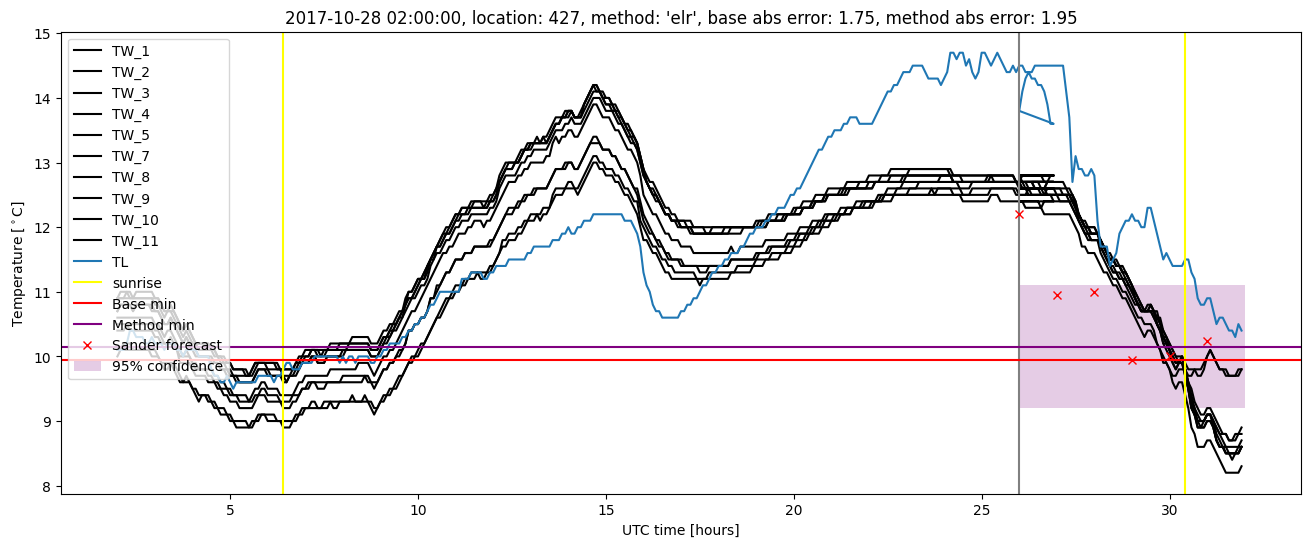
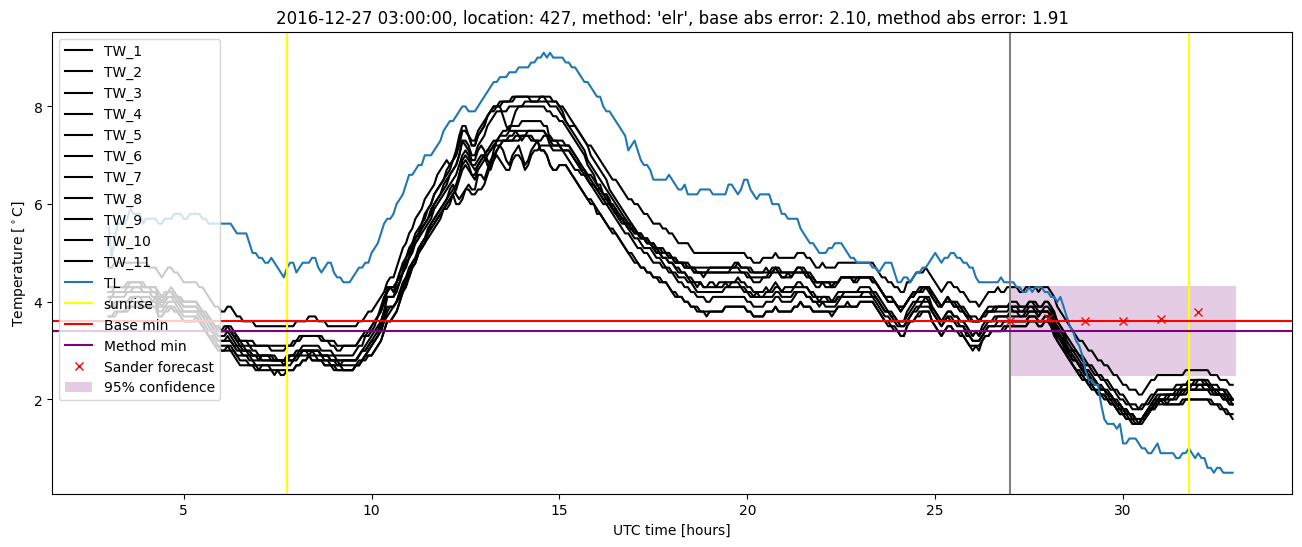
Extended logistic regression results
| names |
period |
power |
significance |
meanSquareError |
absError |
maxError |
CRPS |
IGN |
| baseline |
winter 2016 |
0.982 |
0.172 |
0.298 |
0.401 |
2.011 |
NaN |
NaN |
| elr |
winter 2016 |
0.957 |
0.035 |
0.295 |
0.426 |
1.780 |
0.596 |
3.618 |
| baseline |
winter 2017 |
0.962 |
0.067 |
0.515 |
0.528 |
2.344 |
NaN |
NaN |
| elr |
winter 2017 |
0.962 |
0.067 |
0.437 |
0.505 |
2.152 |
0.542 |
3.652 |
| baseline |
winter 2018 |
0.993 |
0.077 |
0.405 |
0.445 |
3.006 |
NaN |
NaN |
| elr |
winter 2018 |
0.993 |
0.077 |
0.347 |
0.429 |
2.457 |
0.552 |
3.460 |
| baseline |
winter 2019 |
0.992 |
0.056 |
0.415 |
0.469 |
2.446 |
NaN |
NaN |
| elr |
winter 2019 |
0.992 |
0.056 |
0.321 |
0.423 |
1.968 |
0.536 |
2.999 |
| baseline |
all |
0.983 |
0.092 |
0.401 |
0.457 |
3.006 |
NaN |
NaN |
| elr |
all |
0.976 |
0.061 |
0.346 |
0.444 |
2.457 |
0.559 |
3.446 |
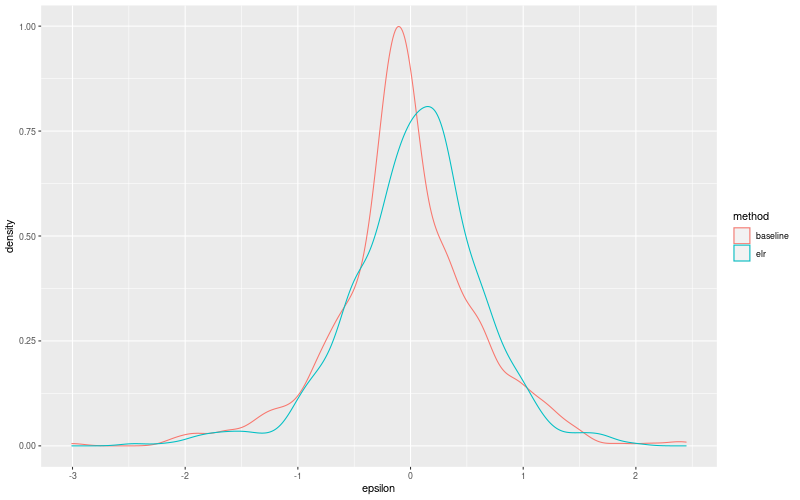
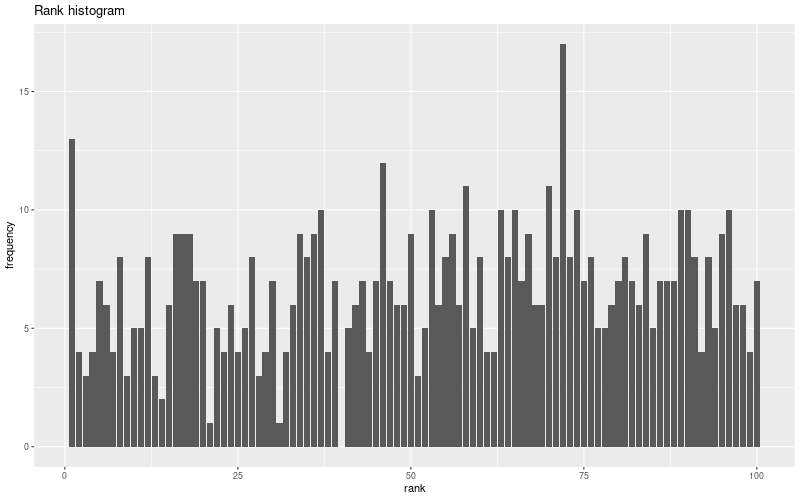
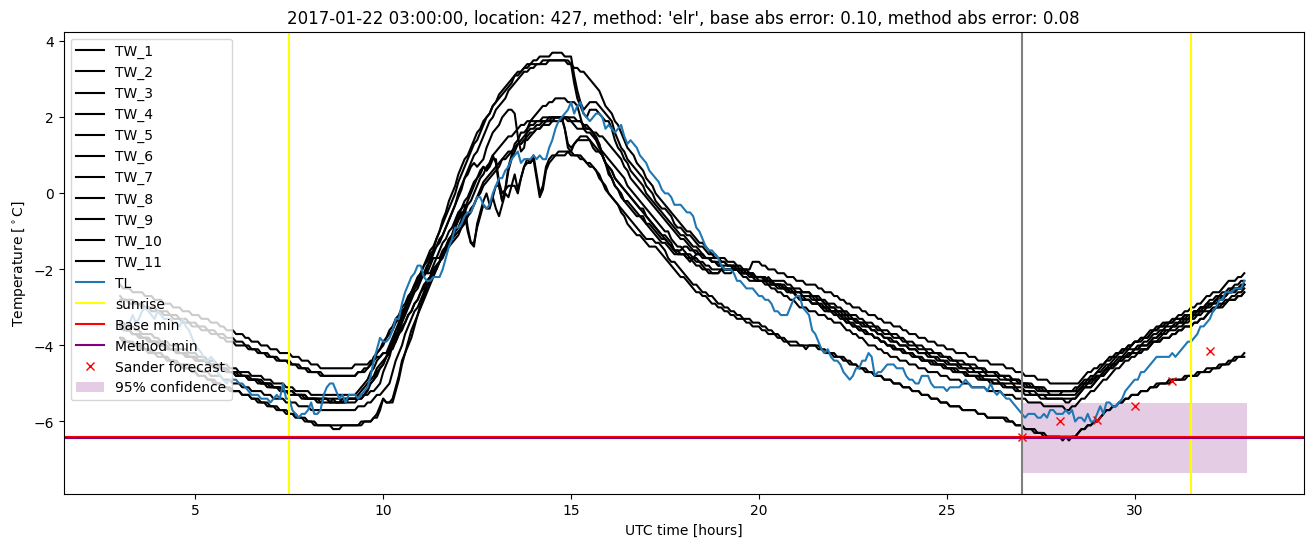
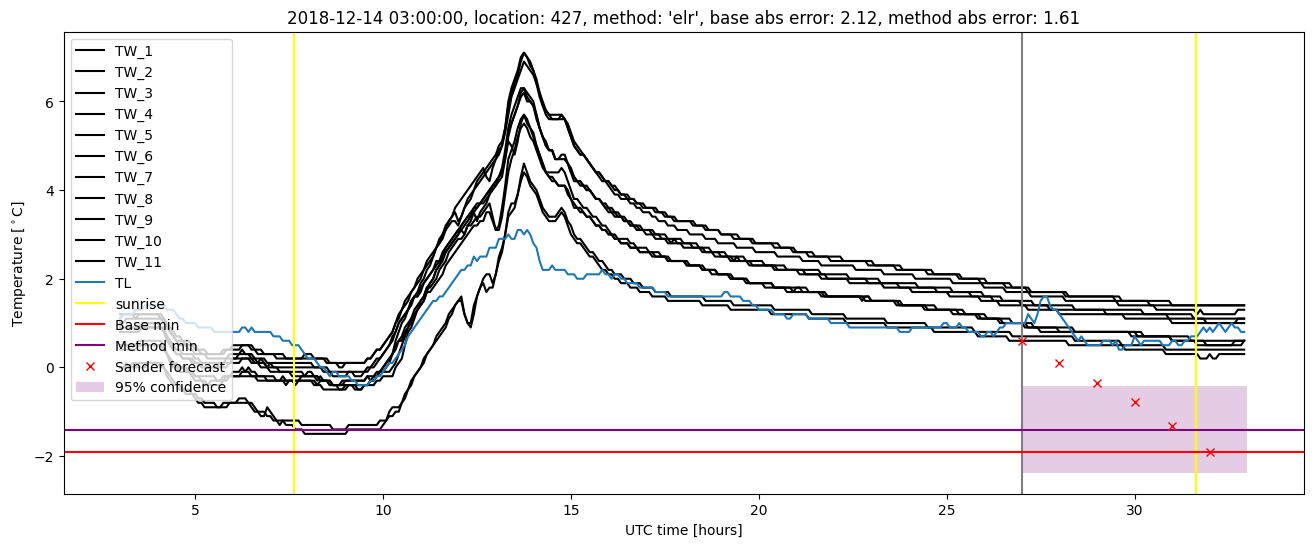
Extended logistic regression plots