GMS location: 426
Random forest results
| names |
period |
power |
significance |
meanSquareError |
absError |
maxError |
CRPS |
IGN |
| baseline |
winter 2016 |
0.952 |
0.120 |
1.127 |
0.667 |
6.555 |
NaN |
NaN |
| forest |
winter 2016 |
0.939 |
0.120 |
1.034 |
0.628 |
6.335 |
0.503 |
6.391 |
| baseline |
winter 2017 |
0.982 |
0.024 |
0.360 |
0.431 |
2.205 |
NaN |
NaN |
| forest |
winter 2017 |
0.991 |
0.000e+00 |
0.306 |
0.415 |
1.700 |
0.480 |
1.497 |
| baseline |
winter 2018 |
1.000 |
0.107 |
0.313 |
0.399 |
2.314 |
NaN |
NaN |
| forest |
winter 2018 |
1.000 |
0.107 |
0.280 |
0.400 |
2.004 |
0.465 |
1.381 |
| baseline |
winter 2019 |
1.000 |
0.000e+00 |
0.243 |
0.364 |
1.812 |
NaN |
NaN |
| forest |
winter 2019 |
1.000 |
0.000e+00 |
0.209 |
0.342 |
1.561 |
0.461 |
1.339 |
| baseline |
all |
0.981 |
0.068 |
0.557 |
0.481 |
6.555 |
NaN |
NaN |
| forest |
all |
0.979 |
0.058 |
0.501 |
0.461 |
6.335 |
0.479 |
2.926 |
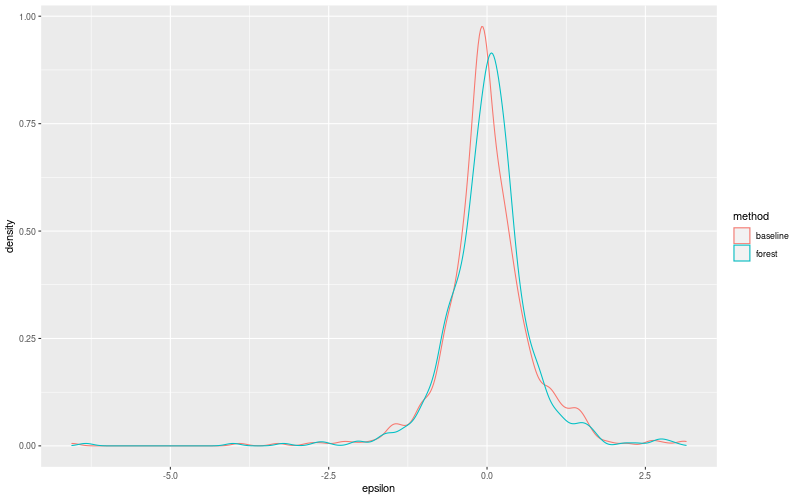
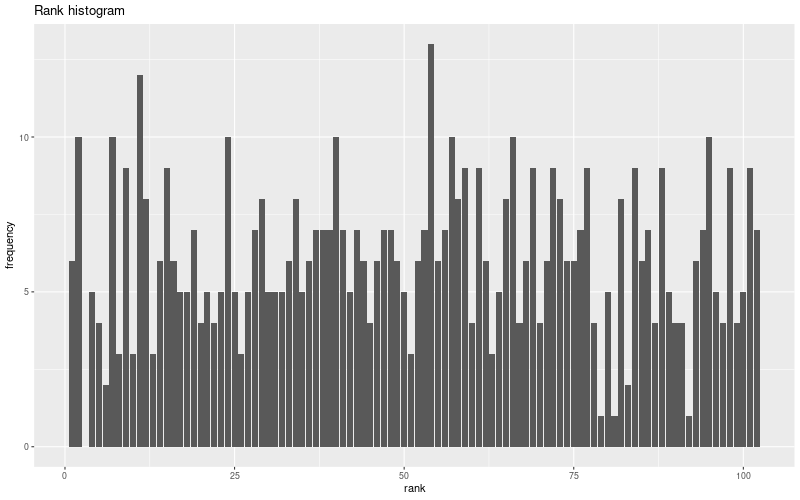
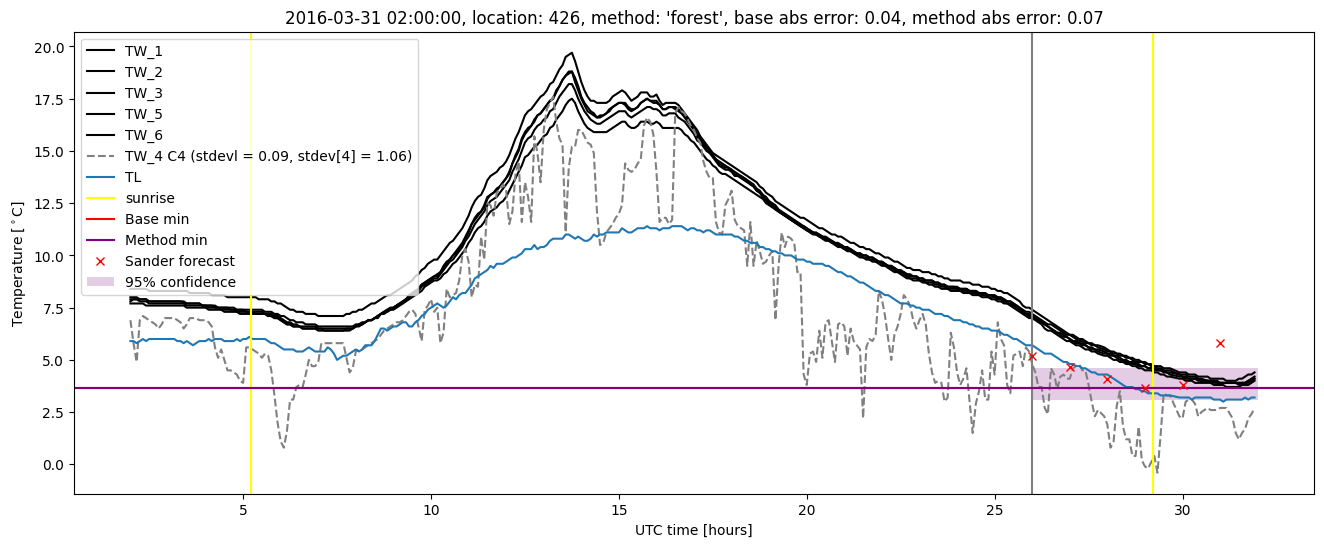
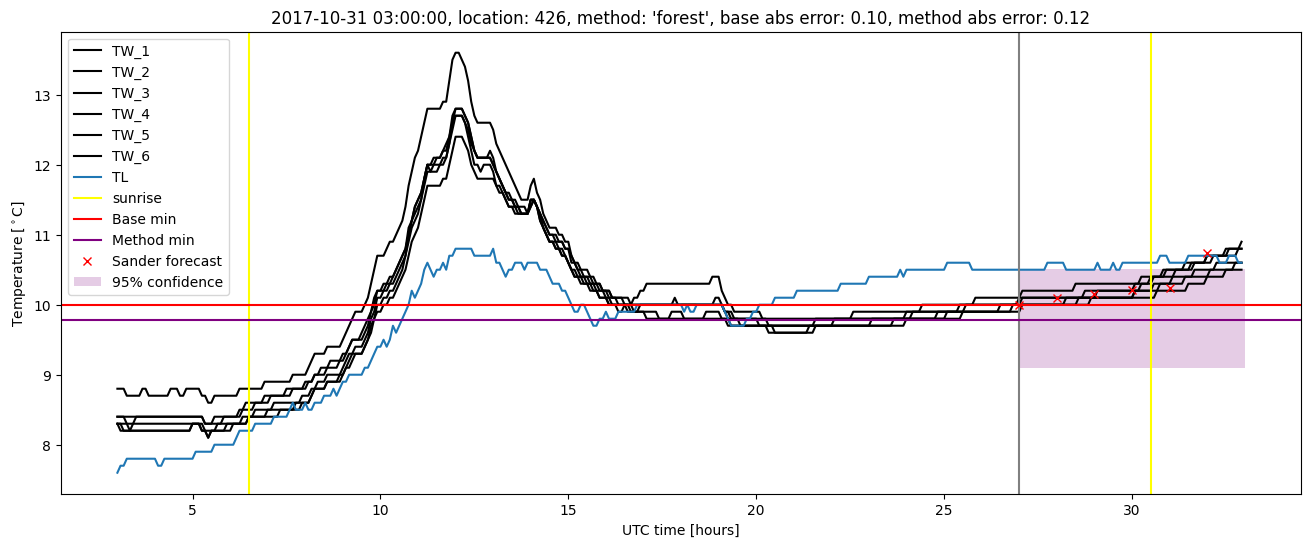
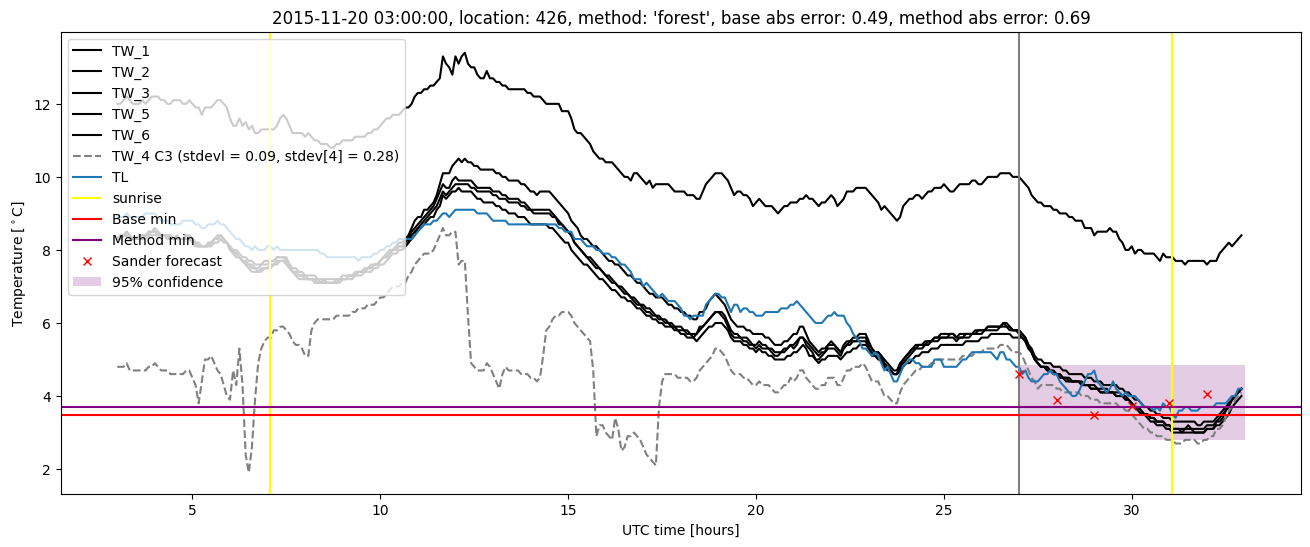
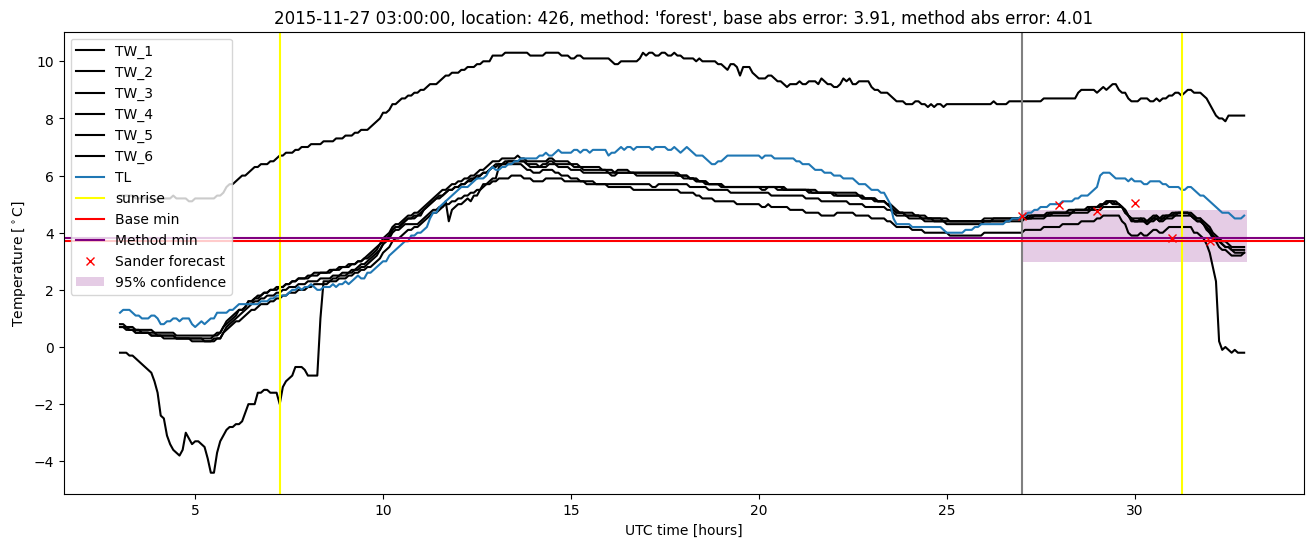
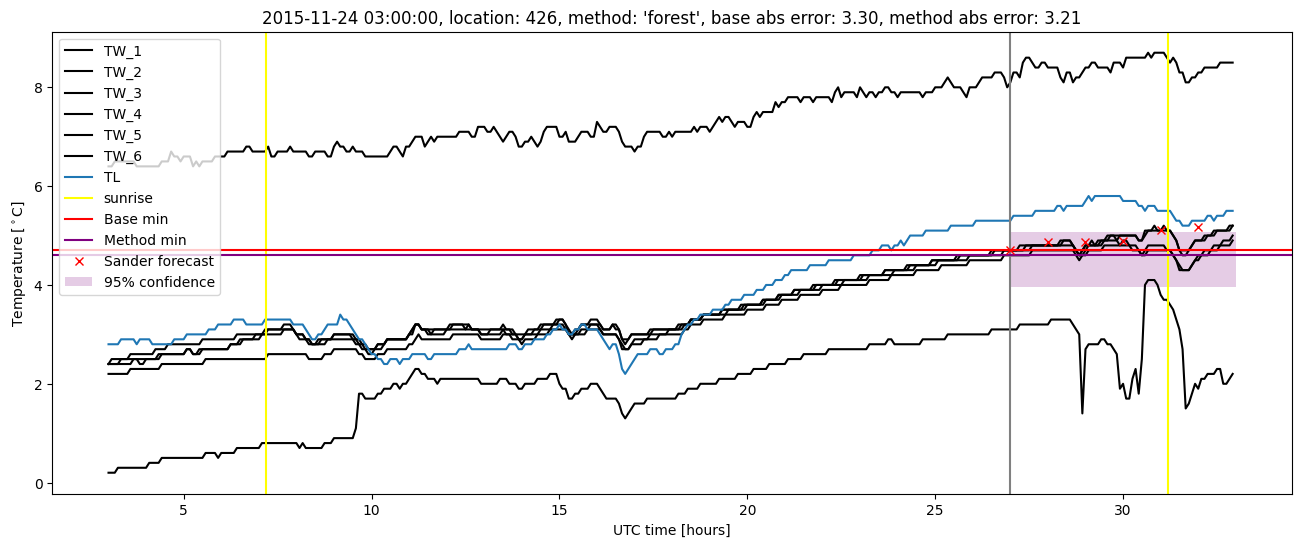
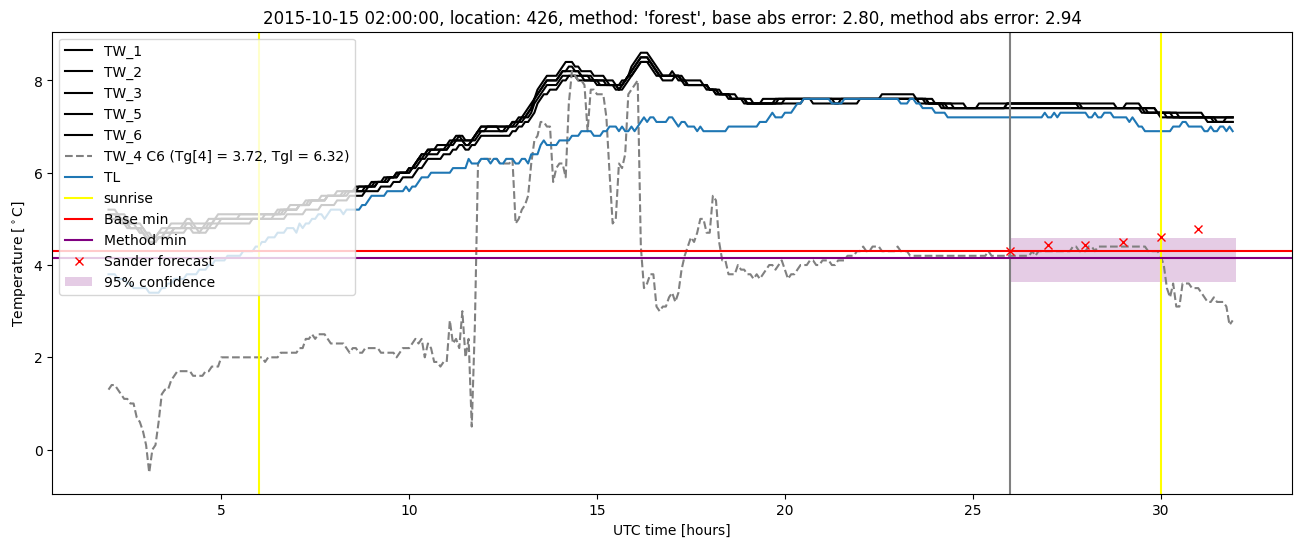
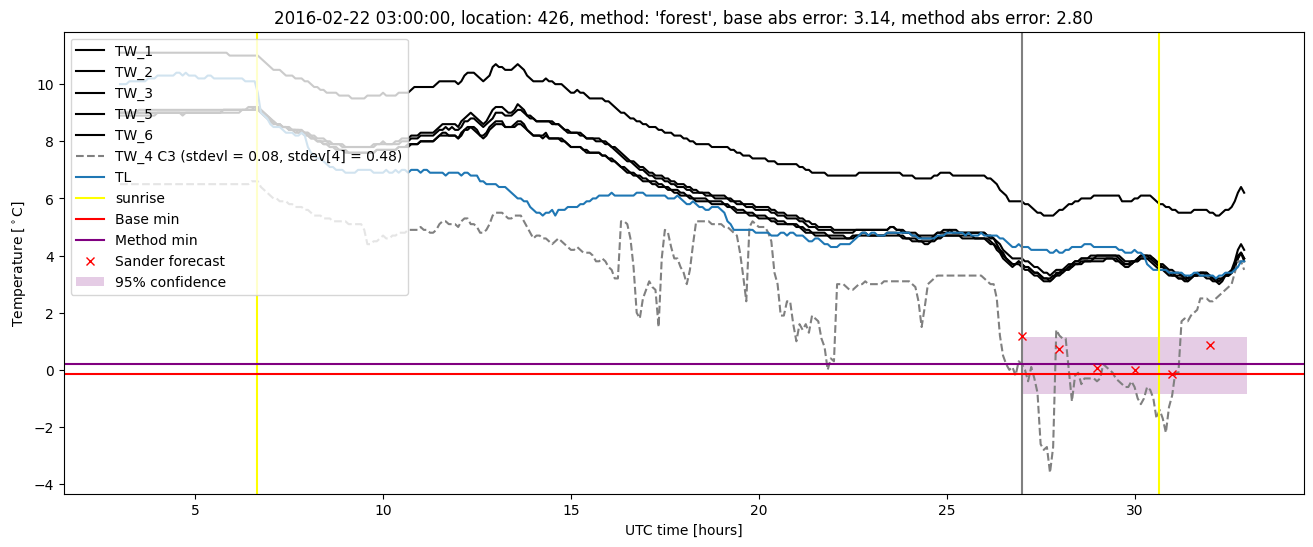
Random forest plots

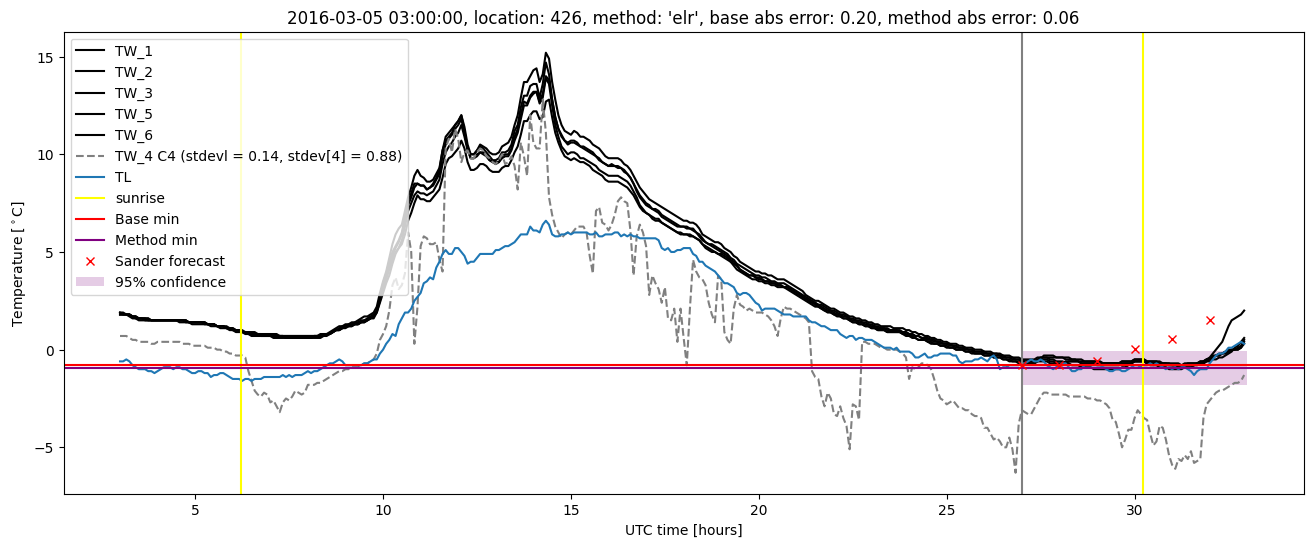
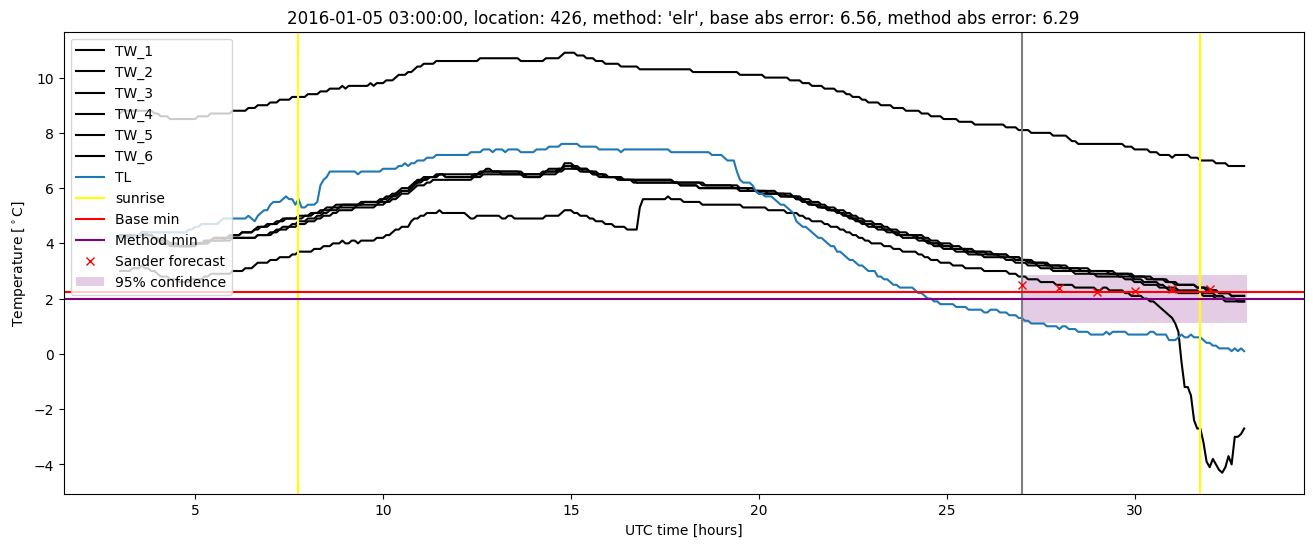
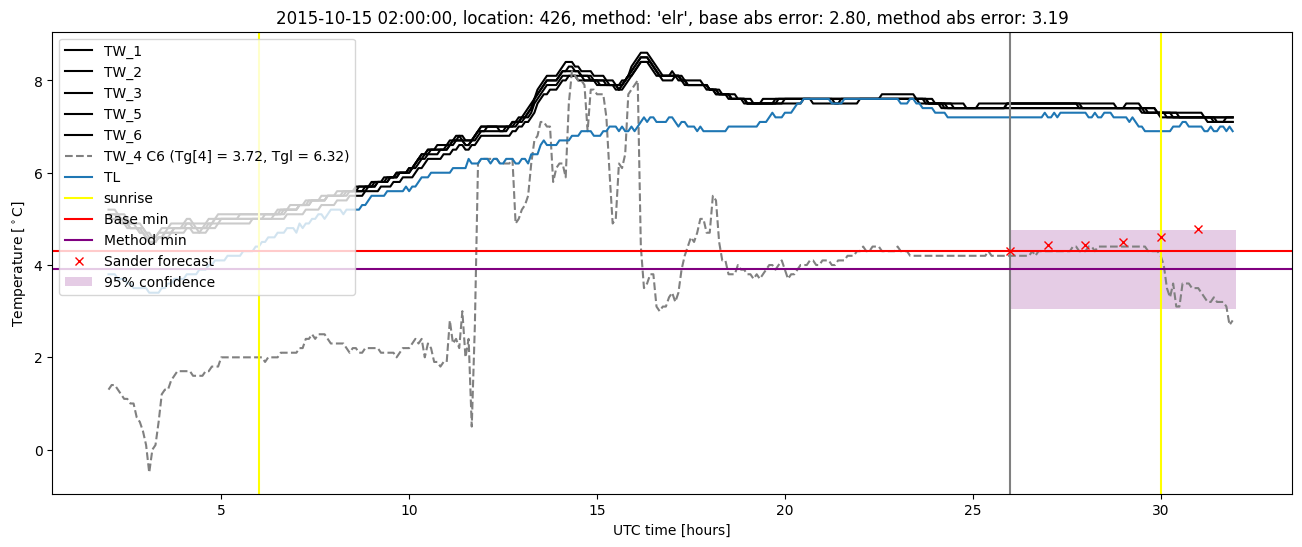
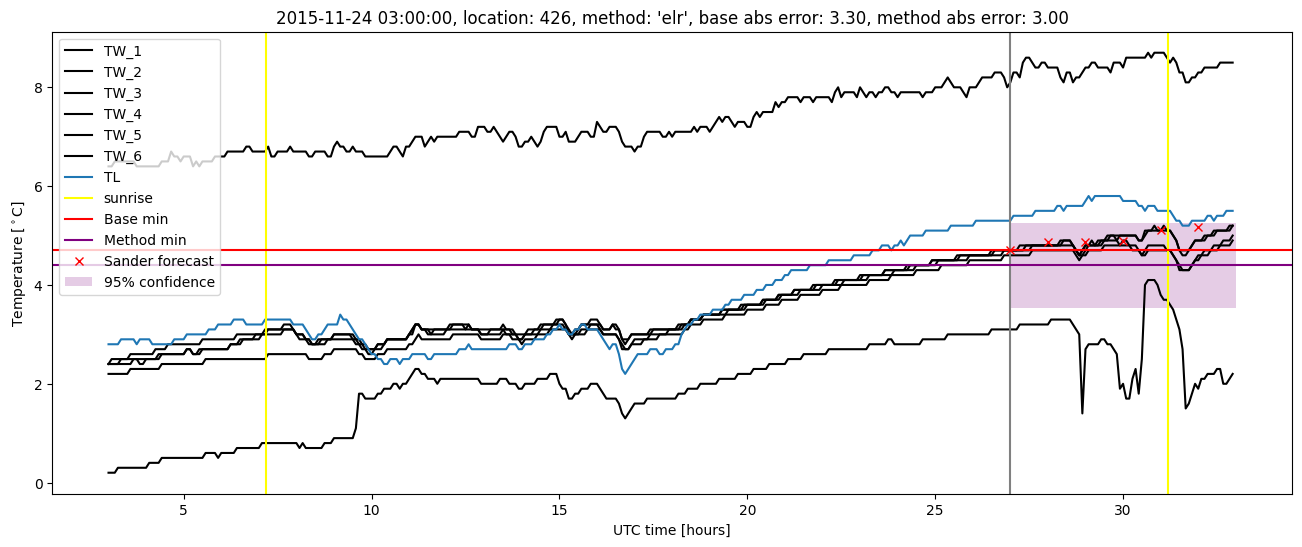
Extended logistic regression results
| names |
period |
power |
significance |
meanSquareError |
absError |
maxError |
CRPS |
IGN |
| baseline |
winter 2016 |
0.952 |
0.120 |
1.127 |
0.667 |
6.555 |
NaN |
NaN |
| elr |
winter 2016 |
0.927 |
0.120 |
1.071 |
0.666 |
6.287 |
0.566 |
5.027 |
| baseline |
winter 2017 |
0.982 |
0.024 |
0.360 |
0.431 |
2.205 |
NaN |
NaN |
| elr |
winter 2017 |
0.991 |
0.024 |
0.345 |
0.438 |
2.075 |
0.467 |
1.495 |
| baseline |
winter 2018 |
1.000 |
0.107 |
0.313 |
0.399 |
2.314 |
NaN |
NaN |
| elr |
winter 2018 |
0.992 |
0.143 |
0.295 |
0.396 |
1.941 |
0.490 |
1.606 |
| baseline |
winter 2019 |
1.000 |
0.000e+00 |
0.243 |
0.364 |
1.812 |
NaN |
NaN |
| elr |
winter 2019 |
1.000 |
0.111 |
0.247 |
0.370 |
1.498 |
0.464 |
1.420 |
| baseline |
all |
0.981 |
0.068 |
0.557 |
0.481 |
6.555 |
NaN |
NaN |
| elr |
all |
0.973 |
0.087 |
0.533 |
0.483 |
6.287 |
0.502 |
2.581 |
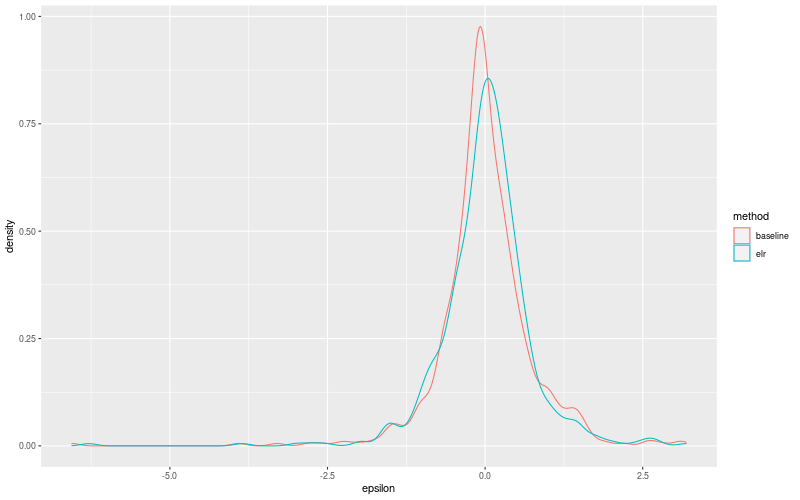
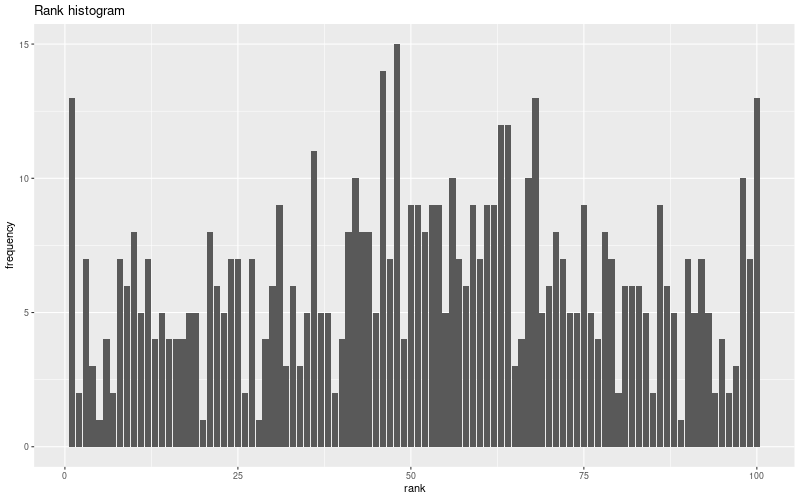
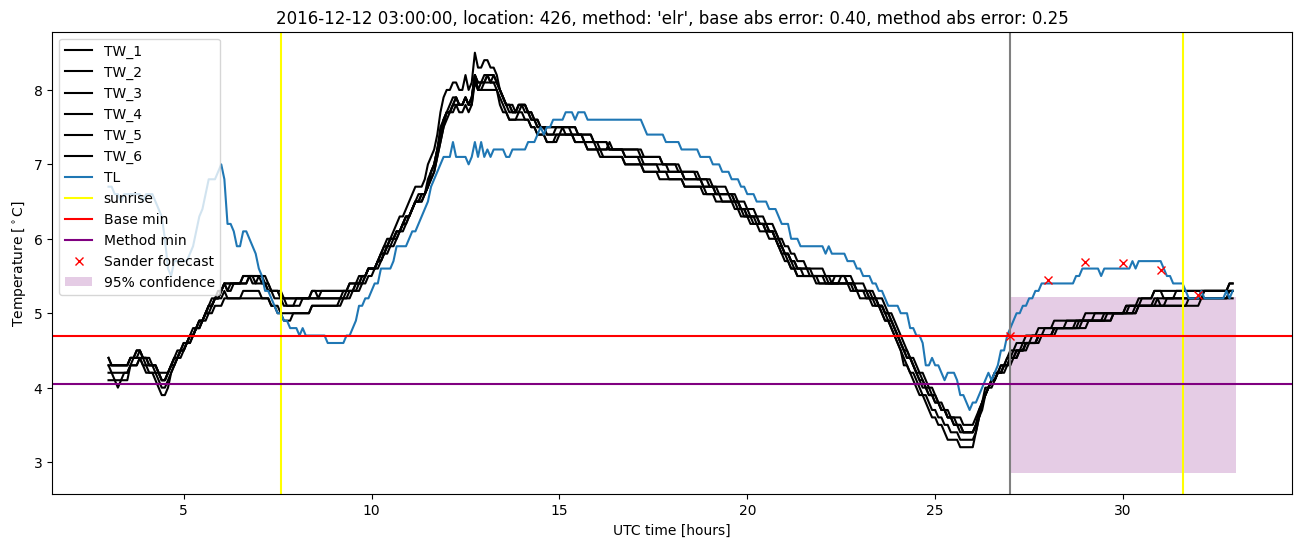
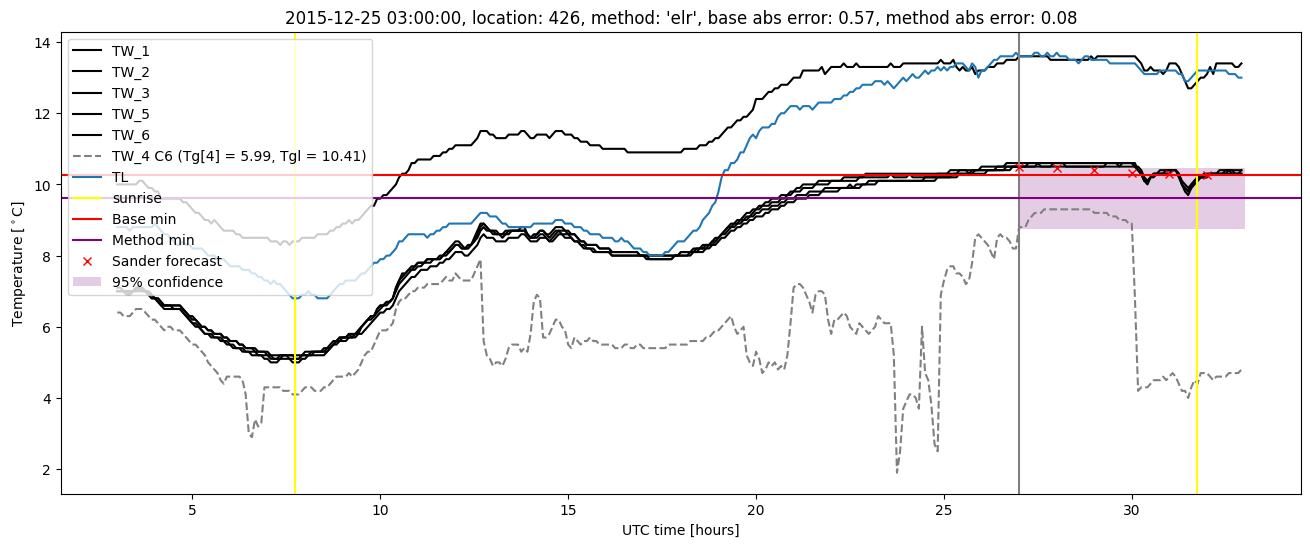
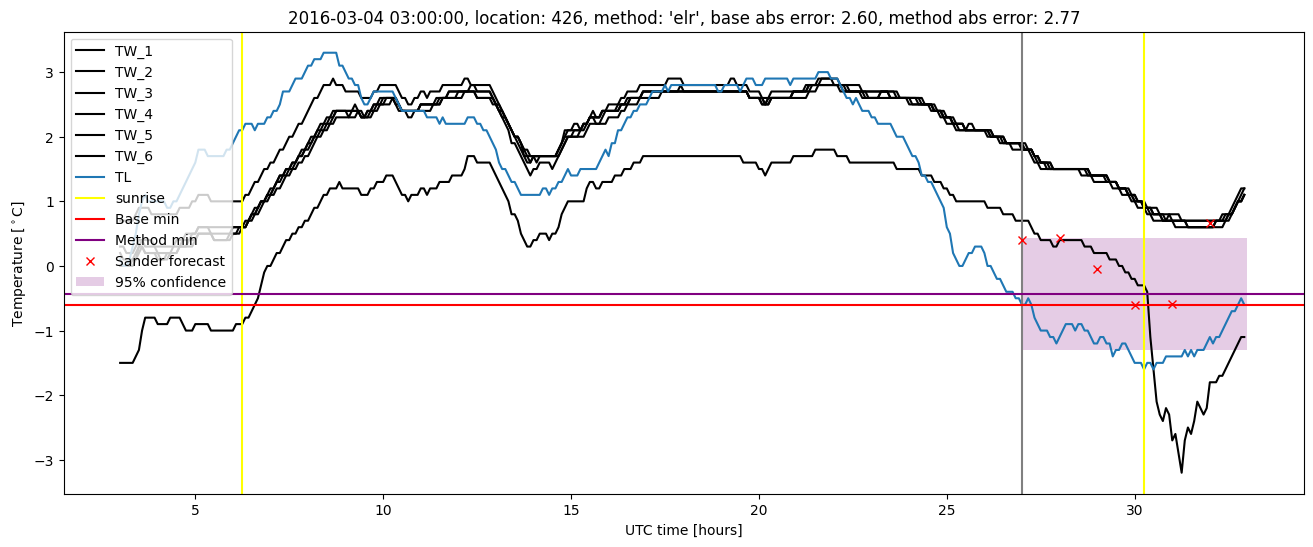
Extended logistic regression plots