GMS location: 425
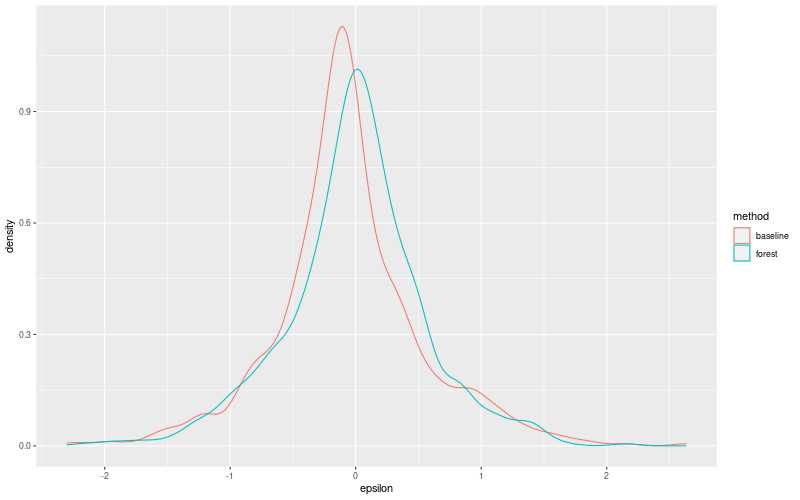
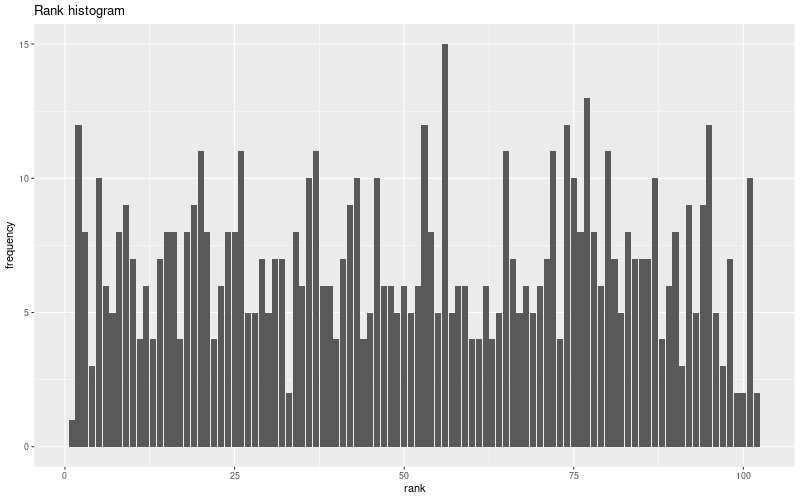
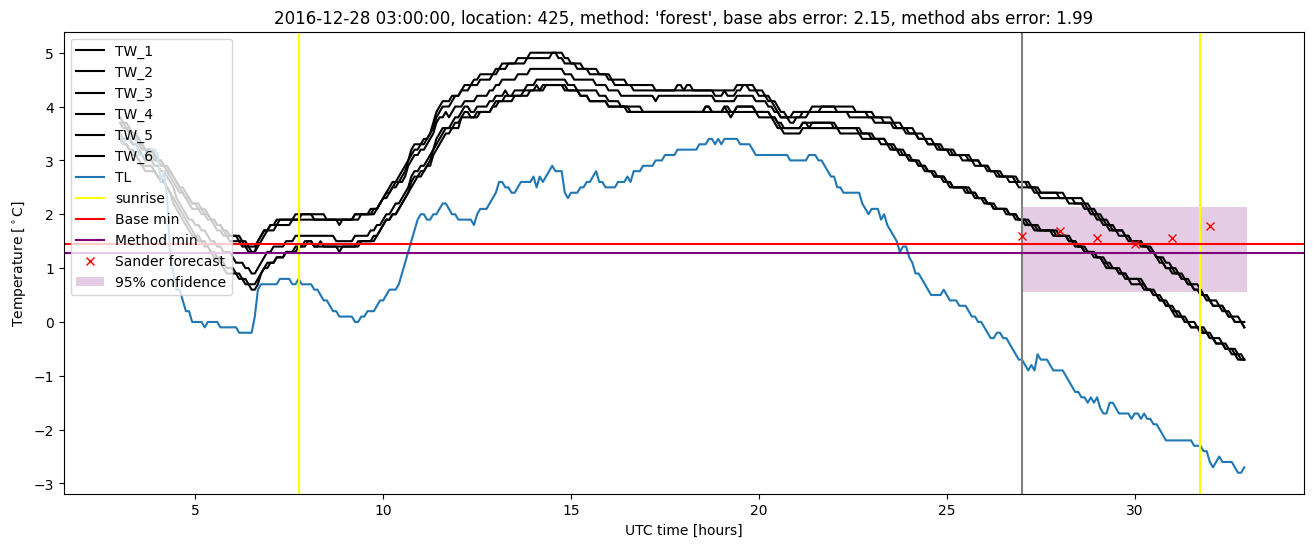
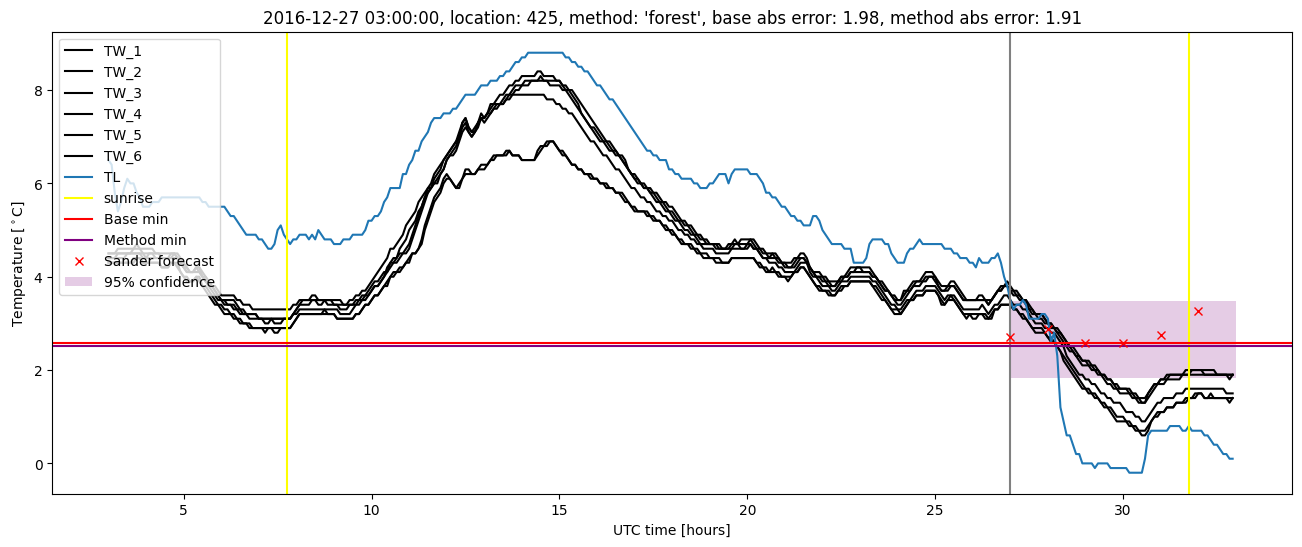
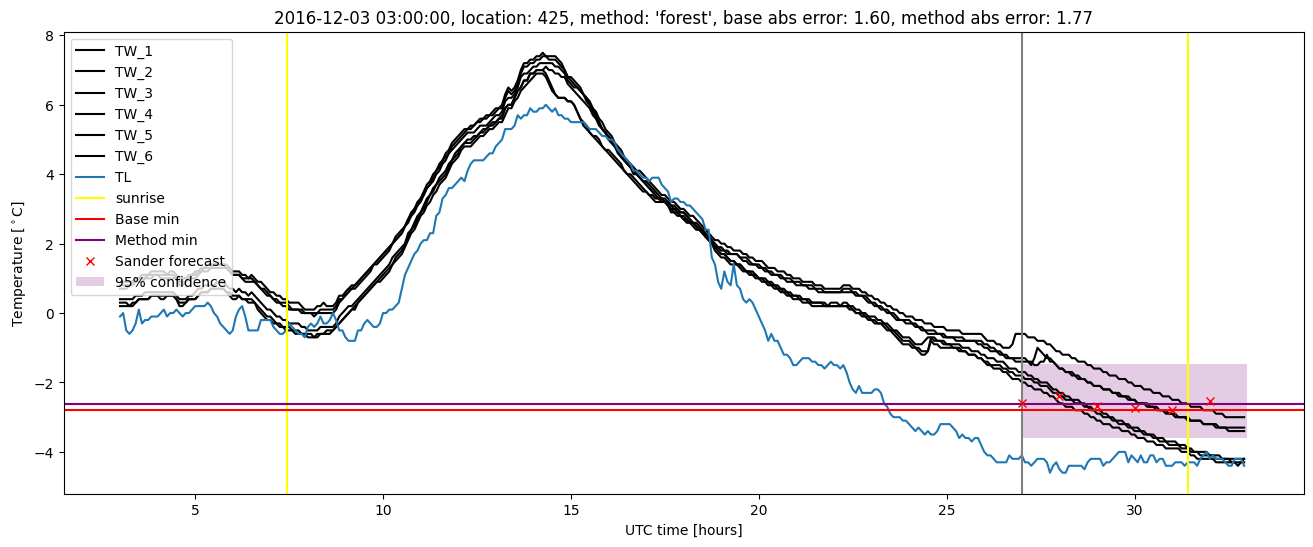
Random forest results
| names |
period |
power |
significance |
meanSquareError |
absError |
maxError |
CRPS |
IGN |
| baseline |
winter 2016 |
0.989 |
0.107 |
0.284 |
0.396 |
2.300 |
NaN |
NaN |
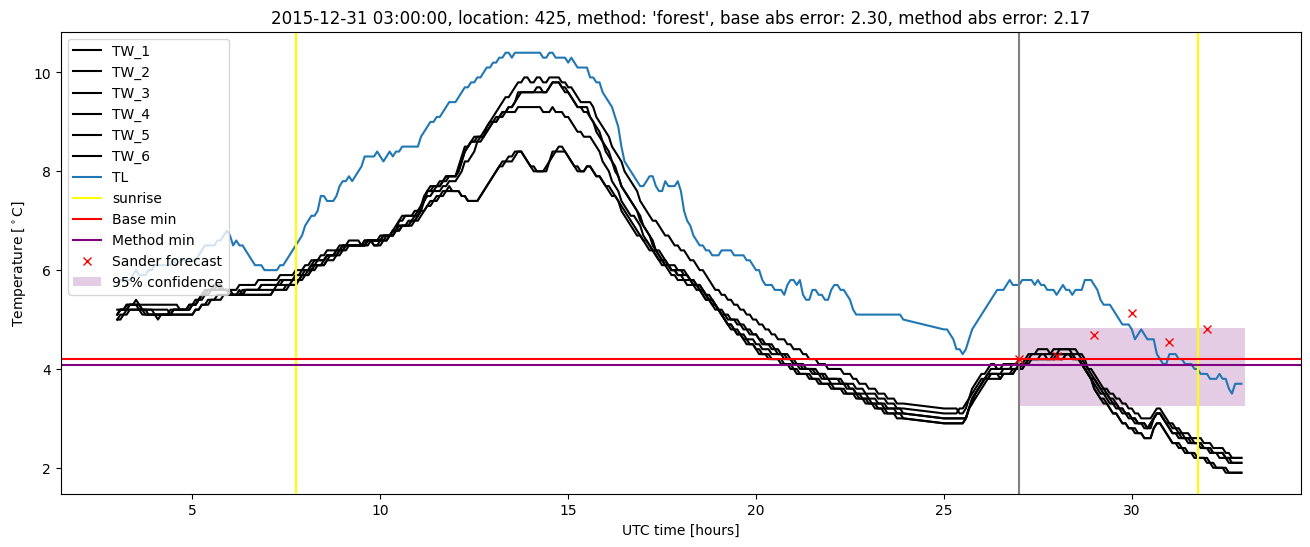
| forest |
winter 2016 |
0.966 |
0.036 |
0.276 |
0.391 |
2.173 |
0.525 |
4.121 |
| baseline |
winter 2017 |
0.991 |
0.046 |
0.448 |
0.468 |
2.151 |
NaN |
NaN |
| forest |
winter 2017 |
0.982 |
0.093 |
0.356 |
0.440 |
1.988 |
0.484 |
3.696 |
| baseline |
winter 2018 |
0.992 |
0.103 |
0.337 |
0.408 |
1.900 |
NaN |
NaN |
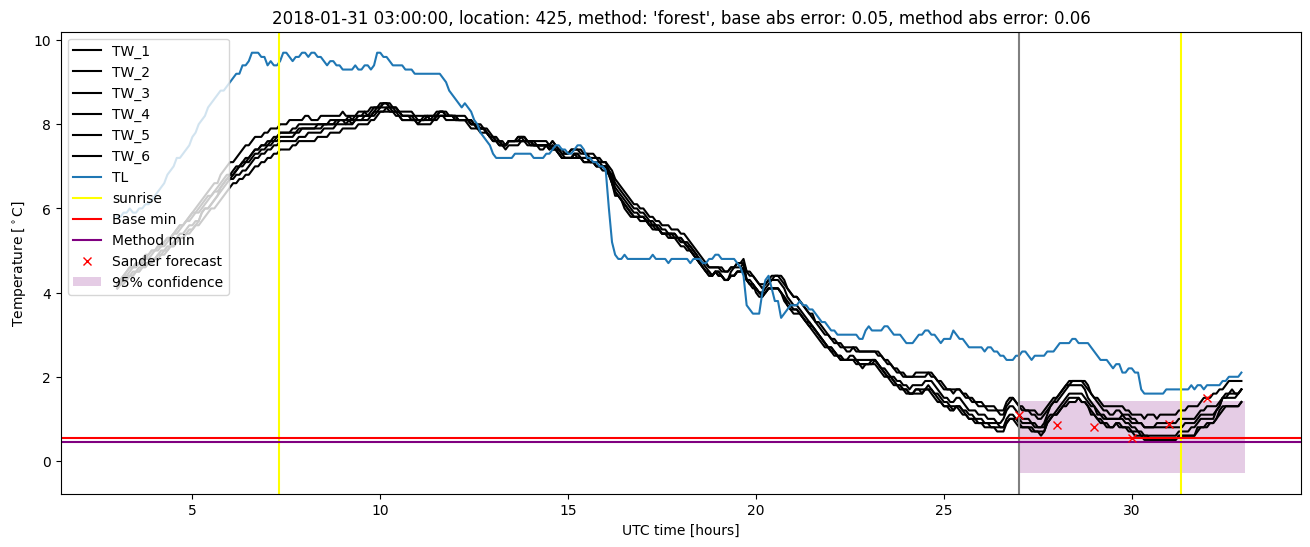
| forest |
winter 2018 |
0.992 |
0.103 |
0.315 |
0.407 |
1.713 |
0.502 |
3.163 |
| baseline |
winter 2019 |
0.981 |
0.000e+00 |
0.372 |
0.446 |
2.631 |
NaN |
NaN |
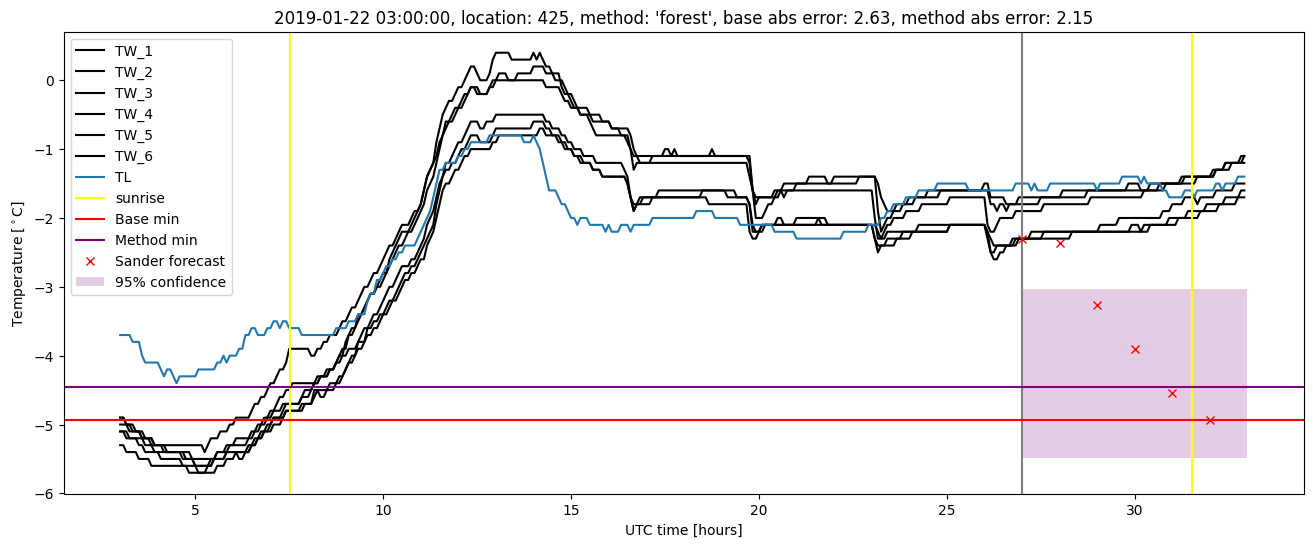
| forest |
winter 2019 |
0.981 |
0.062 |
0.302 |
0.392 |
2.151 |
0.508 |
3.172 |
| baseline |
all |
0.988 |
0.071 |
0.354 |
0.427 |
2.631 |
NaN |
NaN |
| forest |
all |
0.979 |
0.079 |
0.309 |
0.406 |
2.173 |
0.506 |
3.563 |
Random forest plots

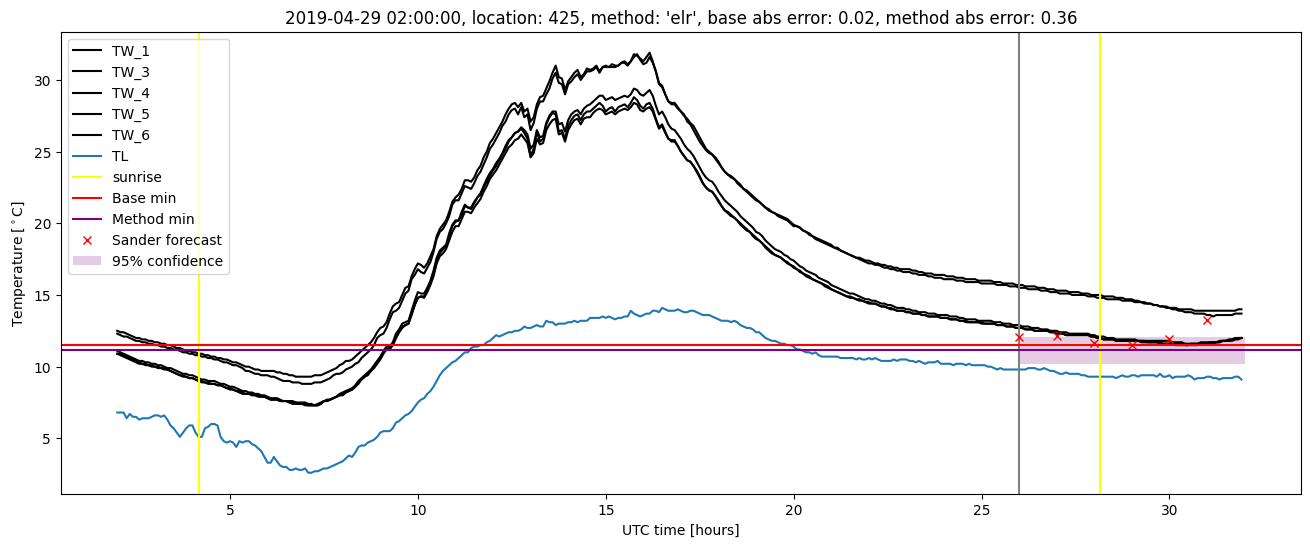
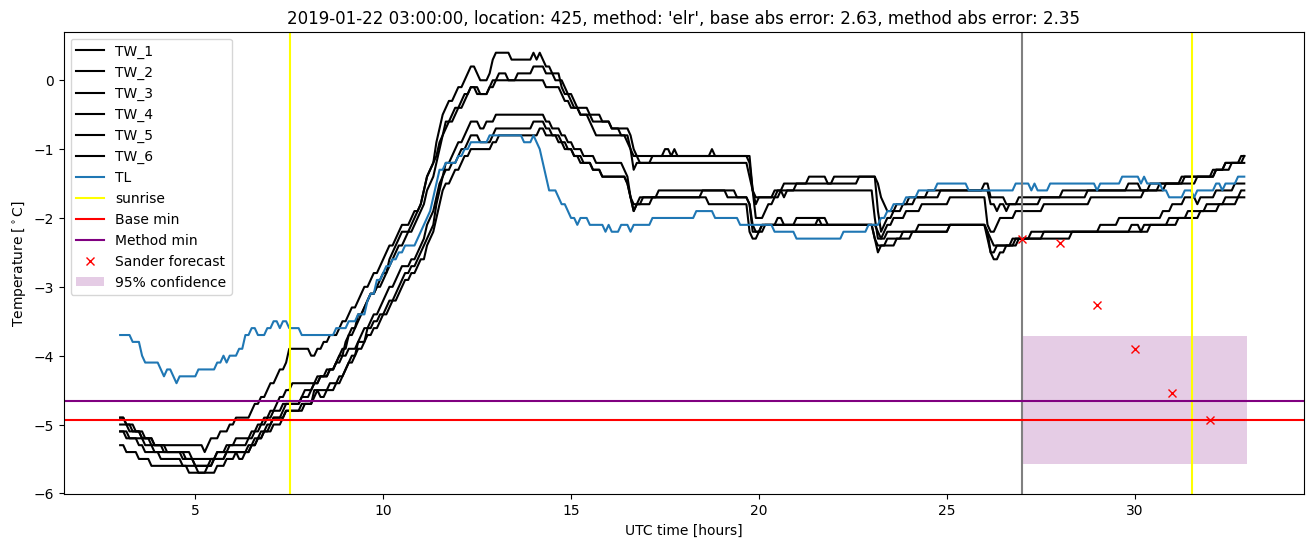
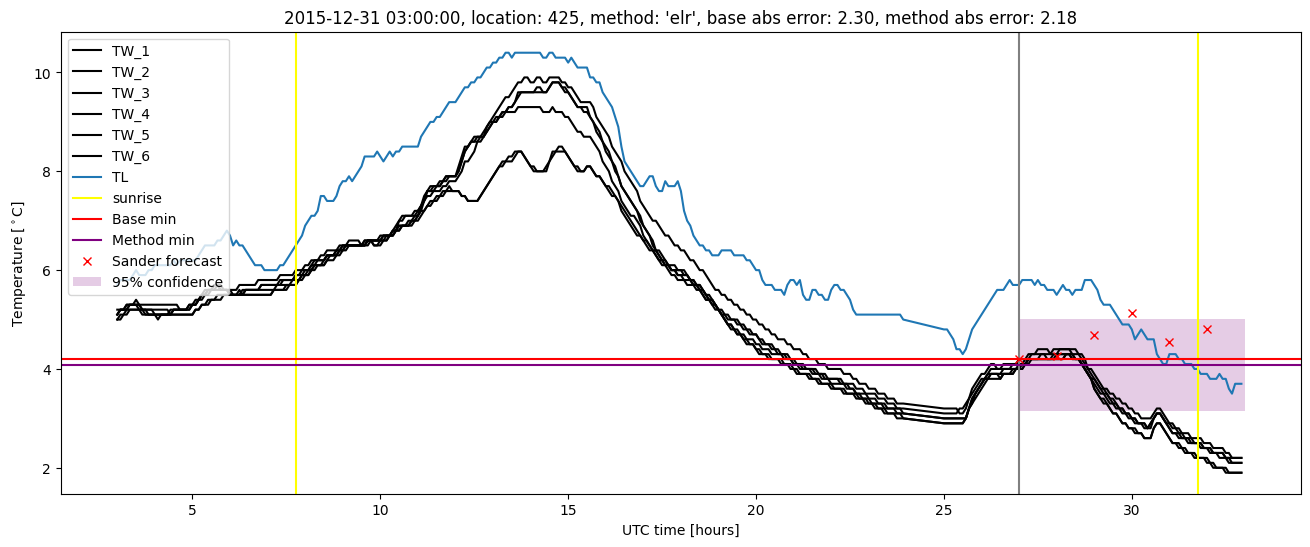
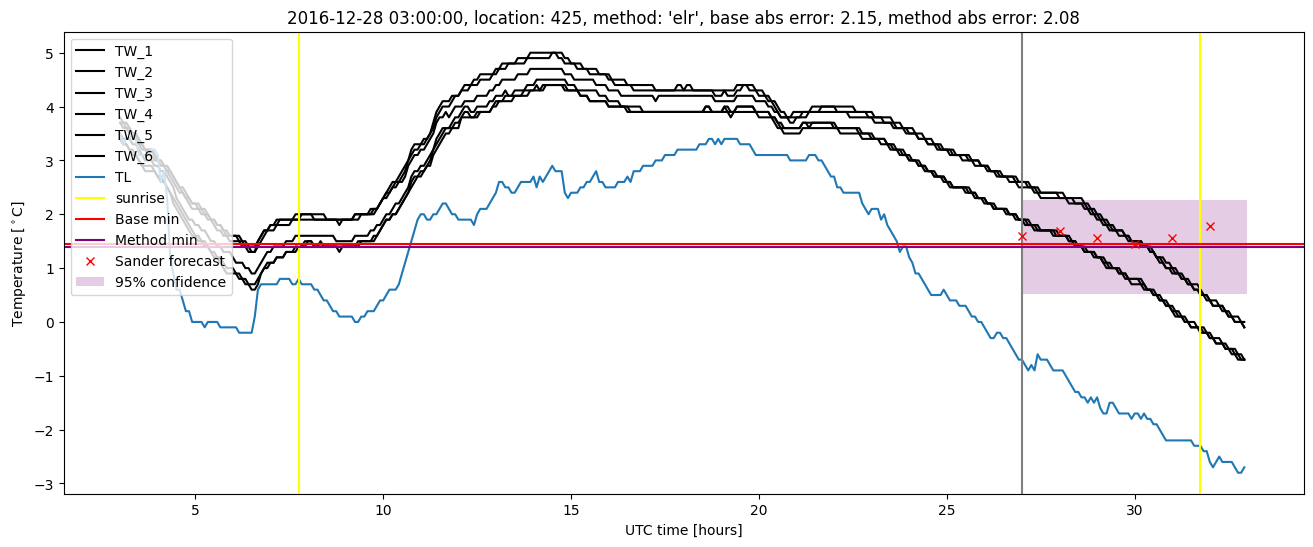
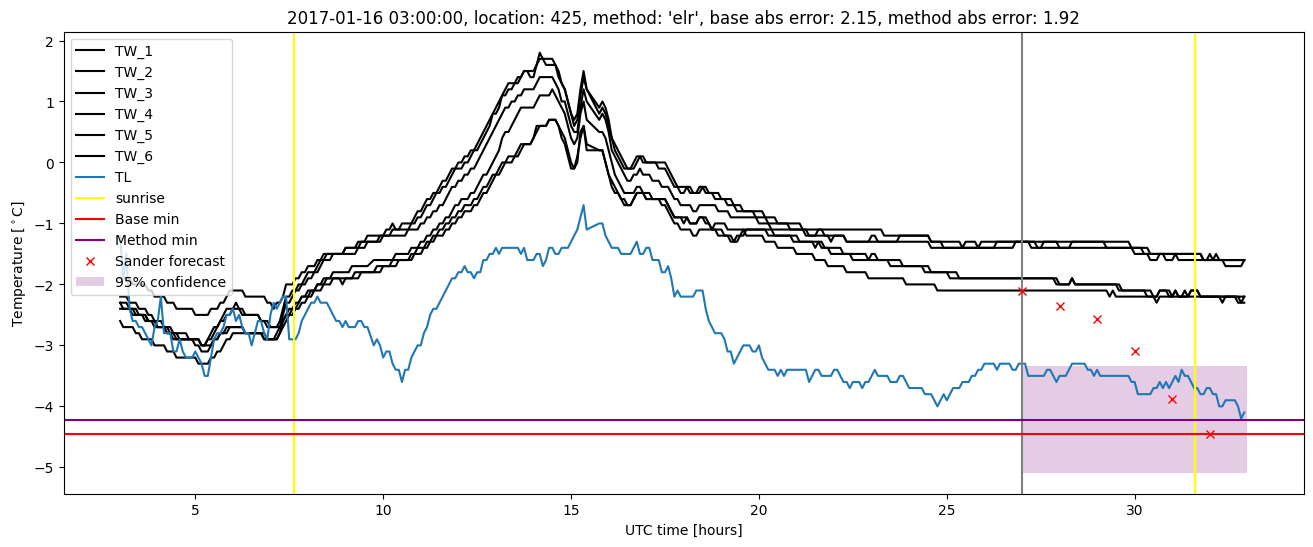
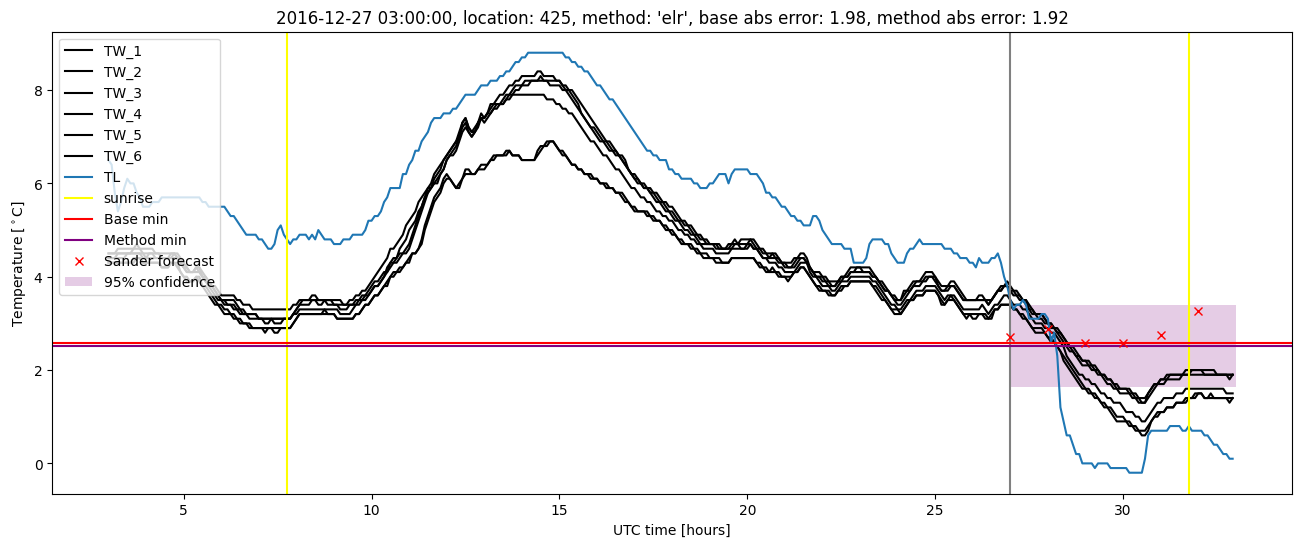
Extended logistic regression results
| names |
period |
power |
significance |
meanSquareError |
absError |
maxError |
CRPS |
IGN |
| baseline |
winter 2016 |
0.989 |
0.107 |
0.284 |
0.396 |
2.300 |
NaN |
NaN |
| elr |
winter 2016 |
0.972 |
0.000e+00 |
0.369 |
0.465 |
2.180 |
0.612 |
4.322 |
| baseline |
winter 2017 |
0.991 |
0.046 |
0.448 |
0.468 |
2.151 |
NaN |
NaN |
| elr |
winter 2017 |
0.991 |
0.070 |
0.399 |
0.457 |
2.085 |
0.532 |
4.302 |
| baseline |
winter 2018 |
0.992 |
0.103 |
0.337 |
0.408 |
1.900 |
NaN |
NaN |
| elr |
winter 2018 |
0.992 |
0.103 |
0.366 |
0.467 |
1.706 |
0.560 |
4.182 |
| baseline |
winter 2019 |
0.981 |
0.000e+00 |
0.372 |
0.446 |
2.631 |
NaN |
NaN |
| elr |
winter 2019 |
0.981 |
0.062 |
0.385 |
0.467 |
2.352 |
0.535 |
3.455 |
| baseline |
all |
0.988 |
0.071 |
0.354 |
0.427 |
2.631 |
NaN |
NaN |
| elr |
all |
0.983 |
0.064 |
0.379 |
0.464 |
2.352 |
0.563 |
4.067 |
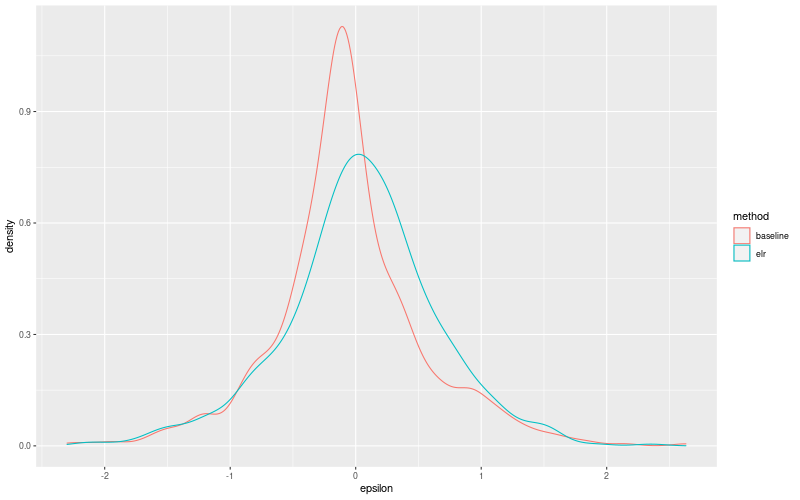
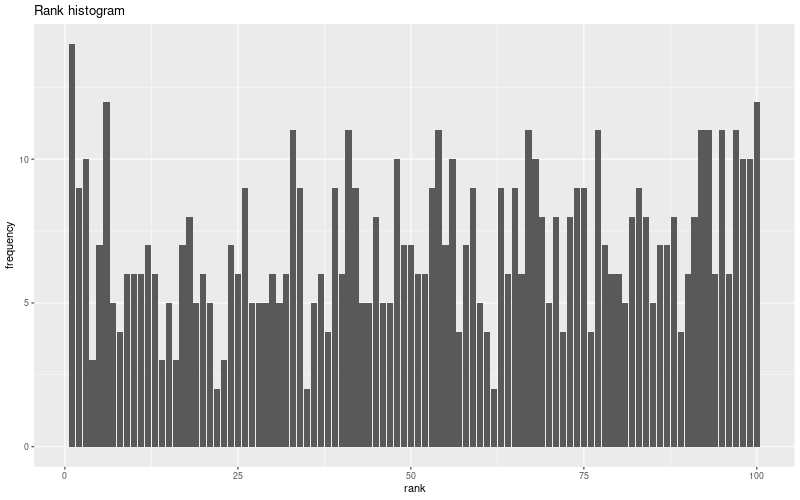
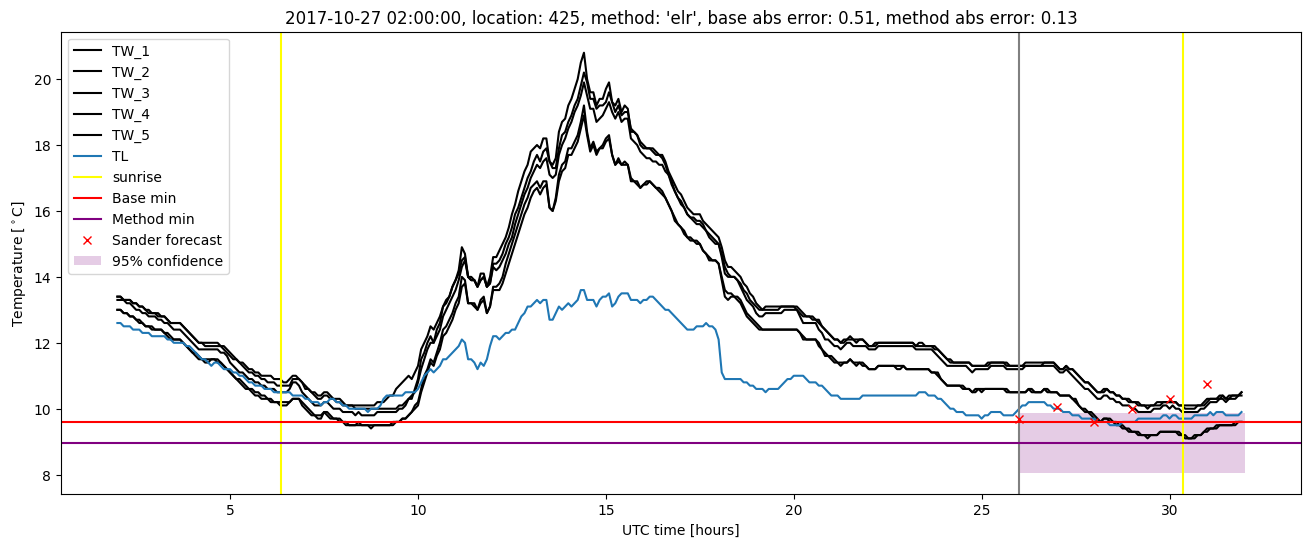
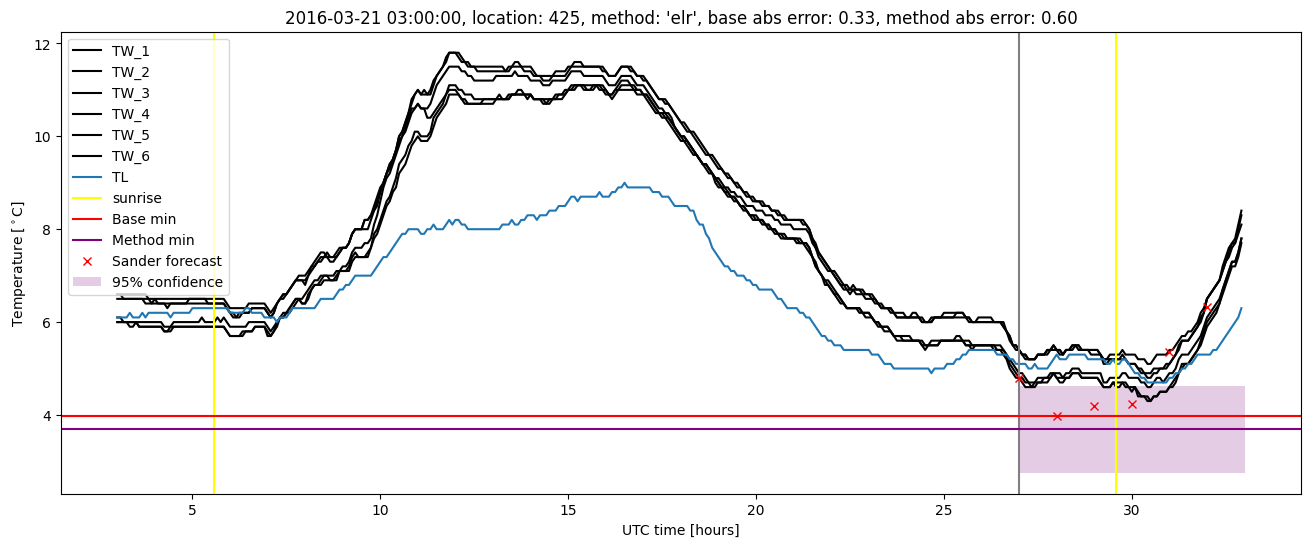
Extended logistic regression plots