GMS location: 424
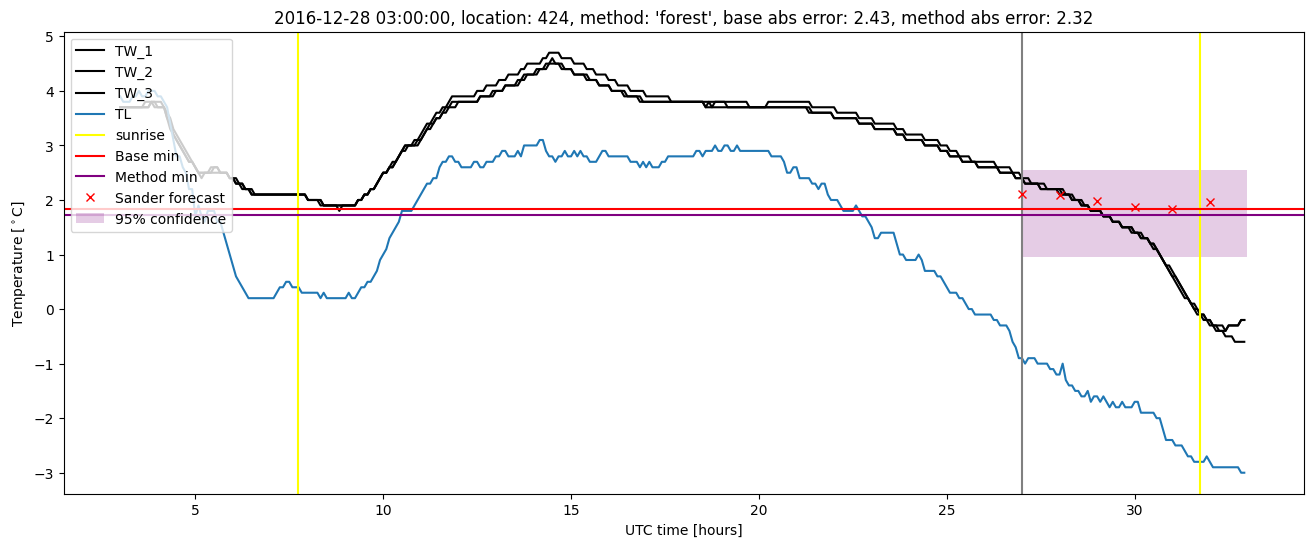
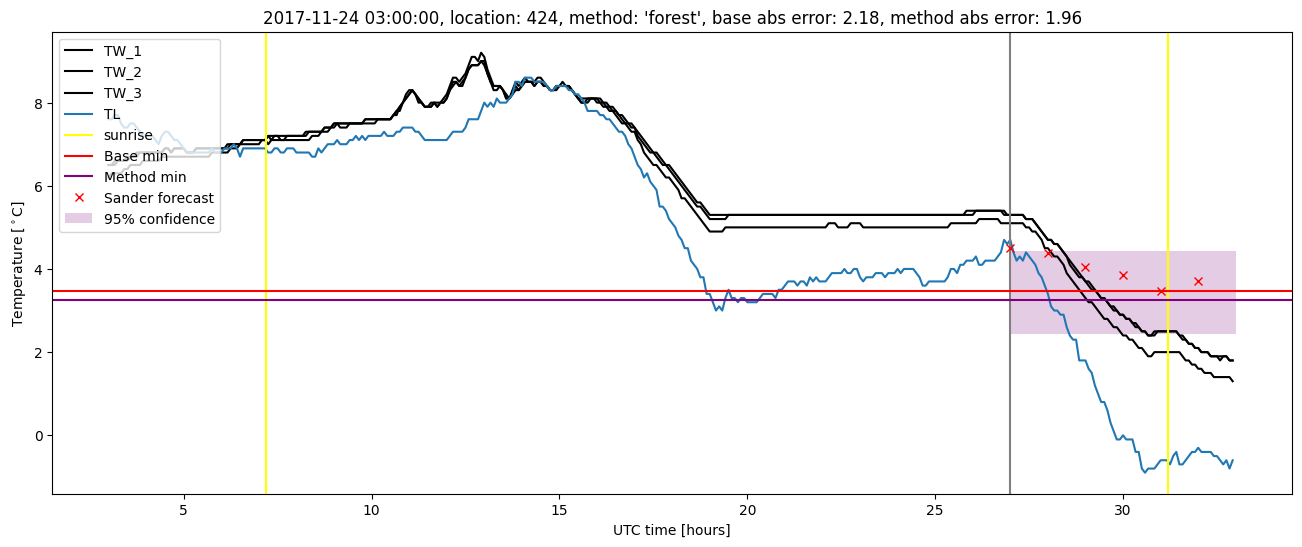
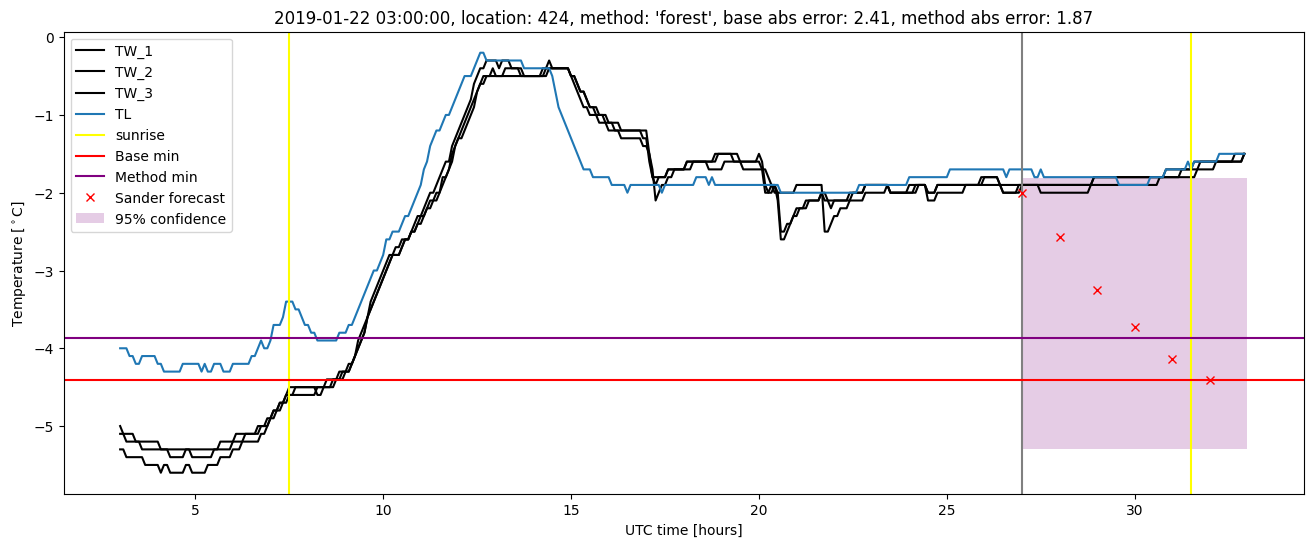
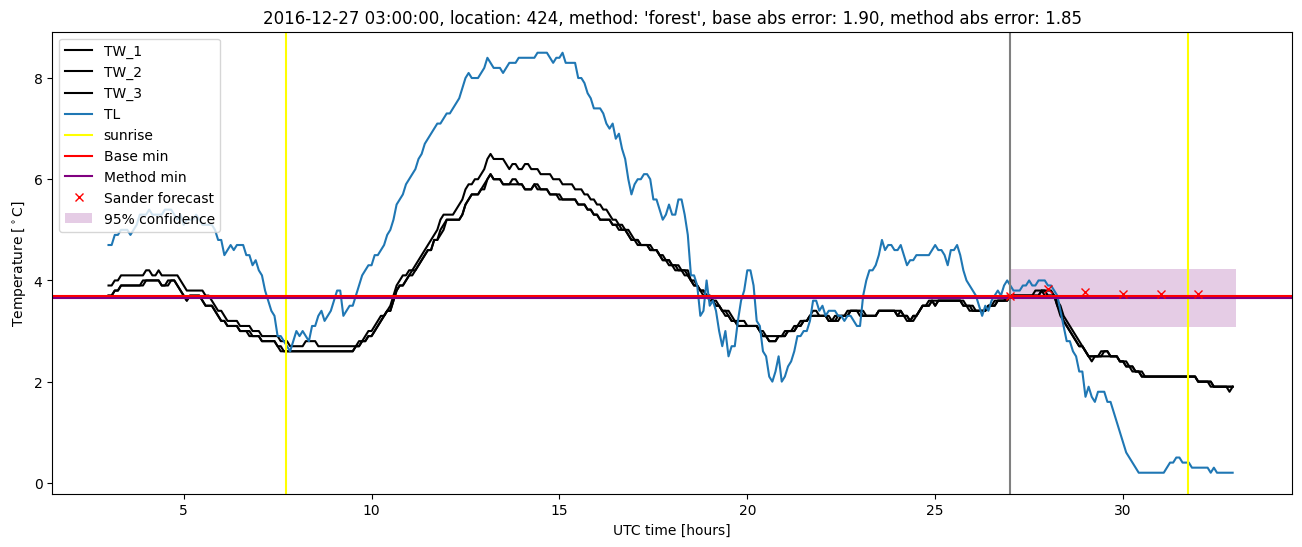
Random forest results
| names |
period |
power |
significance |
meanSquareError |
absError |
maxError |
CRPS |
IGN |
| baseline |
winter 2016 |
0.994 |
0.035 |
0.275 |
0.396 |
1.740 |
NaN |
NaN |
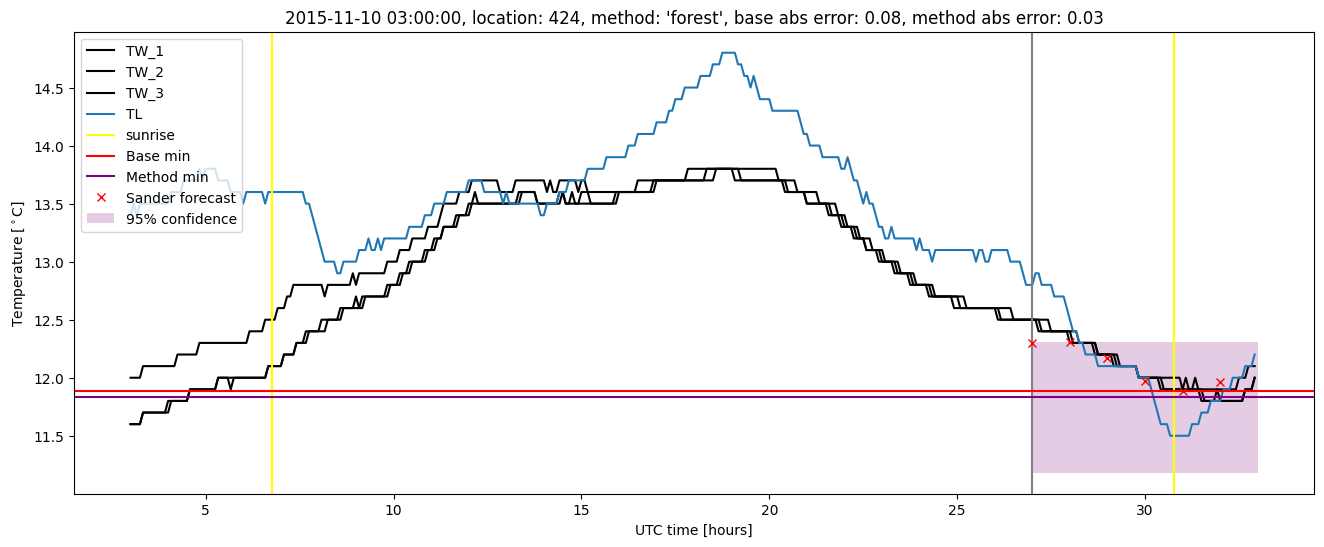
| forest |
winter 2016 |
0.989 |
0.035 |
0.243 |
0.367 |
1.707 |
0.465 |
3.686 |
| baseline |
winter 2017 |
0.982 |
0.049 |
0.434 |
0.477 |
2.433 |
NaN |
NaN |
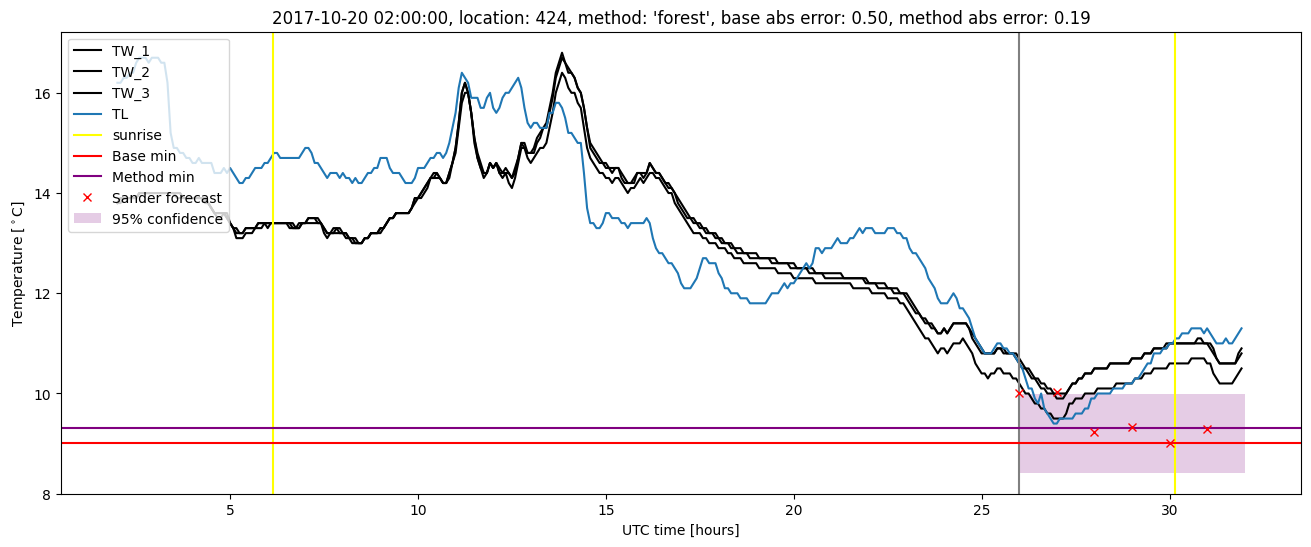
| forest |
winter 2017 |
1.000 |
0.049 |
0.317 |
0.412 |
2.324 |
0.449 |
3.838 |
| baseline |
winter 2018 |
0.970 |
0.061 |
0.409 |
0.457 |
2.604 |
NaN |
NaN |
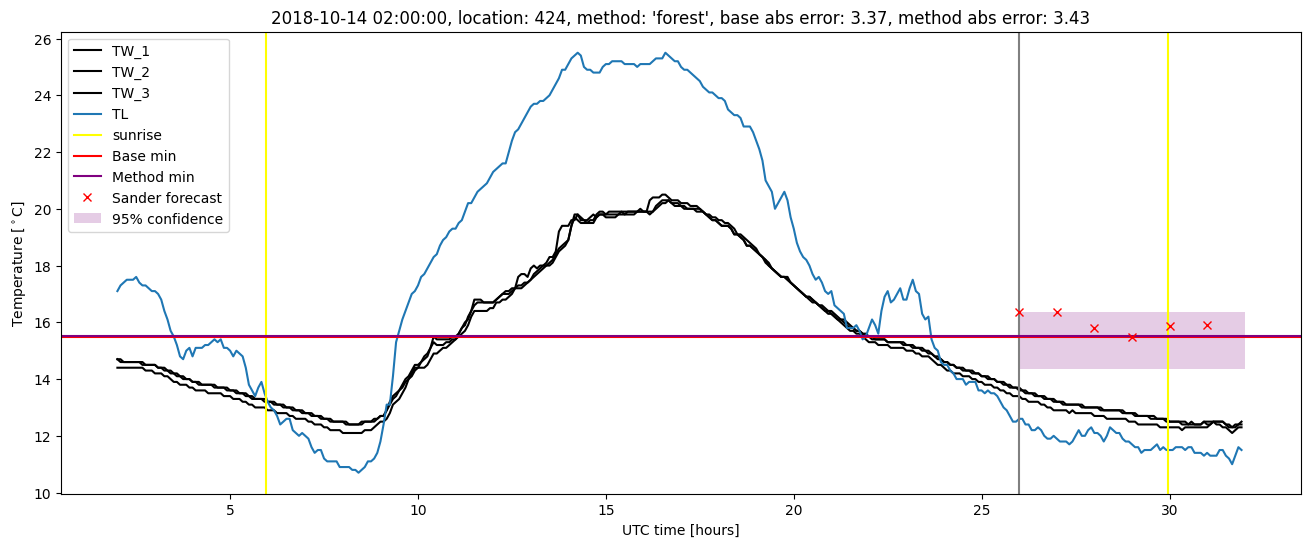
| forest |
winter 2018 |
0.977 |
0.091 |
0.300 |
0.400 |
1.957 |
0.458 |
3.521 |
| baseline |
winter 2019 |
0.962 |
0.105 |
0.434 |
0.471 |
3.371 |
NaN |
NaN |
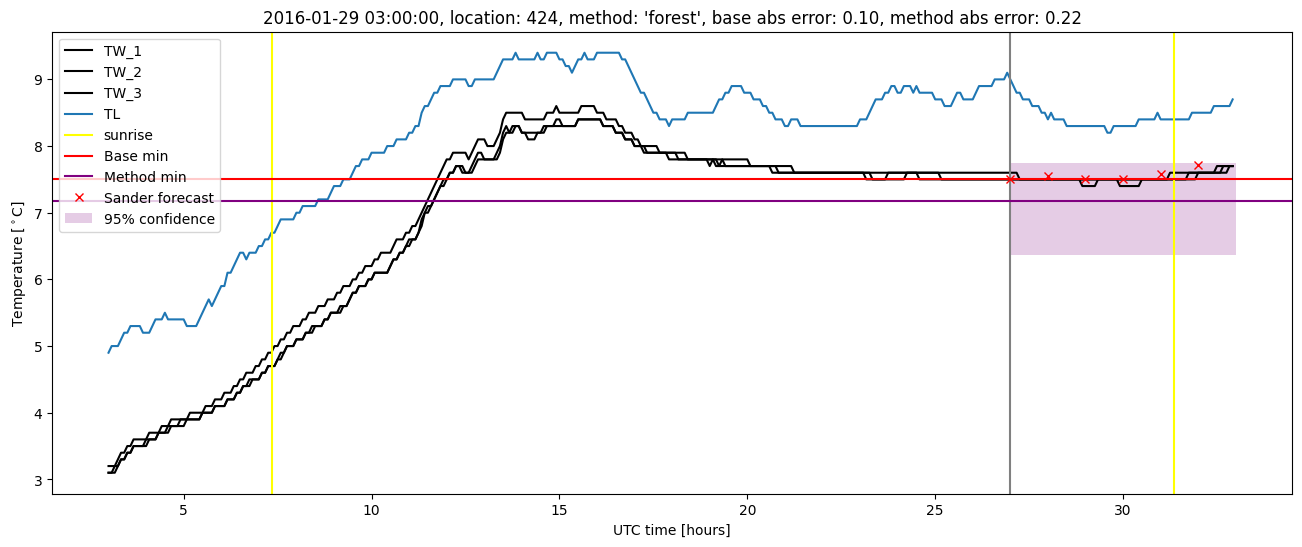
| forest |
winter 2019 |
0.993 |
0.158 |
0.310 |
0.387 |
3.428 |
0.450 |
3.662 |
| baseline |
all |
0.978 |
0.057 |
0.379 |
0.446 |
3.371 |
NaN |
NaN |
| forest |
all |
0.989 |
0.074 |
0.289 |
0.390 |
3.428 |
0.456 |
3.675 |
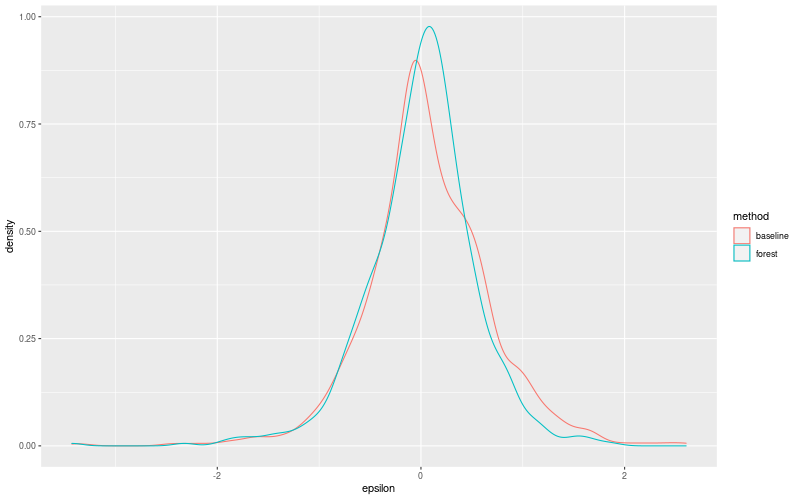
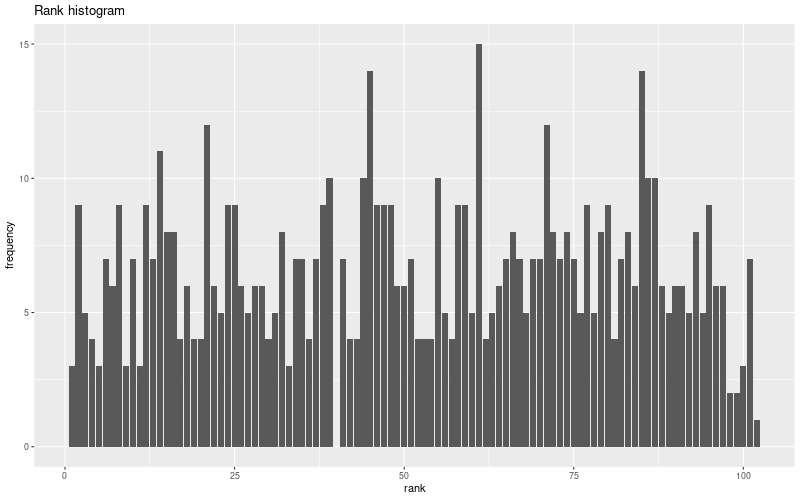
Random forest plots
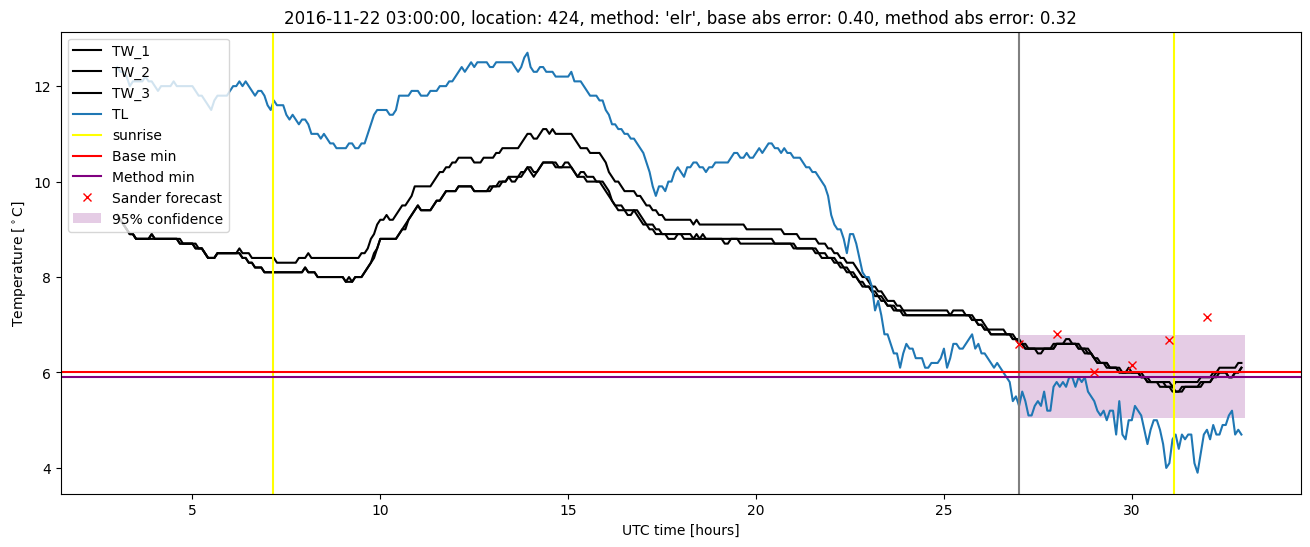
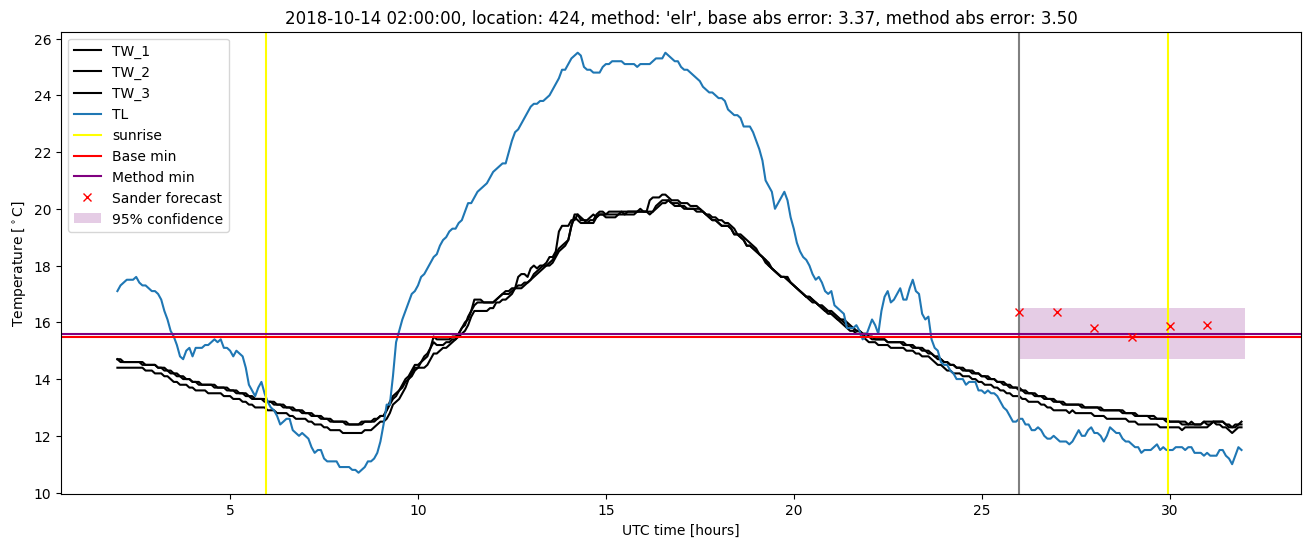
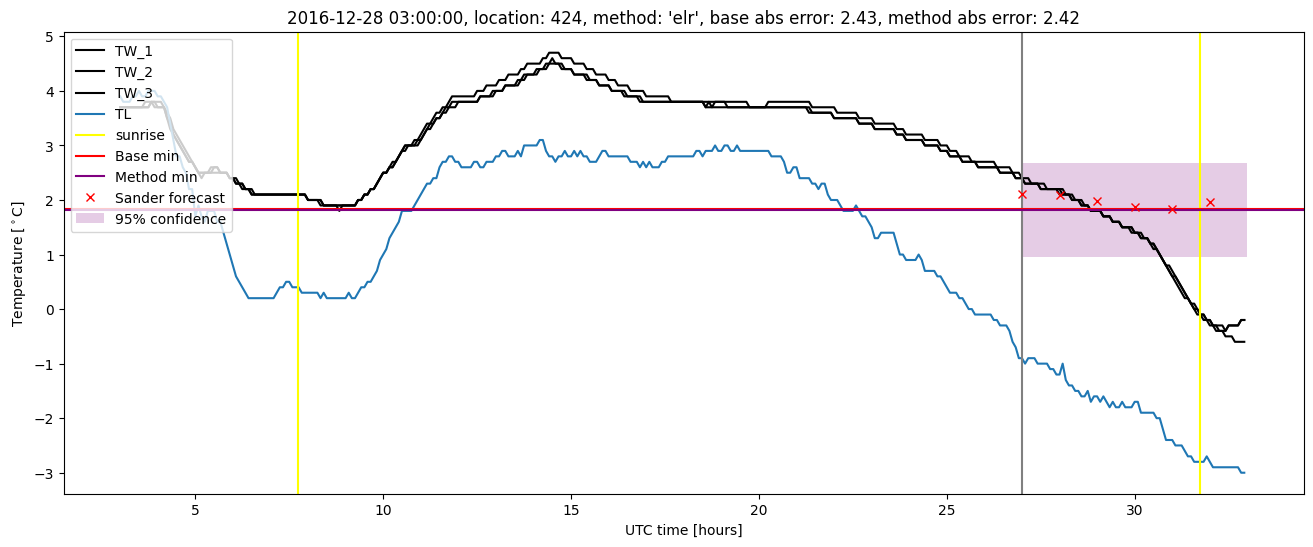
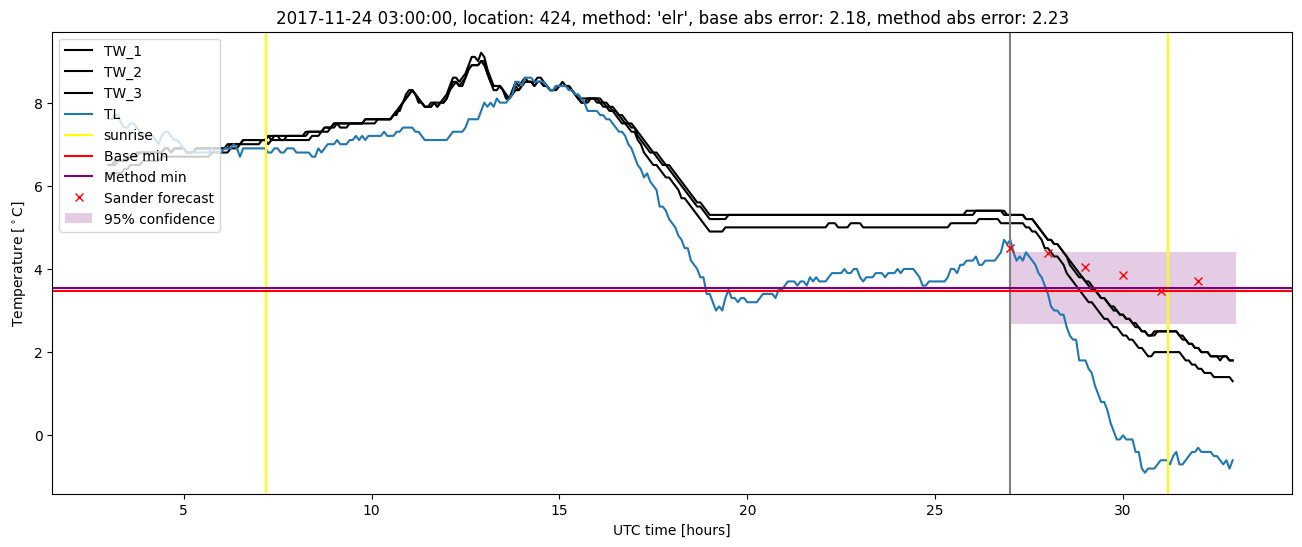
Extended logistic regression results
| names |
period |
power |
significance |
meanSquareError |
absError |
maxError |
CRPS |
IGN |
| baseline |
winter 2016 |
0.994 |
0.035 |
0.275 |
0.396 |
1.740 |
NaN |
NaN |
| elr |
winter 2016 |
0.972 |
0.035 |
0.254 |
0.390 |
1.802 |
0.519 |
3.395 |
| baseline |
winter 2017 |
0.982 |
0.049 |
0.434 |
0.477 |
2.433 |
NaN |
NaN |
| elr |
winter 2017 |
0.982 |
0.049 |
0.362 |
0.440 |
2.417 |
0.479 |
3.555 |
| baseline |
winter 2018 |
0.970 |
0.061 |
0.409 |
0.457 |
2.604 |
NaN |
NaN |
| elr |
winter 2018 |
0.977 |
0.091 |
0.341 |
0.433 |
2.232 |
0.522 |
4.241 |
| baseline |
winter 2019 |
0.962 |
0.105 |
0.434 |
0.471 |
3.371 |
NaN |
NaN |
| elr |
winter 2019 |
0.985 |
0.053 |
0.367 |
0.441 |
3.498 |
0.483 |
3.286 |
| baseline |
all |
0.978 |
0.057 |
0.379 |
0.446 |
3.371 |
NaN |
NaN |
| elr |
all |
0.978 |
0.057 |
0.325 |
0.423 |
3.498 |
0.503 |
3.613 |
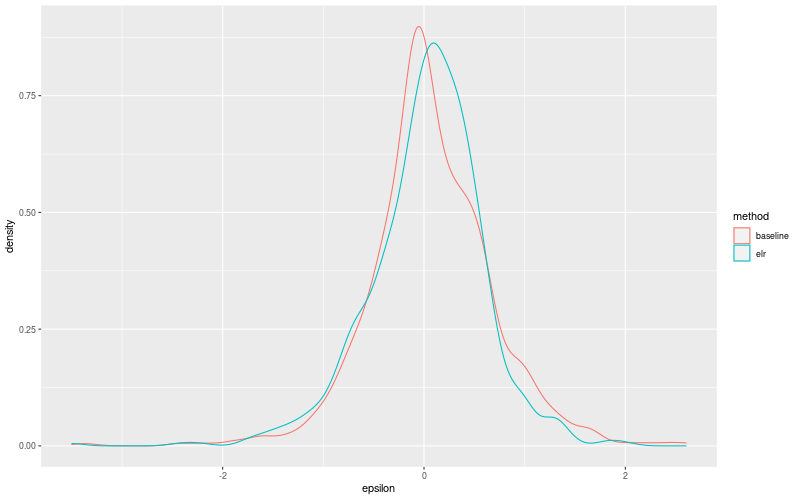
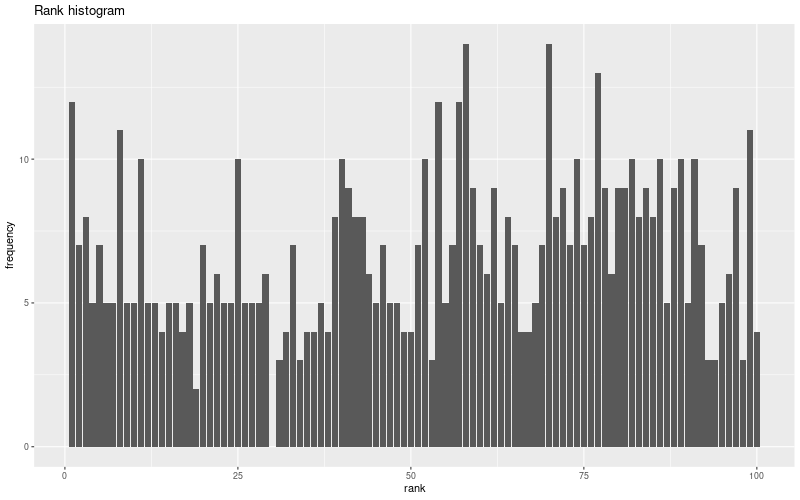
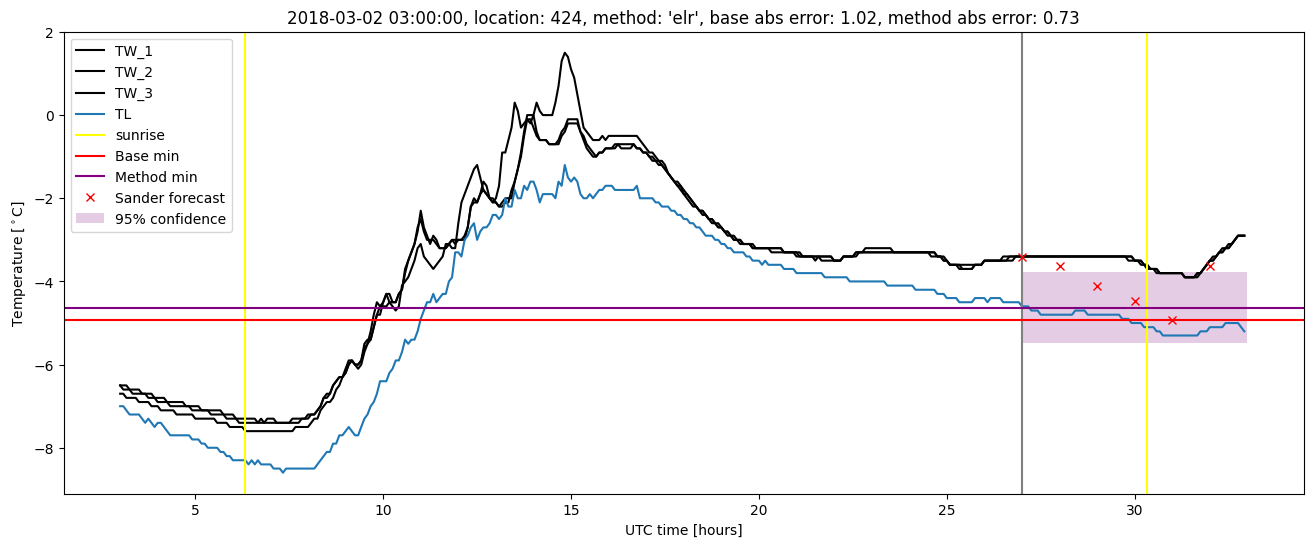
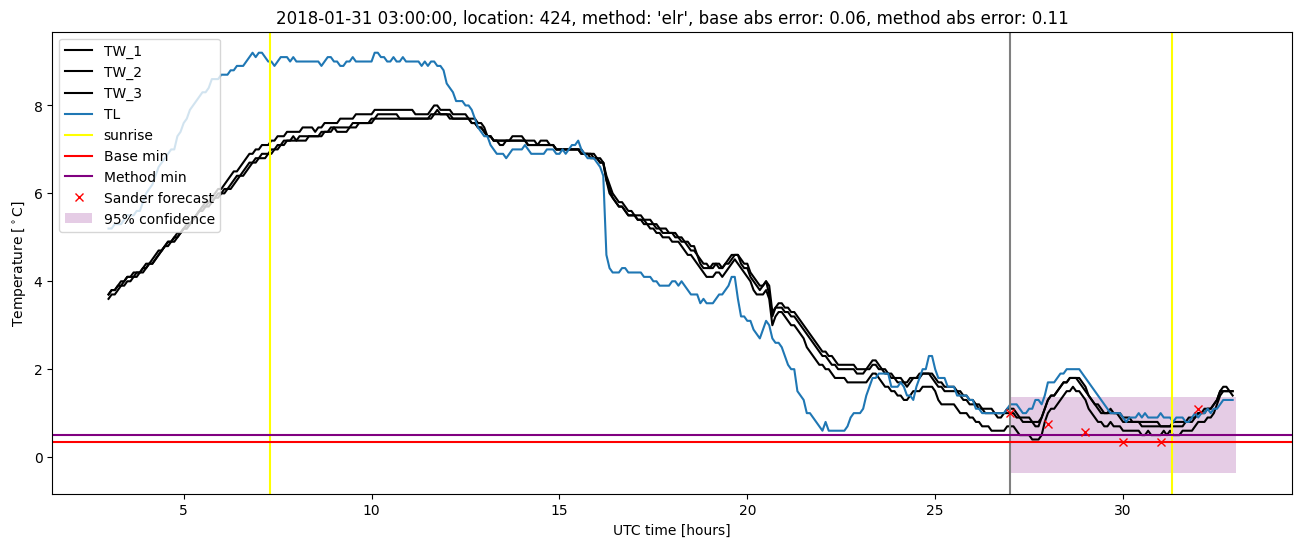
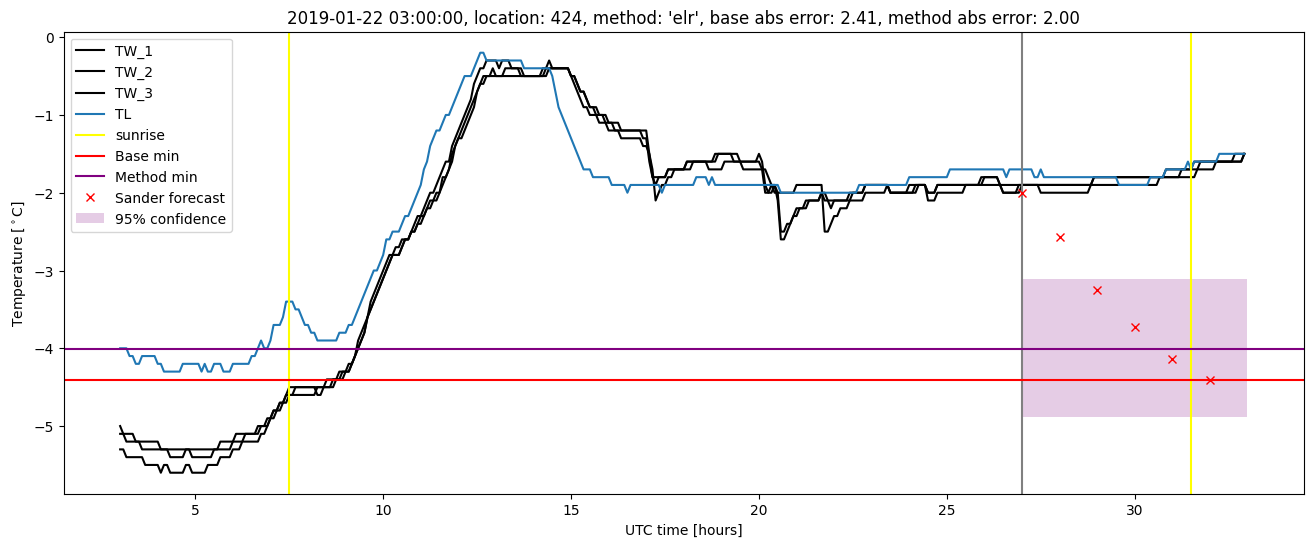
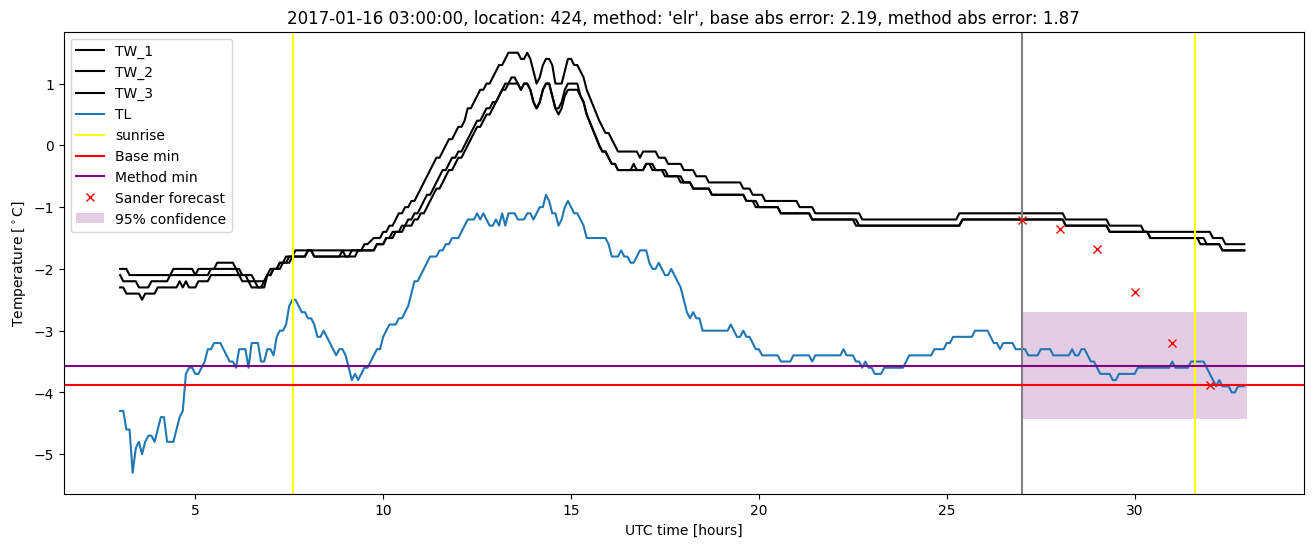
Extended logistic regression plots