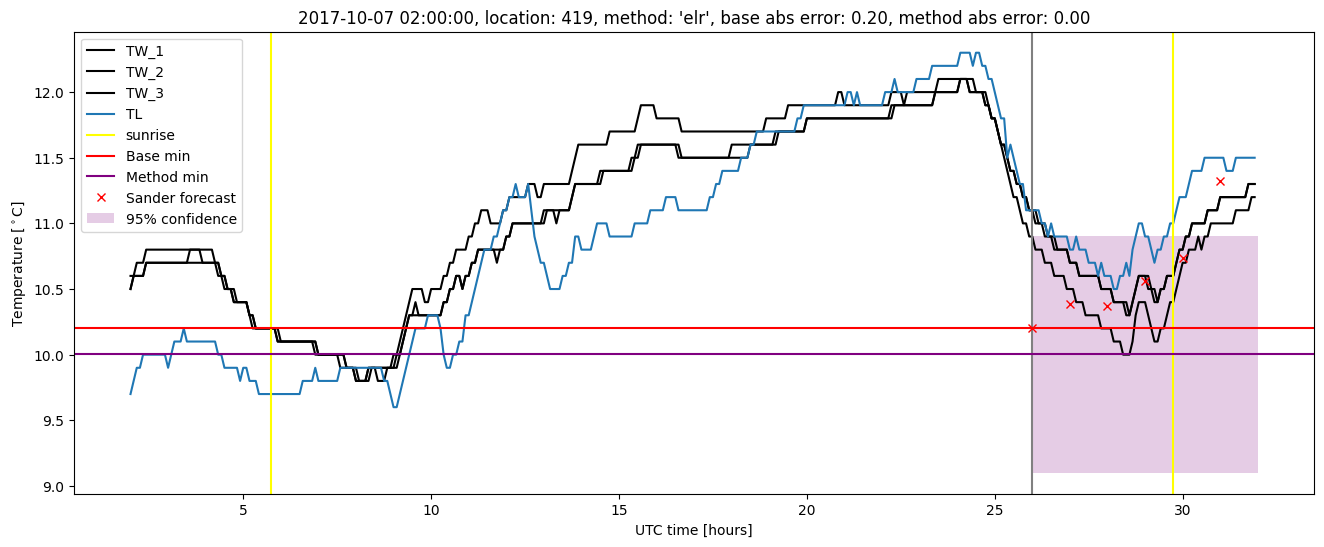
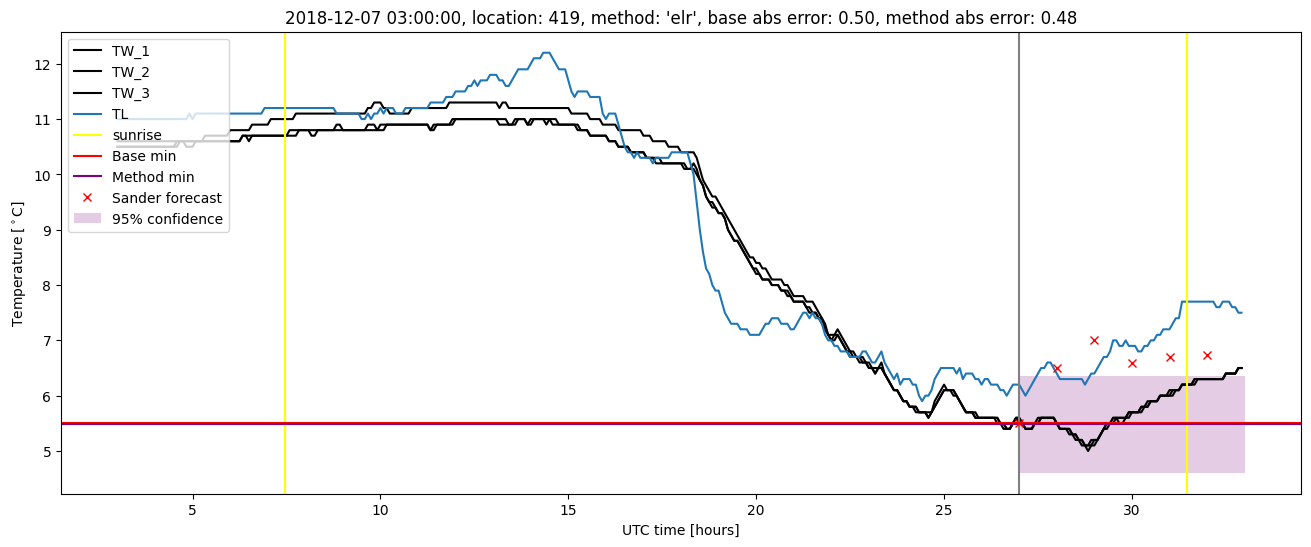
GMS location: 419
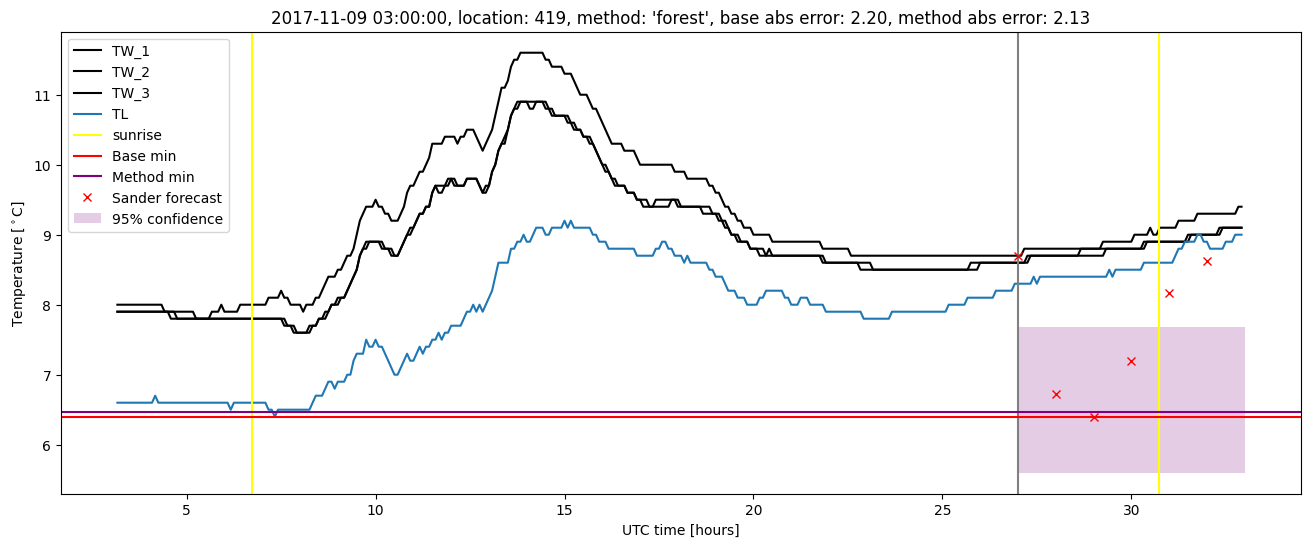
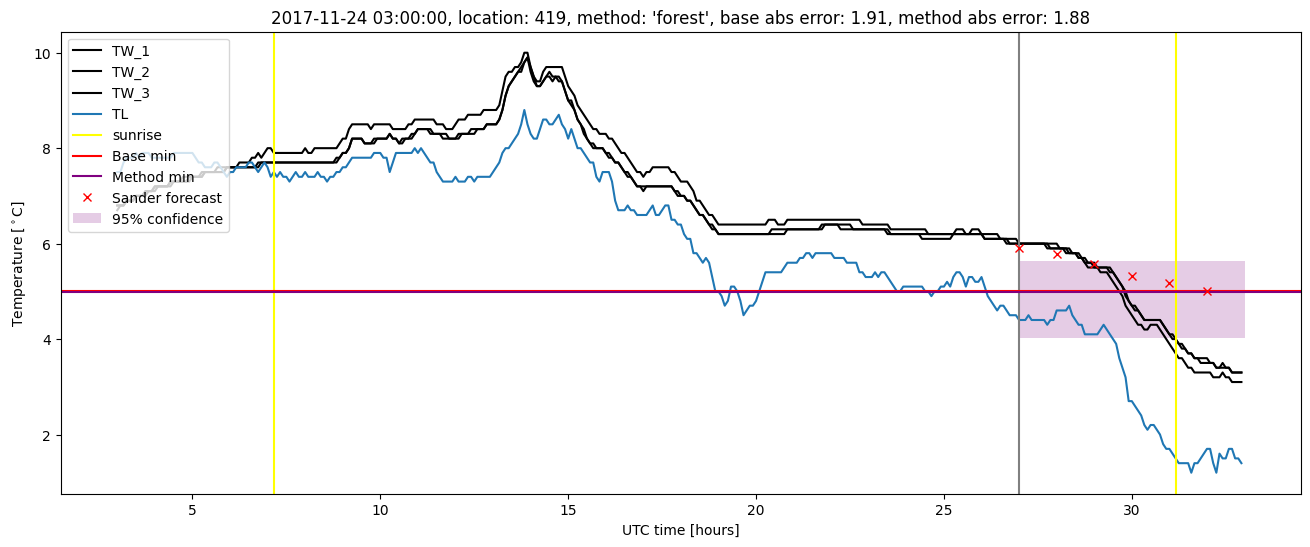
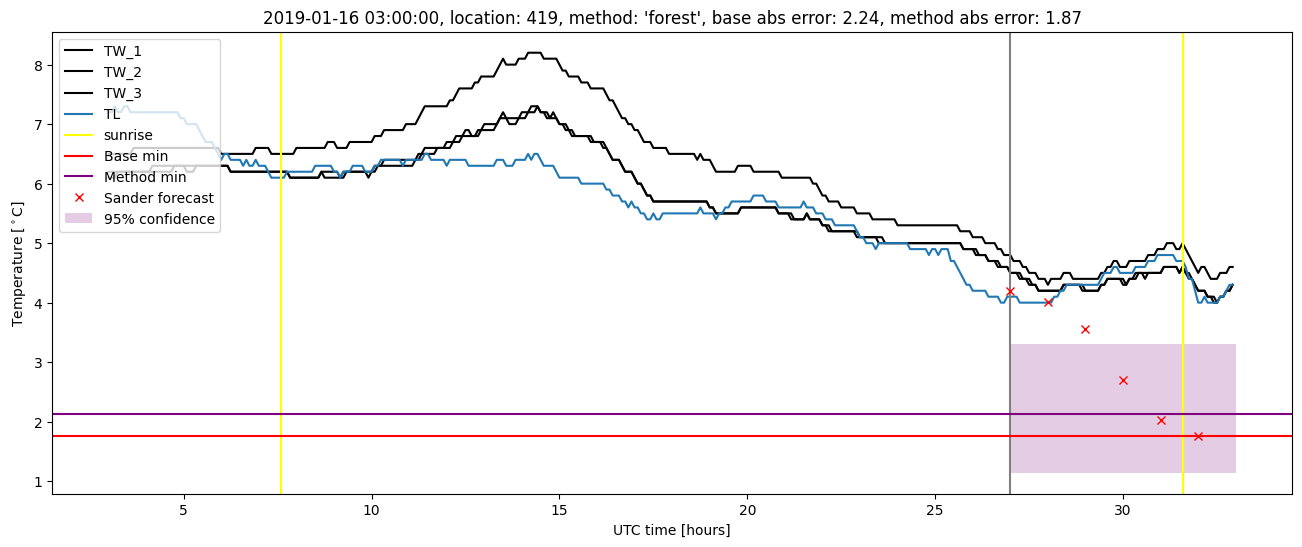
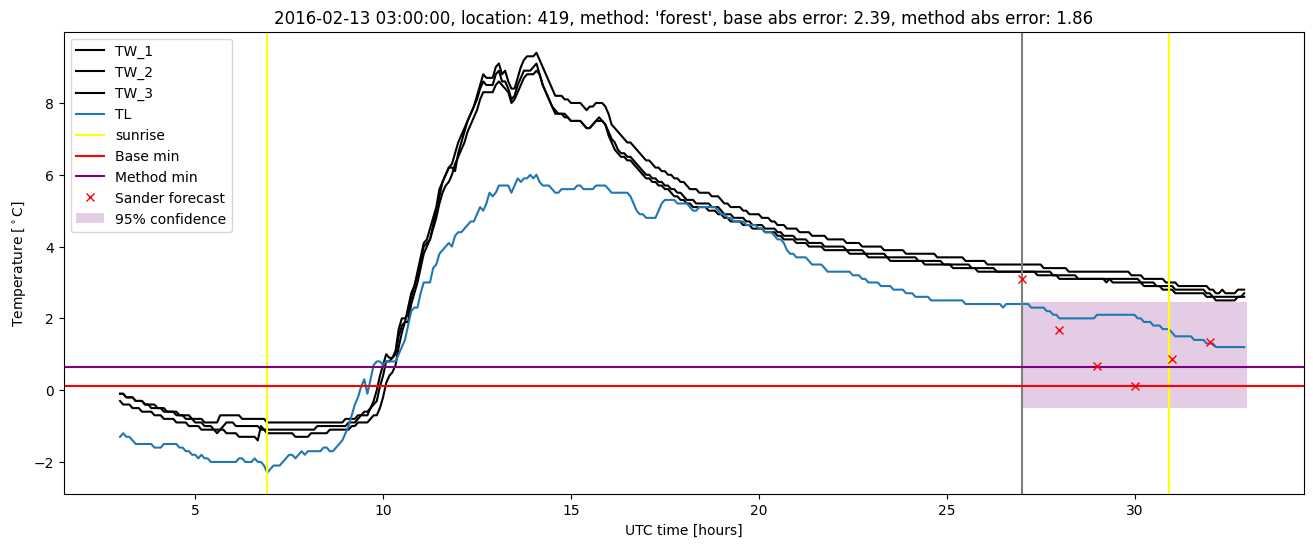
Random forest results
| names |
period |
power |
significance |
meanSquareError |
absError |
maxError |
CRPS |
IGN |
| baseline |
winter 2016 |
0.976 |
0.000e+00 |
0.295 |
0.396 |
2.390 |
NaN |
NaN |
| forest |
winter 2016 |
0.982 |
0.050 |
0.237 |
0.358 |
1.859 |
0.444 |
3.565 |
| baseline |
winter 2017 |
0.953 |
0.025 |
0.471 |
0.497 |
2.793 |
NaN |
NaN |
| forest |
winter 2017 |
0.963 |
0.025 |
0.310 |
0.418 |
1.704 |
0.445 |
2.984 |
| baseline |
winter 2018 |
0.991 |
0.040 |
0.354 |
0.403 |
2.359 |
NaN |
NaN |
| forest |
winter 2018 |
0.983 |
0.040 |
0.291 |
0.373 |
2.298 |
0.460 |
4.411 |
| baseline |
winter 2019 |
0.985 |
0.000e+00 |
0.376 |
0.417 |
2.571 |
NaN |
NaN |
| forest |
winter 2019 |
0.985 |
0.000e+00 |
0.280 |
0.393 |
1.875 |
0.441 |
2.665 |
| baseline |
all |
0.977 |
0.020 |
0.369 |
0.426 |
2.793 |
NaN |
NaN |
| forest |
all |
0.979 |
0.030 |
0.277 |
0.384 |
2.298 |
0.447 |
3.404 |
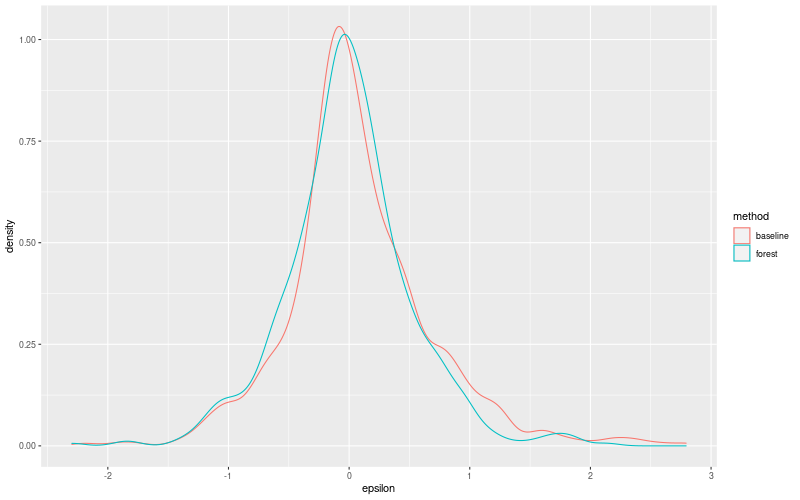
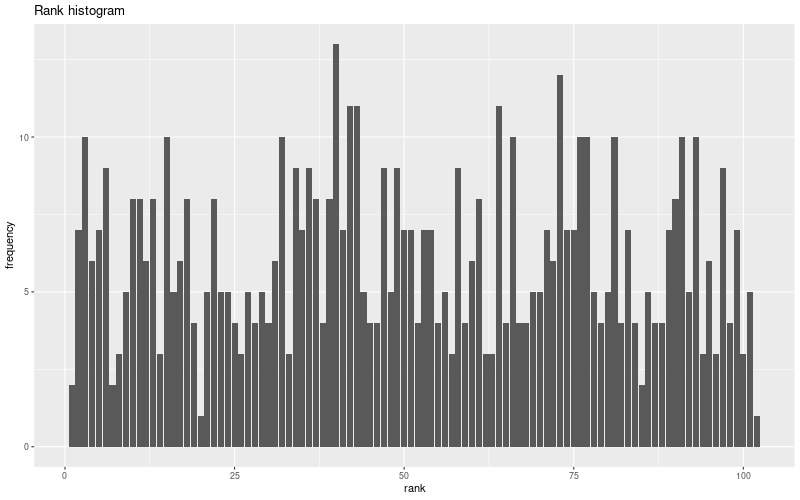
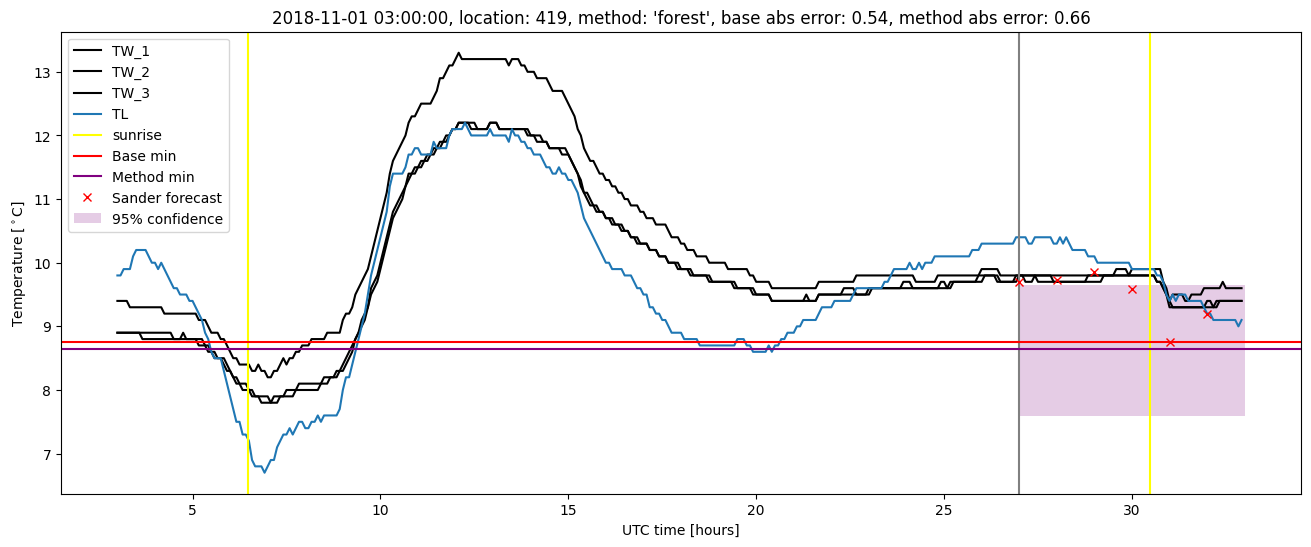
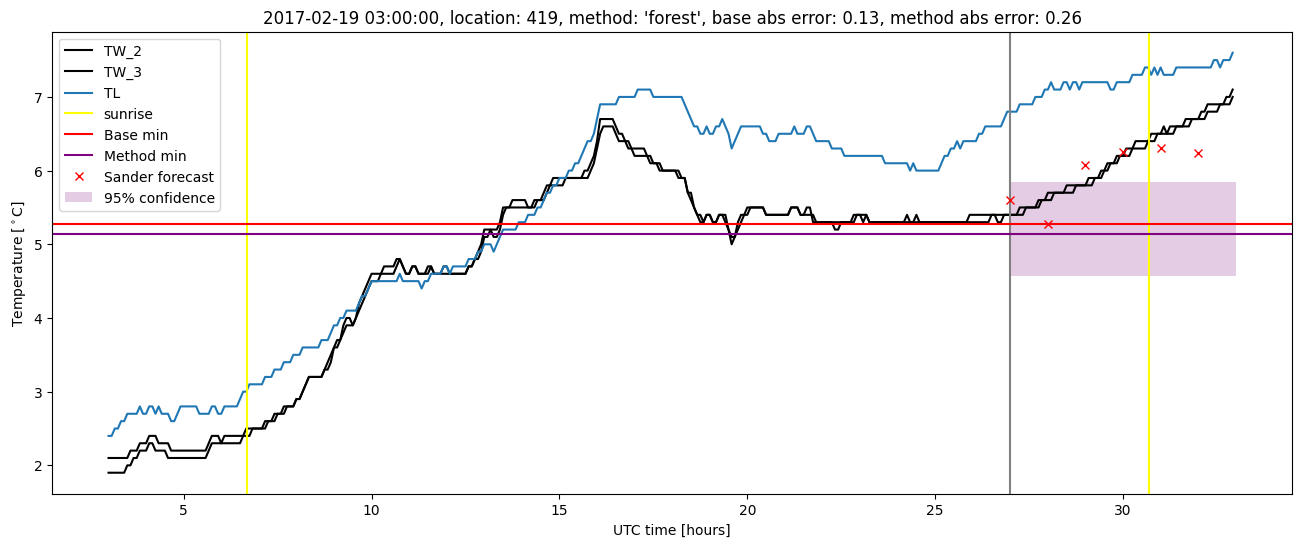
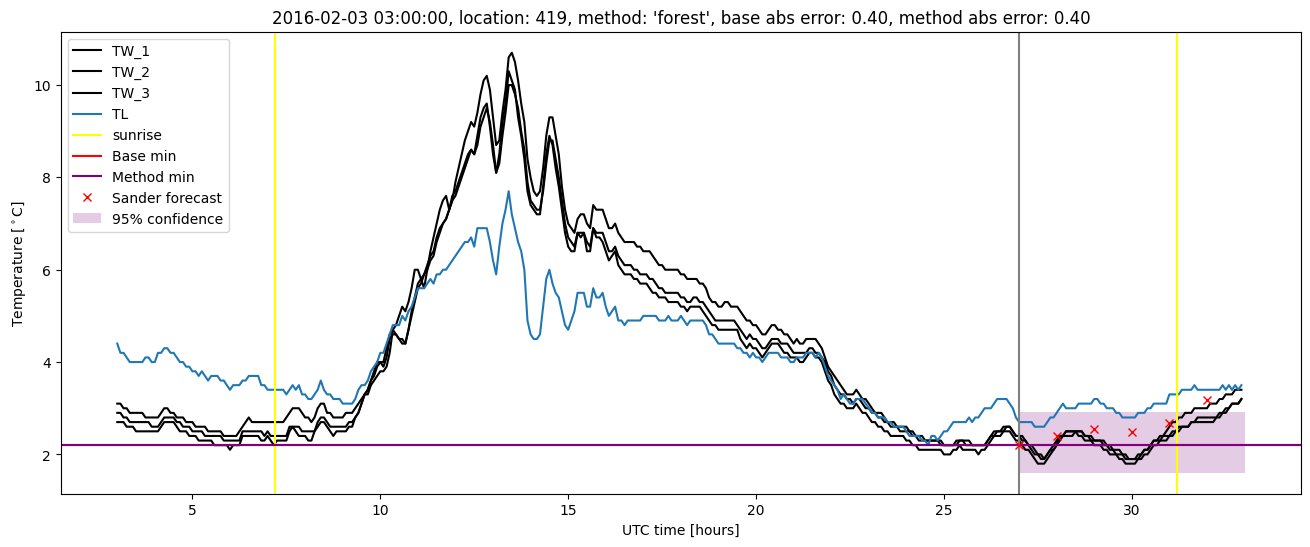
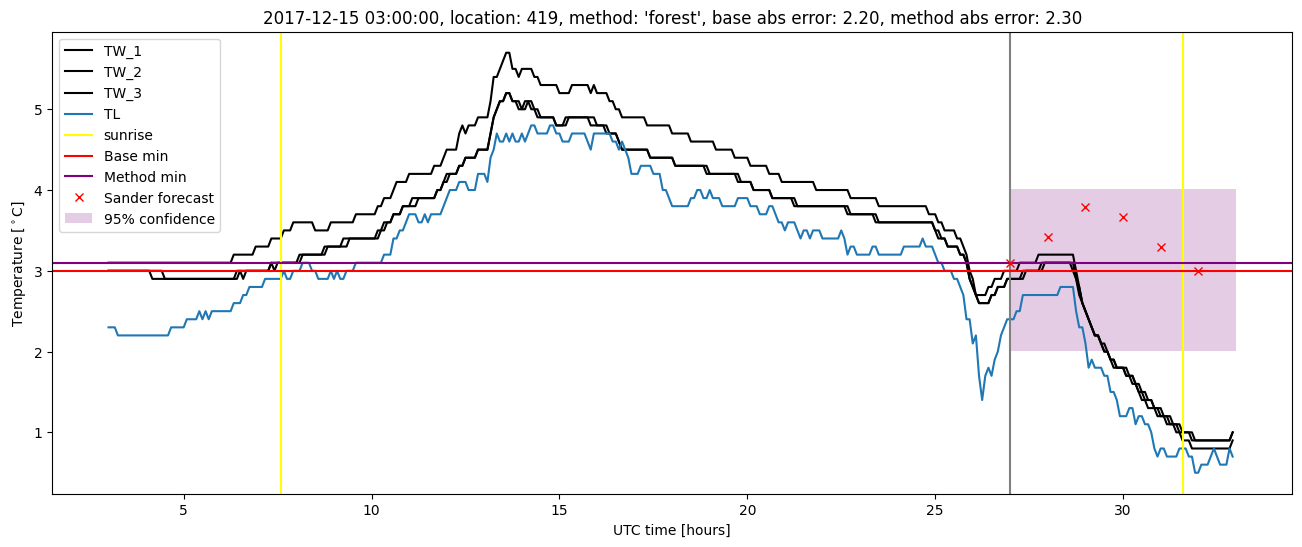
Random forest plots
Extended logistic regression results
| names |
period |
power |
significance |
meanSquareError |
absError |
maxError |
CRPS |
IGN |
| baseline |
winter 2016 |
0.976 |
0.000e+00 |
0.295 |
0.396 |
2.390 |
NaN |
NaN |
| elr |
winter 2016 |
0.976 |
0.000e+00 |
0.258 |
0.385 |
1.690 |
0.500 |
3.142 |
| baseline |
winter 2017 |
0.953 |
0.025 |
0.471 |
0.497 |
2.793 |
NaN |
NaN |
| elr |
winter 2017 |
0.953 |
0.025 |
0.374 |
0.467 |
2.164 |
0.502 |
3.095 |
| baseline |
winter 2018 |
0.991 |
0.040 |
0.354 |
0.403 |
2.359 |
NaN |
NaN |
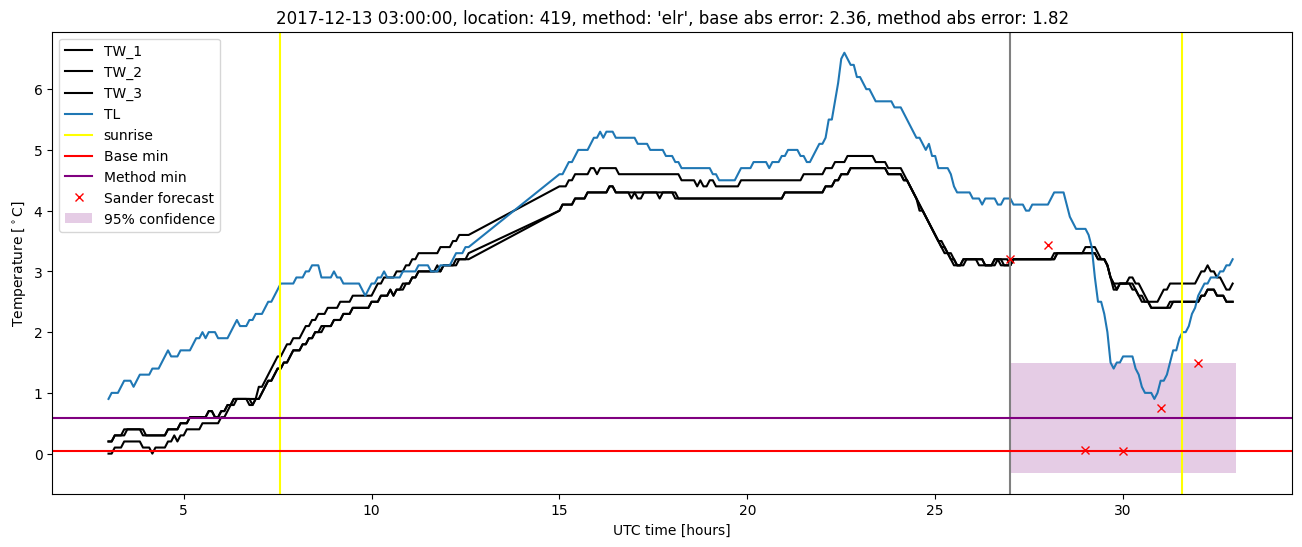
| elr |
winter 2018 |
0.974 |
0.120 |
0.322 |
0.416 |
2.263 |
0.500 |
3.418 |
| baseline |
winter 2019 |
0.985 |
0.000e+00 |
0.376 |
0.417 |
2.571 |
NaN |
NaN |
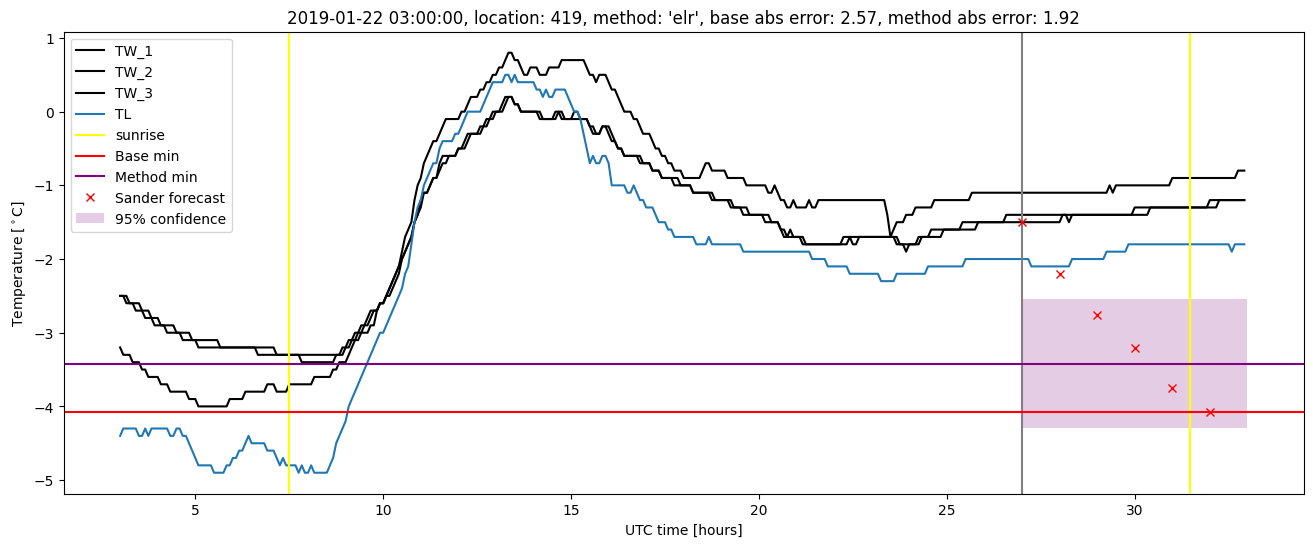
| elr |
winter 2019 |
0.985 |
0.071 |
0.331 |
0.453 |
1.925 |
0.491 |
3.592 |
| baseline |
all |
0.977 |
0.020 |
0.369 |
0.426 |
2.793 |
NaN |
NaN |
| elr |
all |
0.973 |
0.051 |
0.317 |
0.427 |
2.263 |
0.498 |
3.299 |
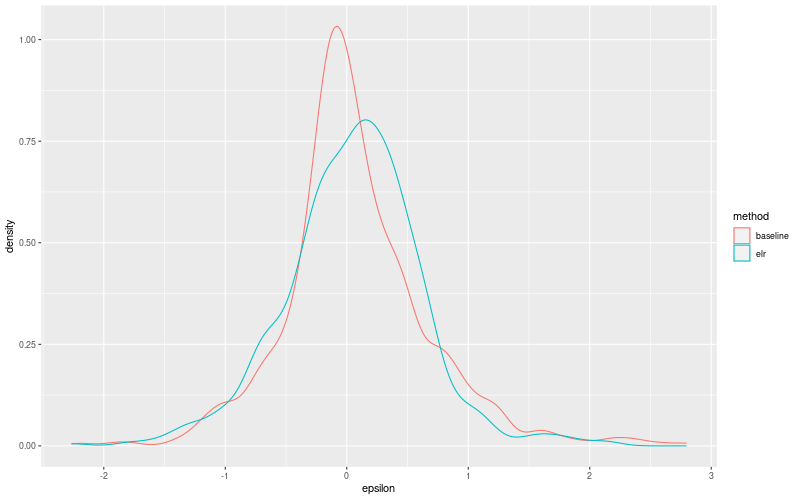
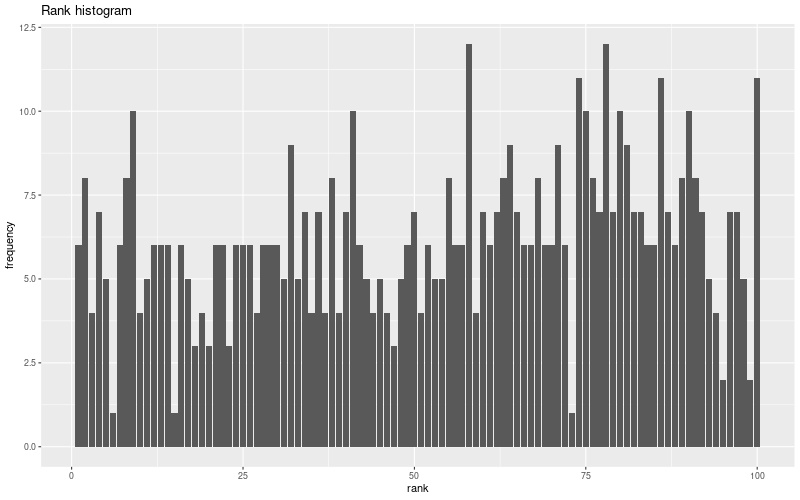
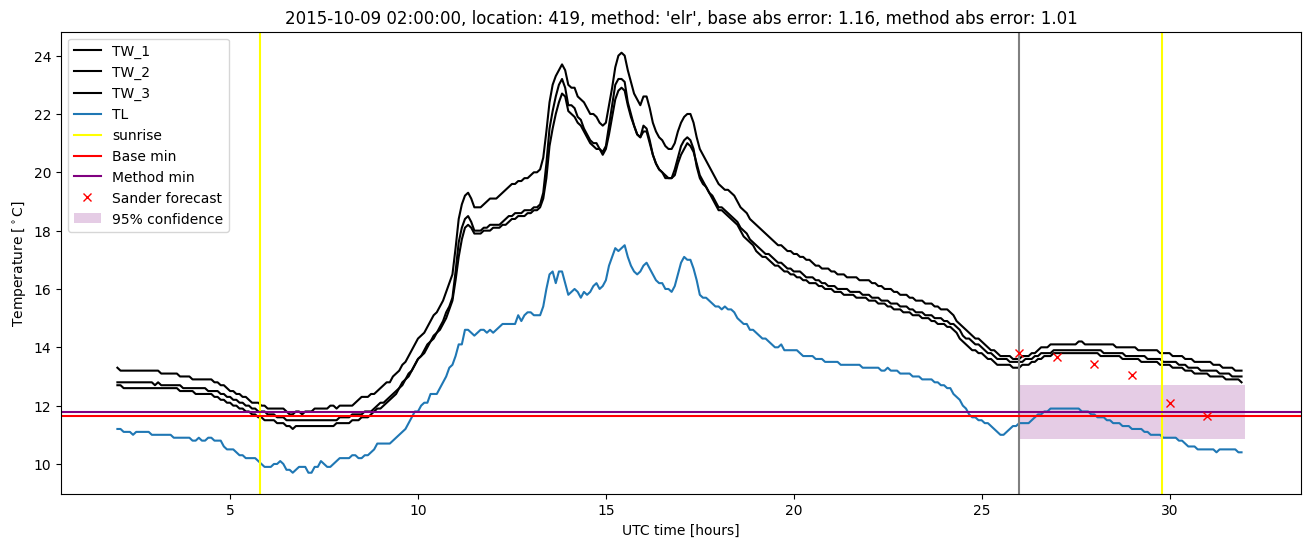
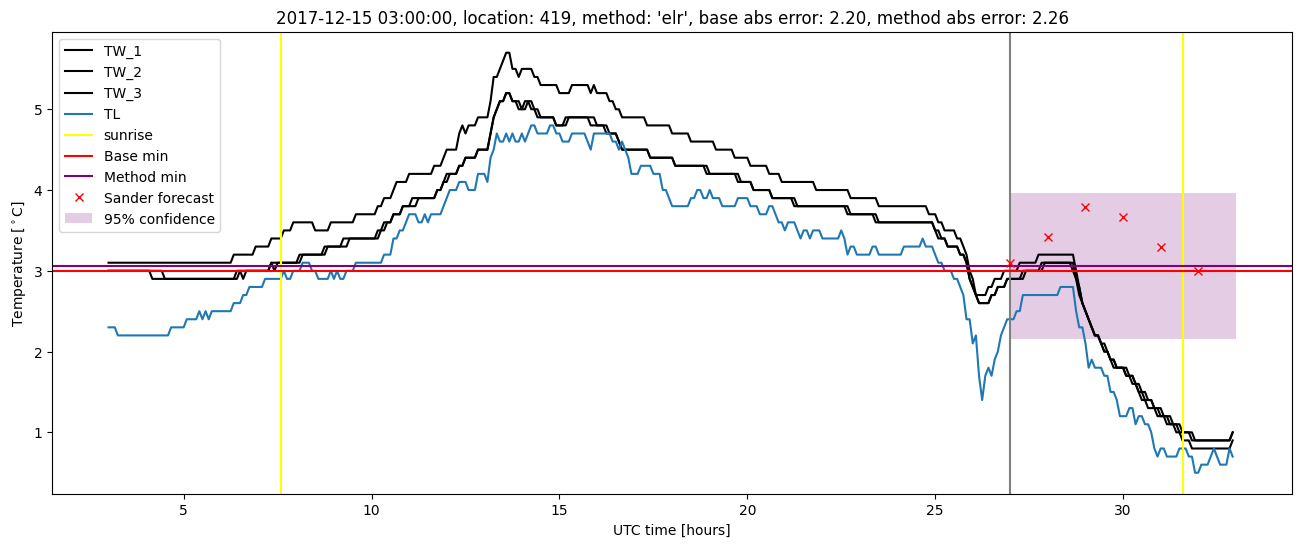
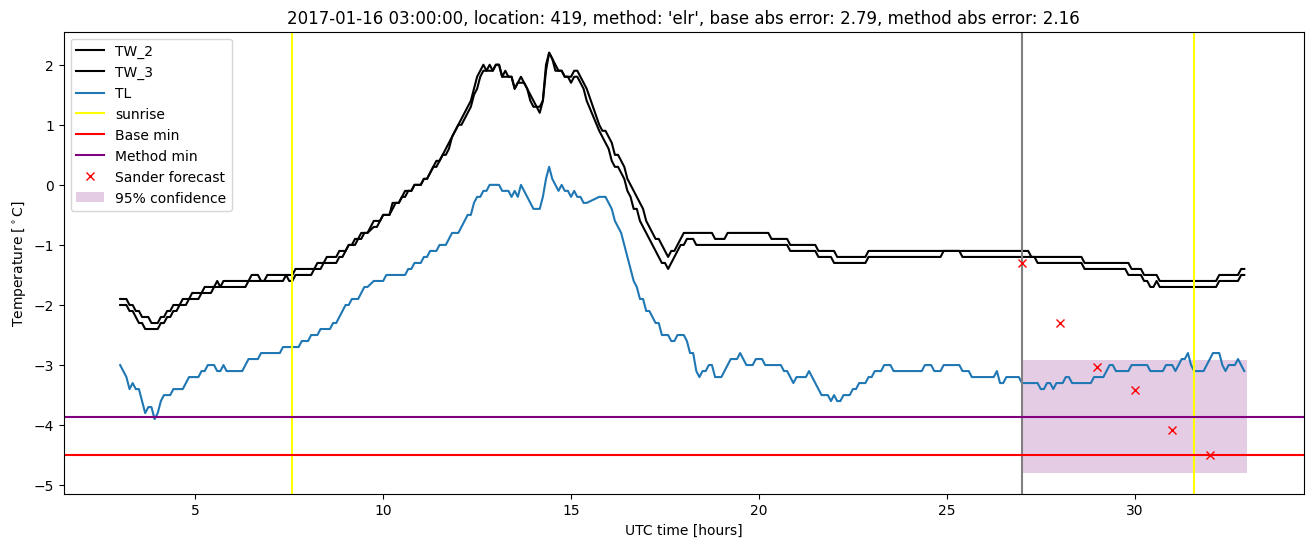
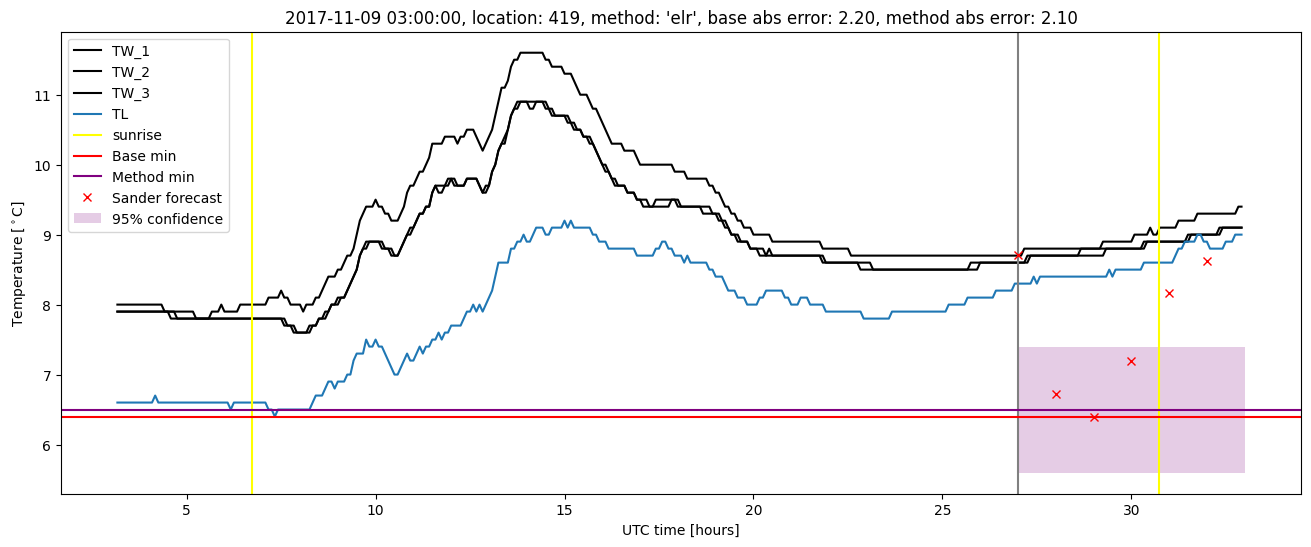
Extended logistic regression plots