GMS location: 418
Random forest results
| names |
period |
power |
significance |
meanSquareError |
absError |
maxError |
CRPS |
IGN |
| baseline |
winter 2016 |
0.994 |
0.042 |
0.318 |
0.420 |
1.847 |
NaN |
NaN |
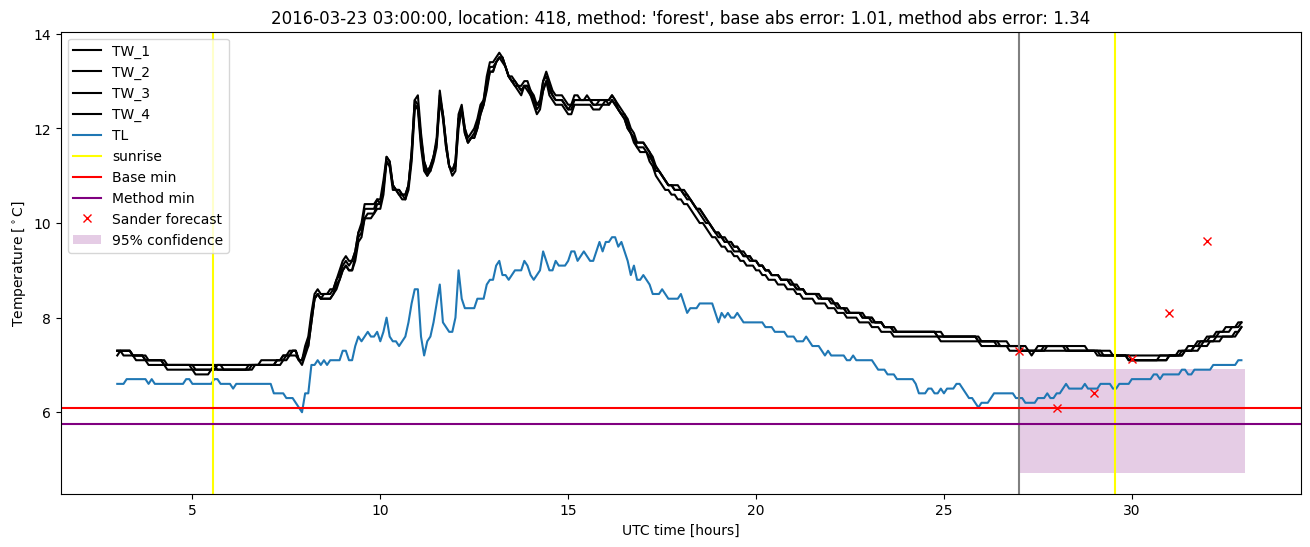
| forest |
winter 2016 |
0.994 |
0.083 |
0.245 |
0.374 |
1.669 |
0.475 |
4.985 |
| baseline |
winter 2017 |
0.991 |
0.050 |
0.359 |
0.441 |
2.510 |
NaN |
NaN |
| forest |
winter 2017 |
0.991 |
0.100 |
0.286 |
0.388 |
2.213 |
0.472 |
5.079 |
| baseline |
winter 2018 |
0.993 |
0.171 |
0.398 |
0.471 |
1.856 |
NaN |
NaN |
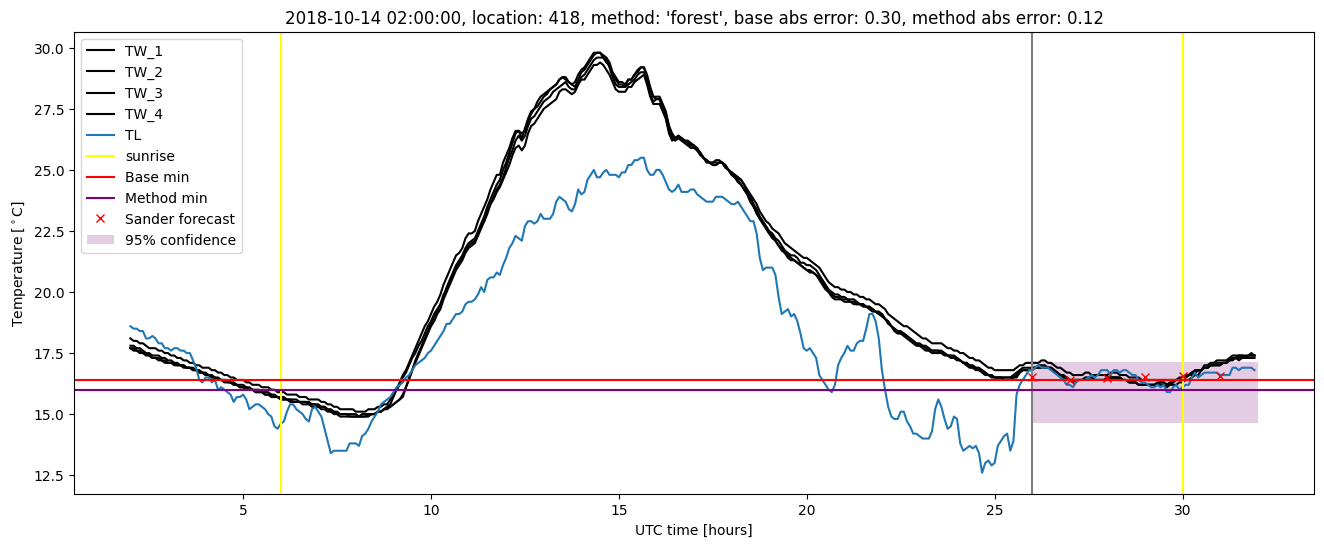
| forest |
winter 2018 |
0.993 |
0.114 |
0.306 |
0.413 |
1.716 |
0.485 |
5.103 |
| baseline |
winter 2019 |
0.987 |
0.000e+00 |
0.374 |
0.428 |
2.416 |
NaN |
NaN |
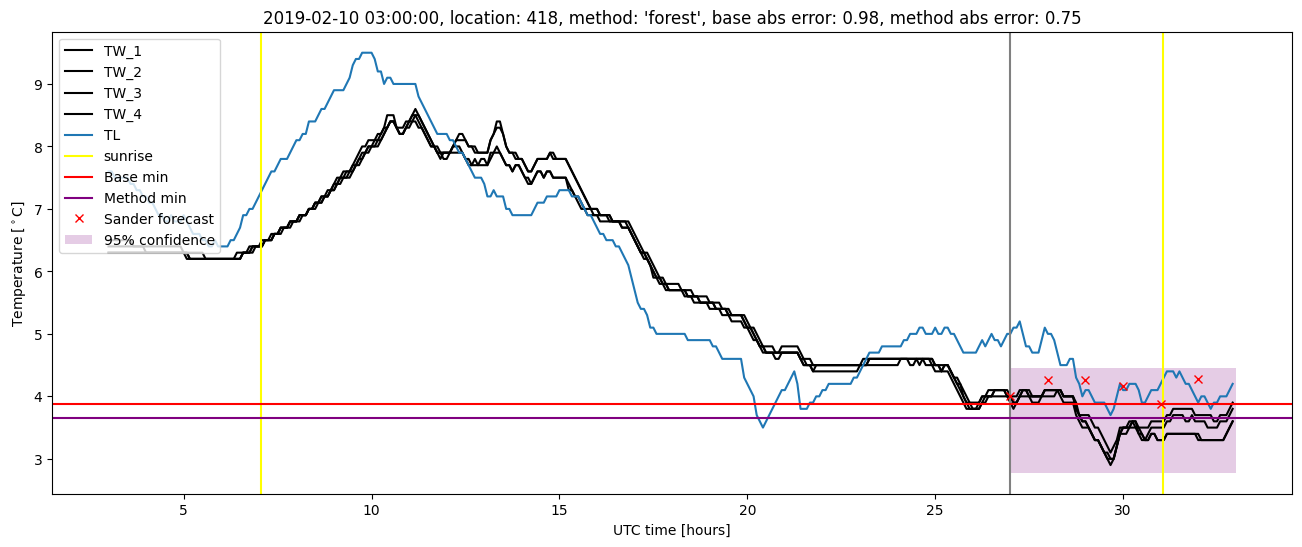
| forest |
winter 2019 |
0.994 |
0.000e+00 |
0.280 |
0.387 |
1.980 |
0.474 |
4.496 |
| baseline |
all |
0.991 |
0.080 |
0.361 |
0.440 |
2.510 |
NaN |
NaN |
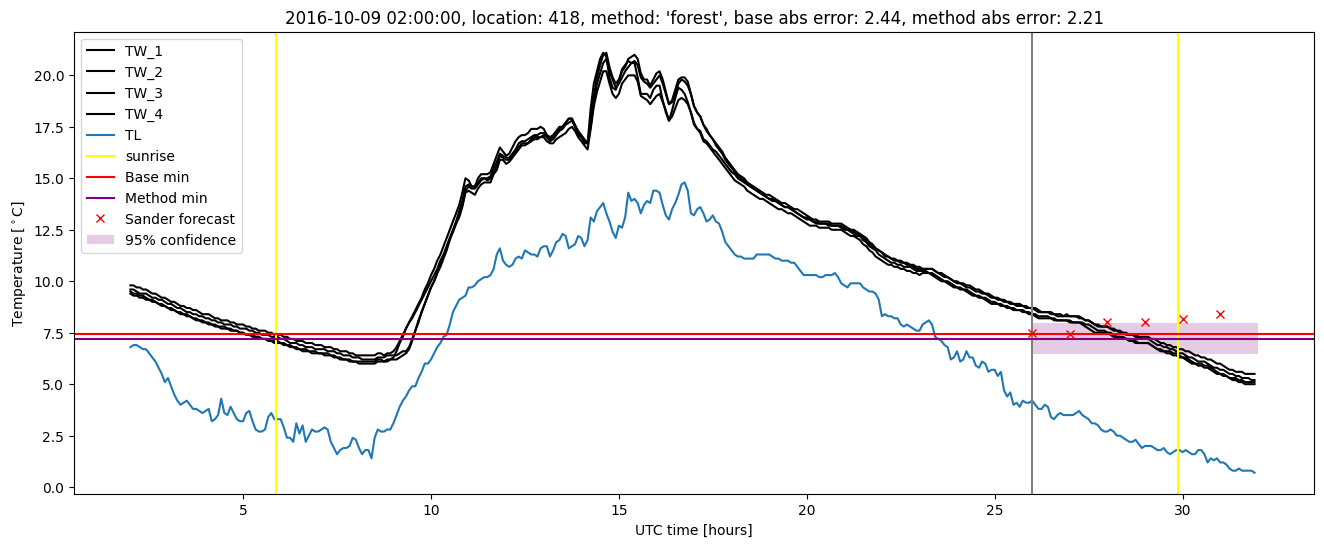
| forest |
all |
0.993 |
0.088 |
0.278 |
0.390 |
2.213 |
0.477 |
4.916 |
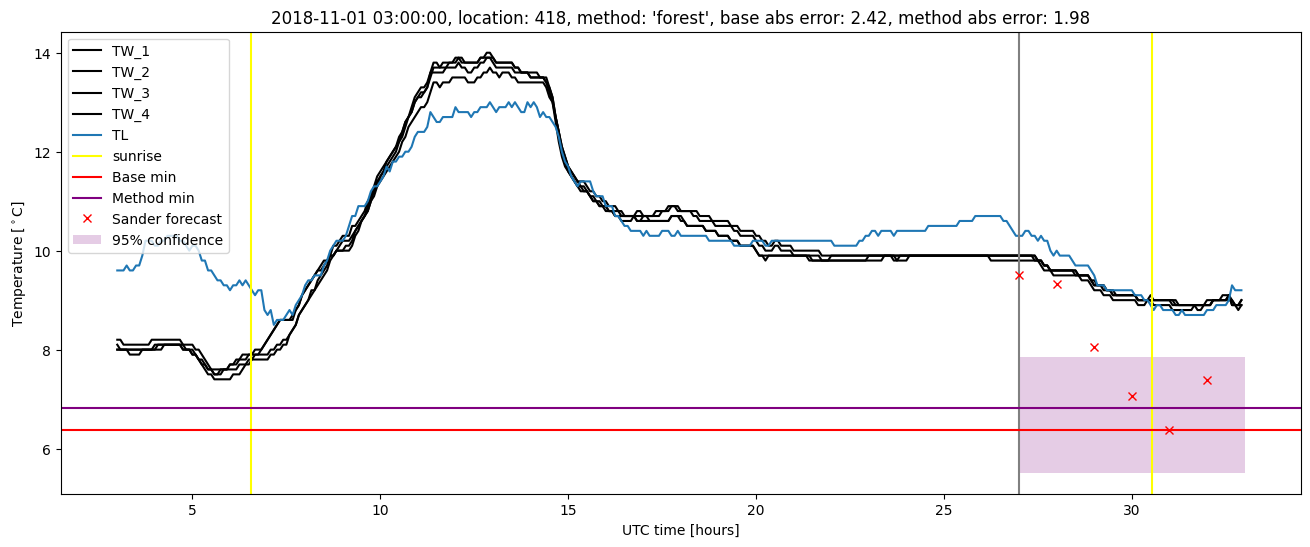
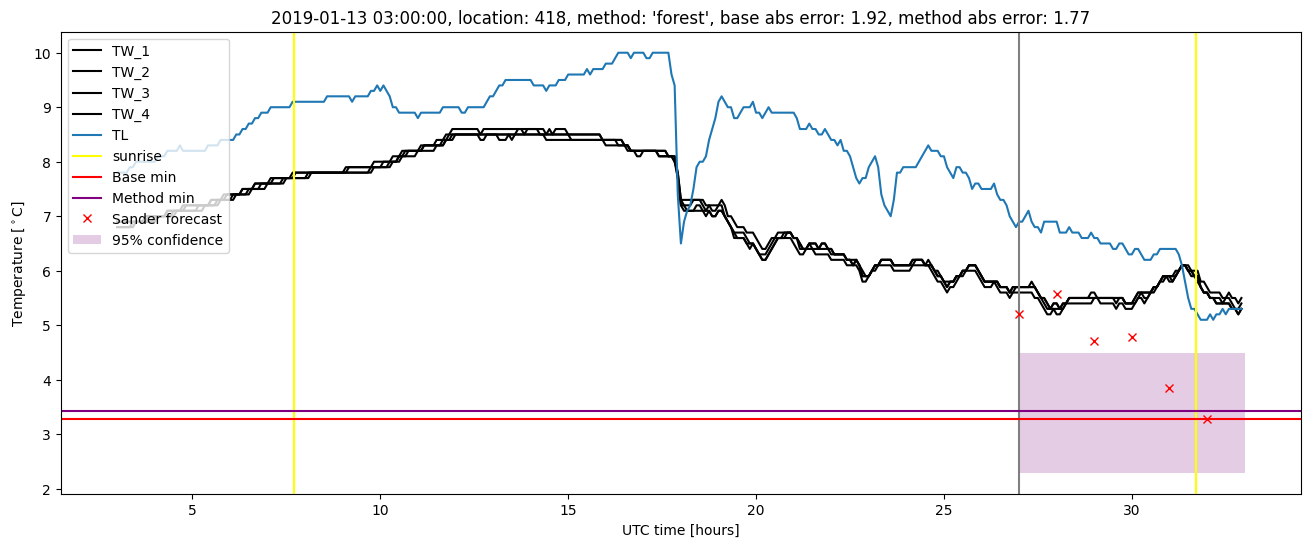
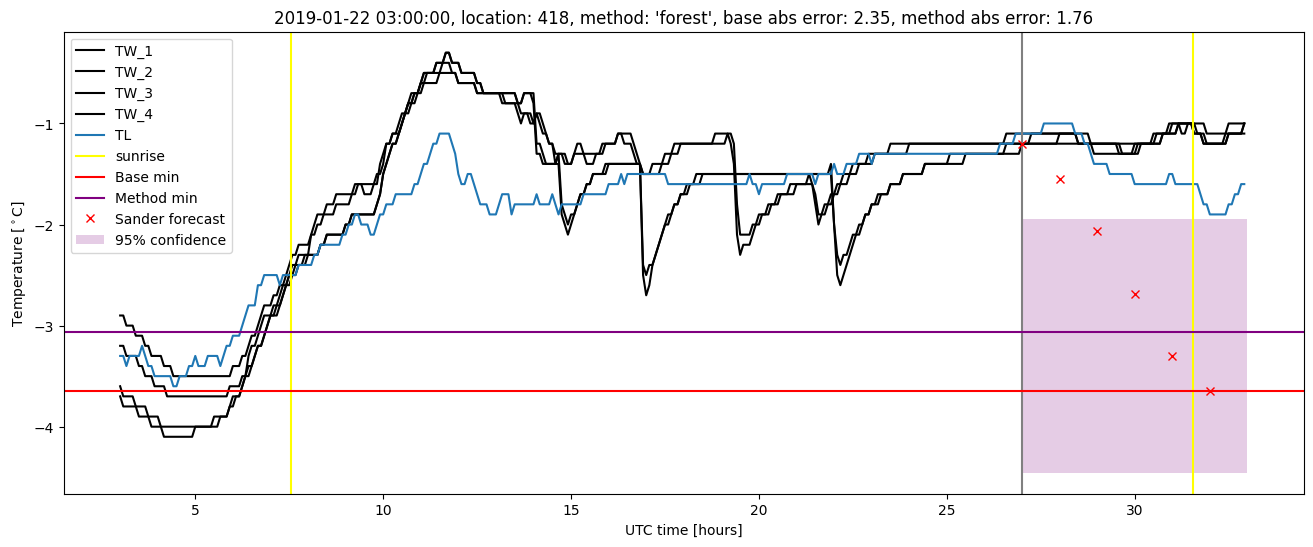
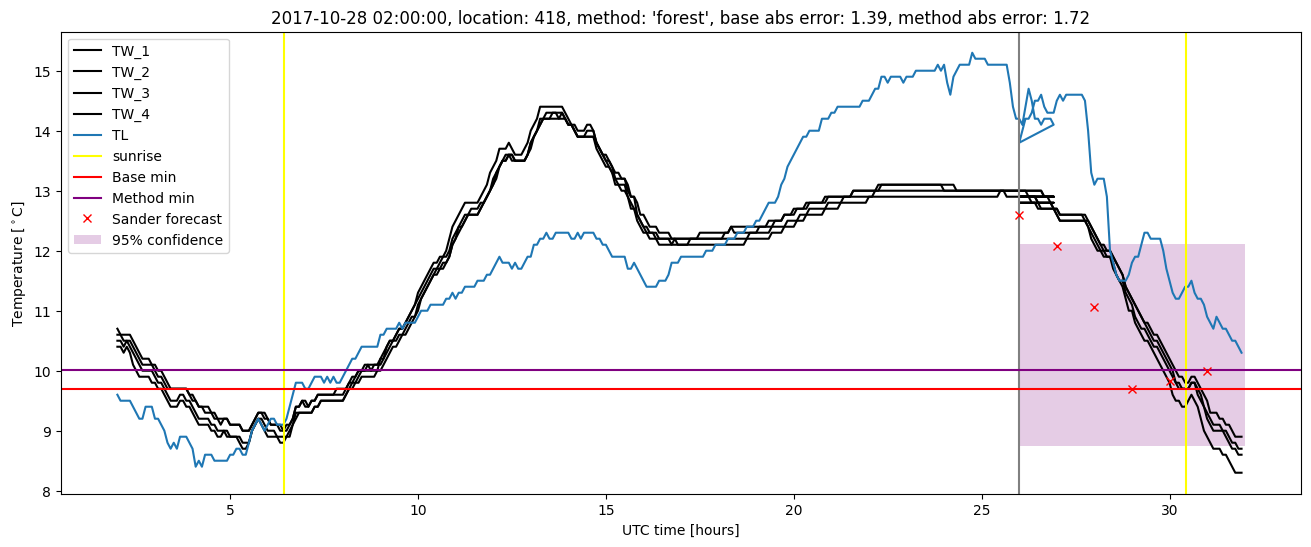
Random forest plots
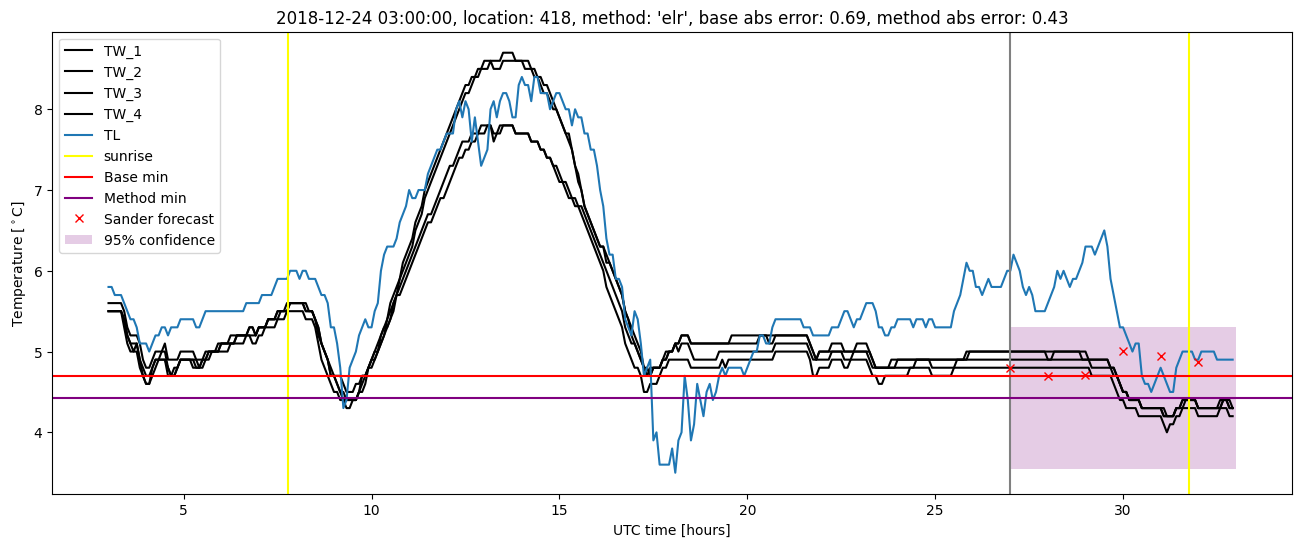
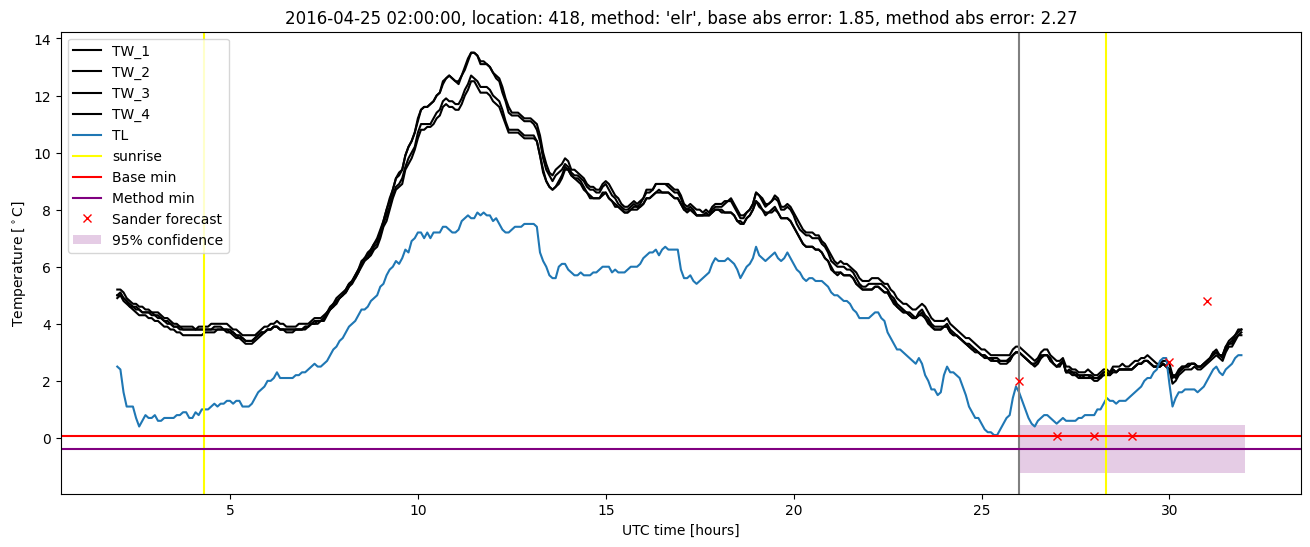
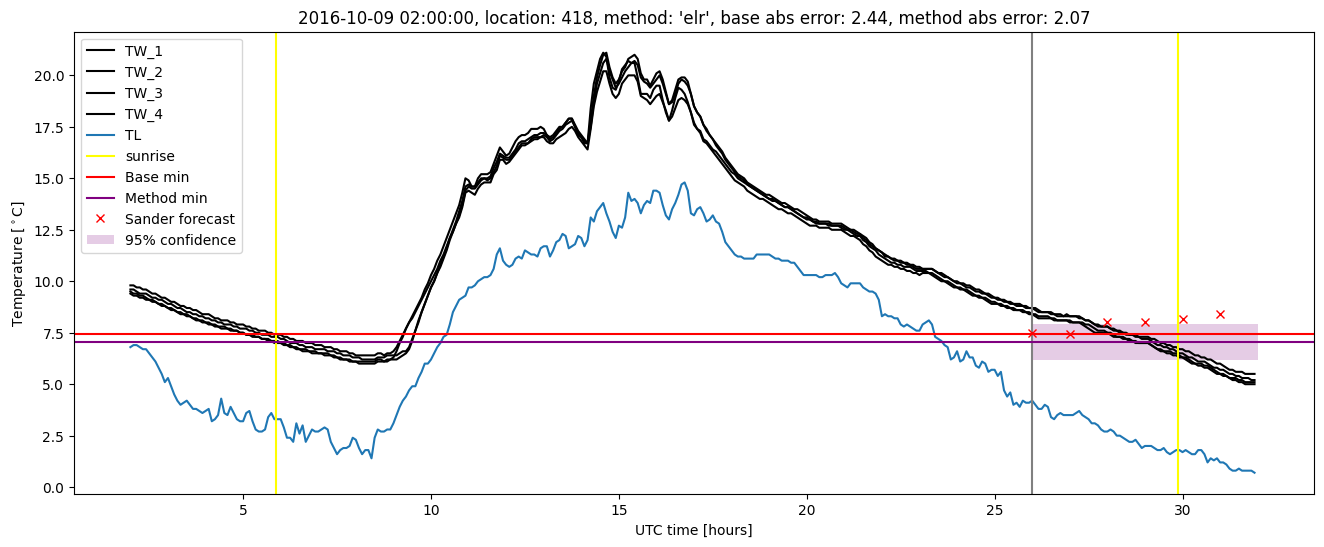
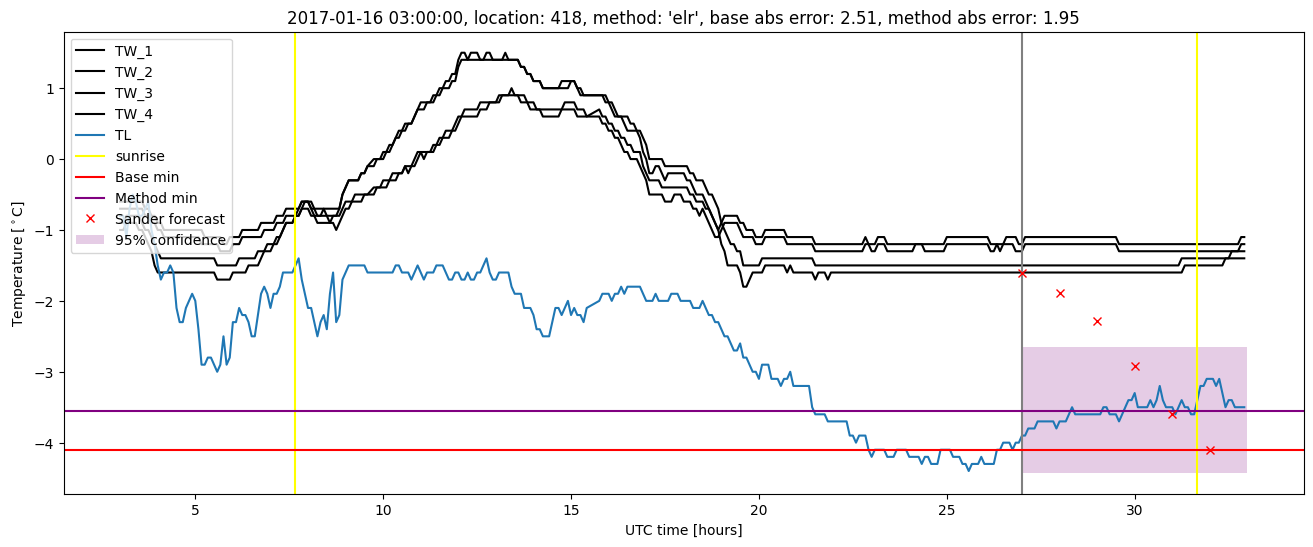
Extended logistic regression results
| names |
period |
power |
significance |
meanSquareError |
absError |
maxError |
CRPS |
IGN |
| baseline |
winter 2016 |
0.994 |
0.042 |
0.318 |
0.420 |
1.847 |
NaN |
NaN |
| elr |
winter 2016 |
0.982 |
0.042 |
0.312 |
0.423 |
2.272 |
0.565 |
5.444 |
| baseline |
winter 2017 |
0.991 |
0.050 |
0.359 |
0.441 |
2.510 |
NaN |
NaN |
| elr |
winter 2017 |
0.991 |
0.100 |
0.271 |
0.380 |
2.067 |
0.508 |
3.744 |
| baseline |
winter 2018 |
0.993 |
0.171 |
0.398 |
0.471 |
1.856 |
NaN |
NaN |
| elr |
winter 2018 |
0.986 |
0.171 |
0.346 |
0.449 |
1.721 |
0.535 |
4.318 |
| baseline |
winter 2019 |
0.987 |
0.000e+00 |
0.374 |
0.428 |
2.416 |
NaN |
NaN |
| elr |
winter 2019 |
0.987 |
0.000e+00 |
0.292 |
0.419 |
1.850 |
0.498 |
3.648 |
| baseline |
all |
0.991 |
0.080 |
0.361 |
0.440 |
2.510 |
NaN |
NaN |
| elr |
all |
0.986 |
0.097 |
0.306 |
0.419 |
2.272 |
0.528 |
4.338 |
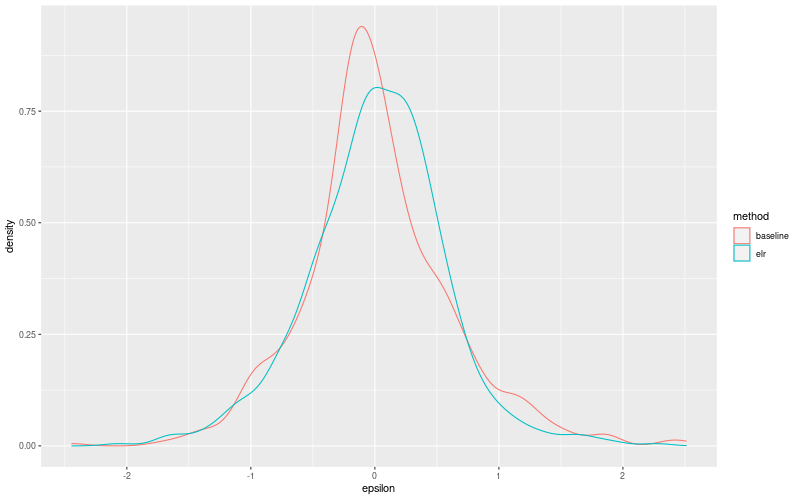
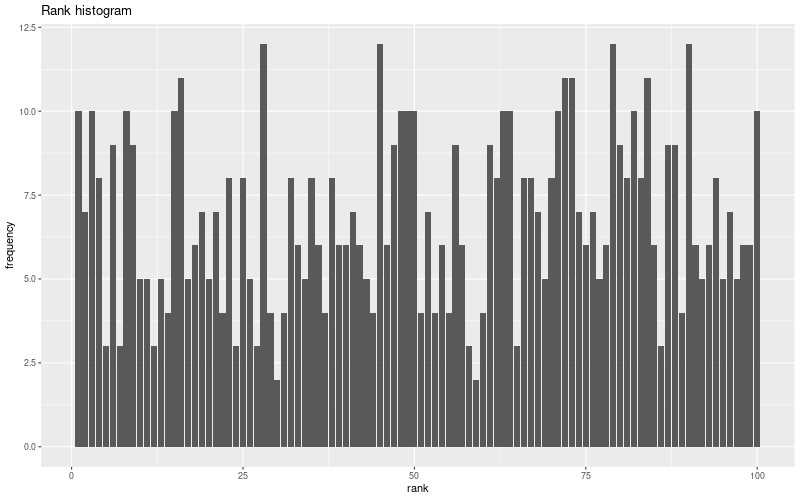
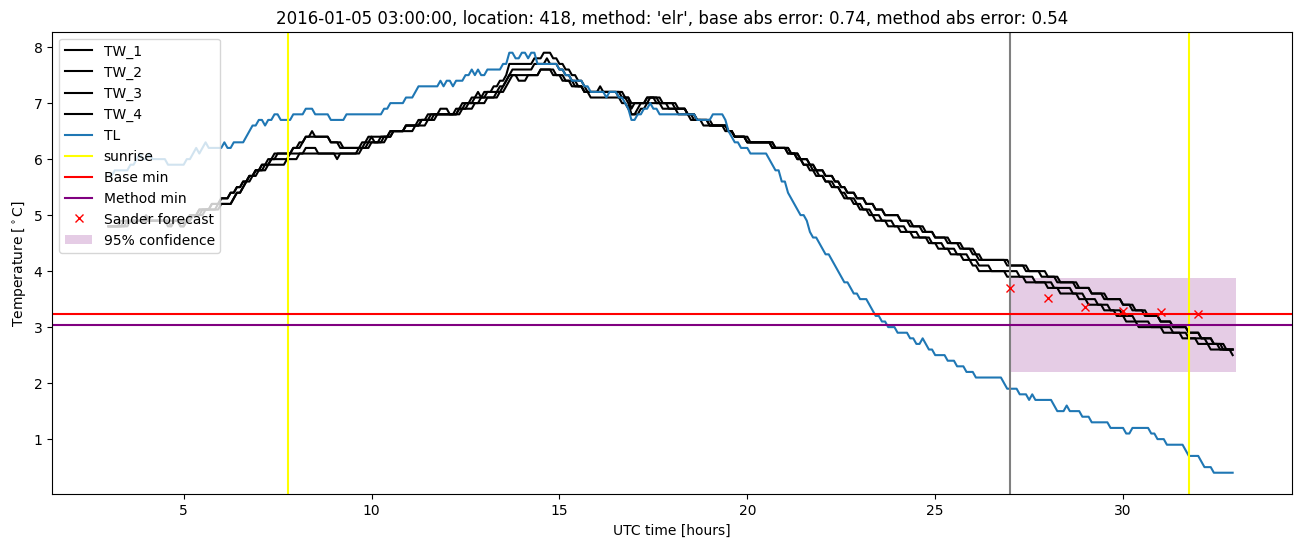
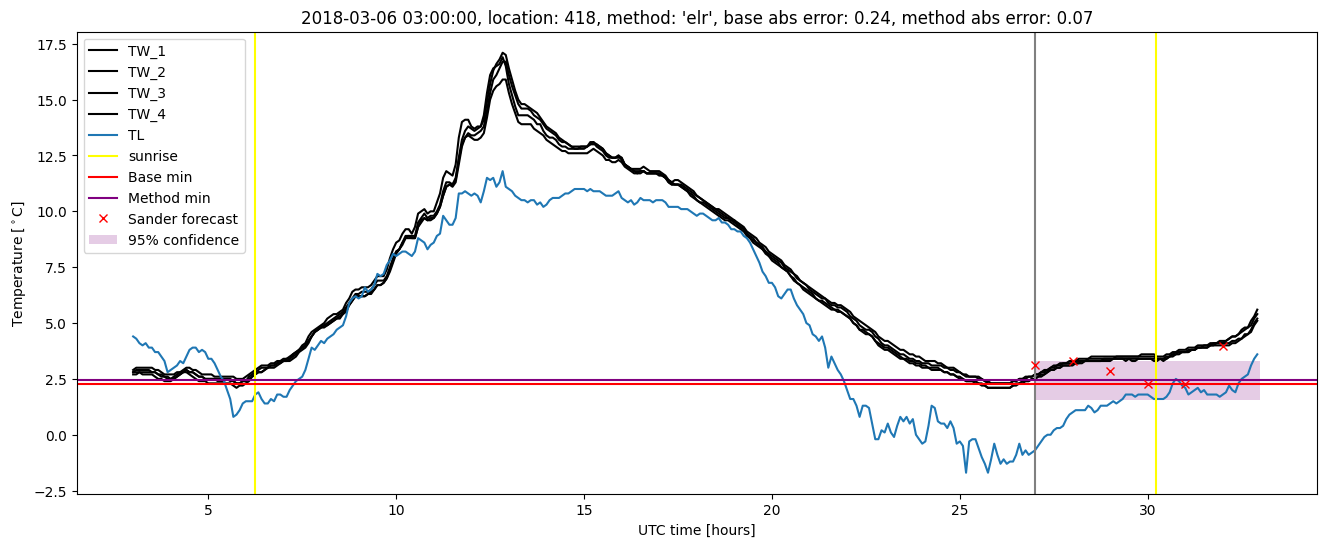
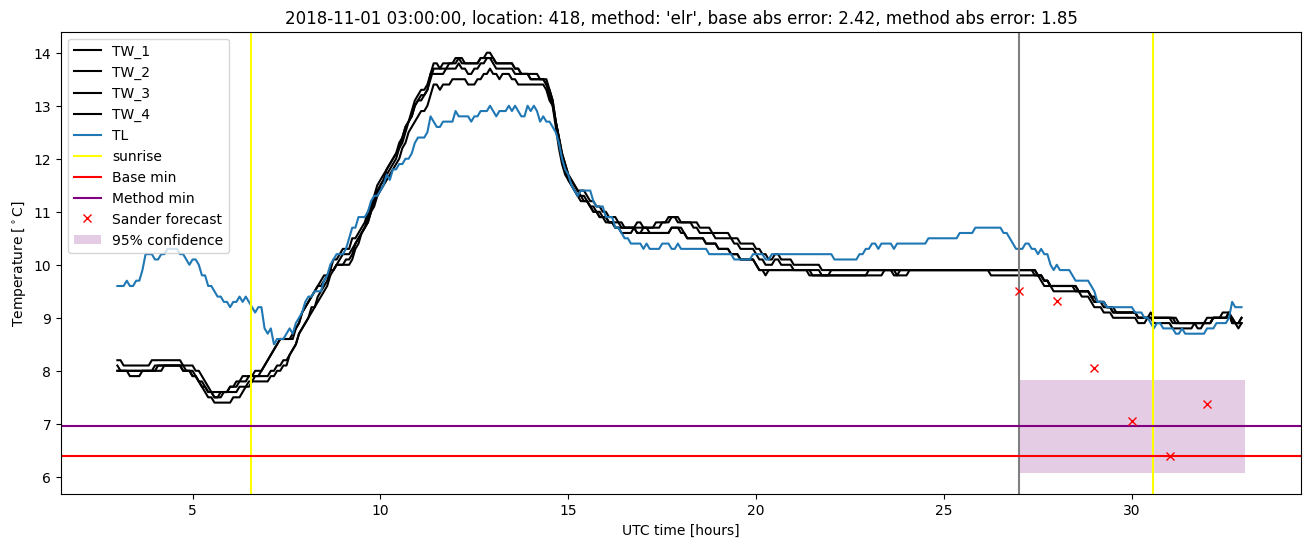
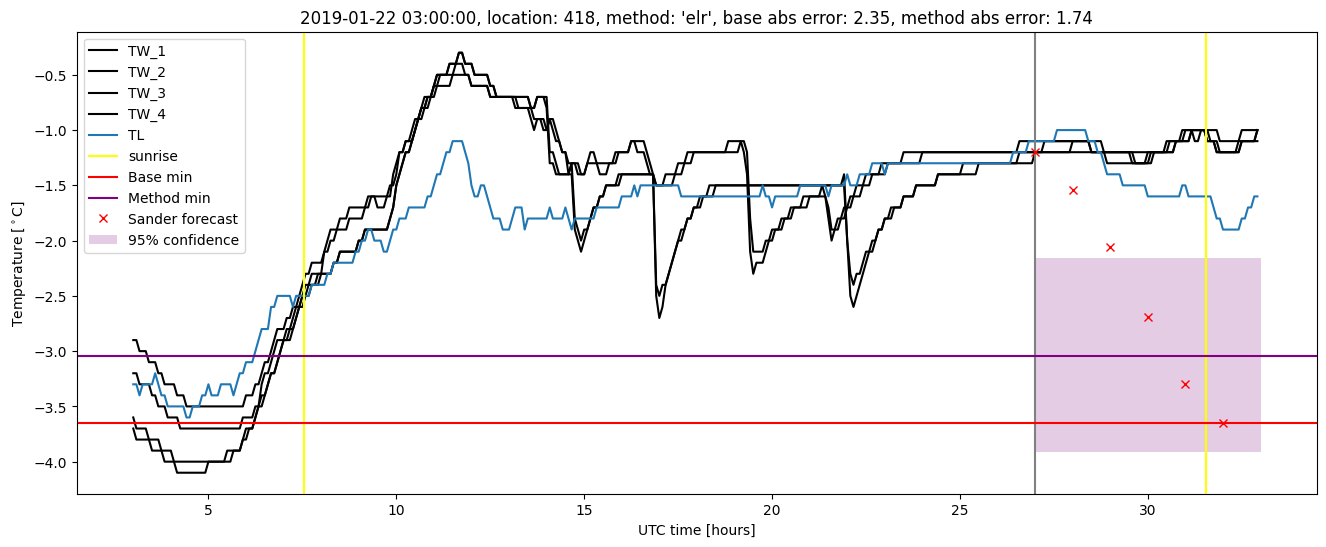
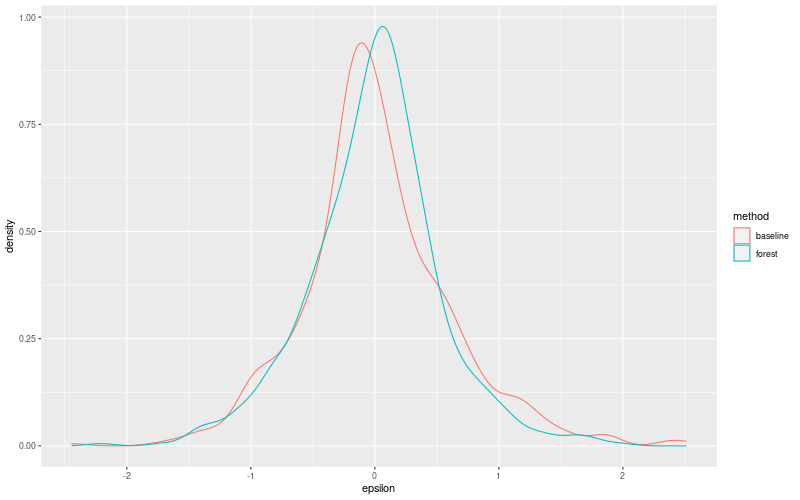
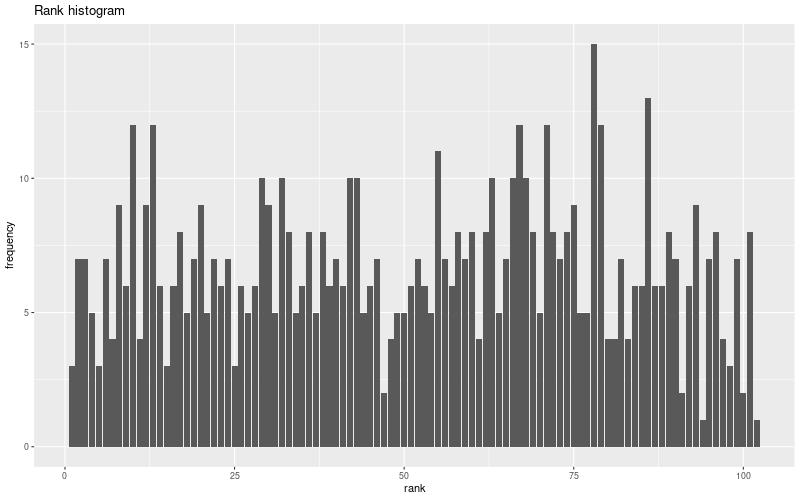
Extended logistic regression plots