GMS location: 417
Random forest results
| names |
period |
power |
significance |
meanSquareError |
absError |
maxError |
CRPS |
IGN |
| baseline |
winter 2016 |
0.977 |
0.065 |
0.466 |
0.477 |
3.163 |
NaN |
NaN |
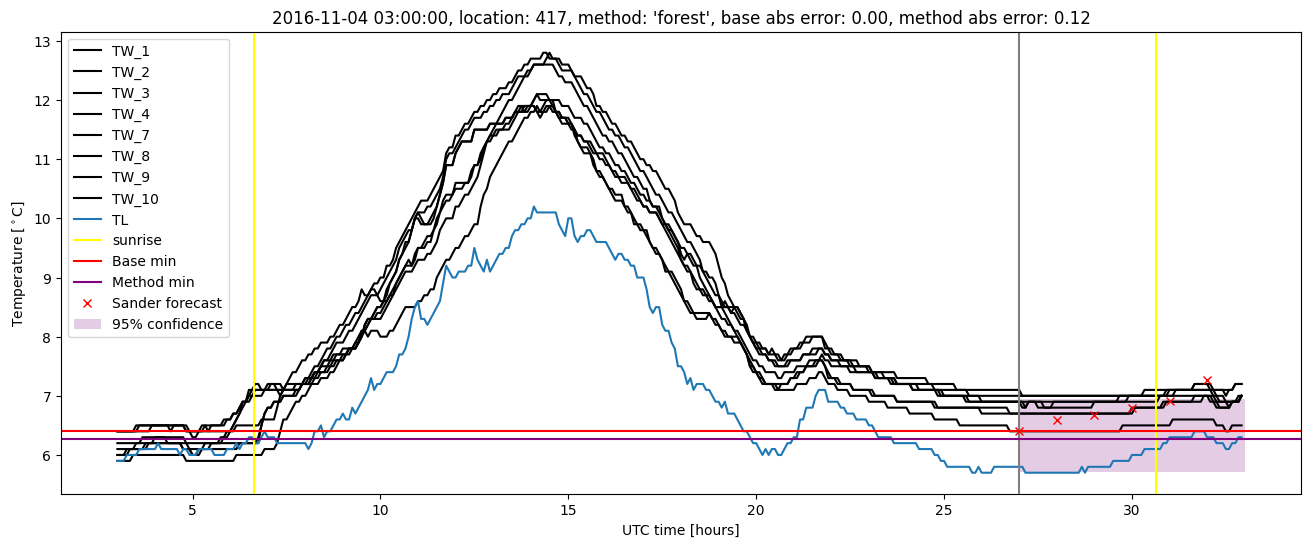
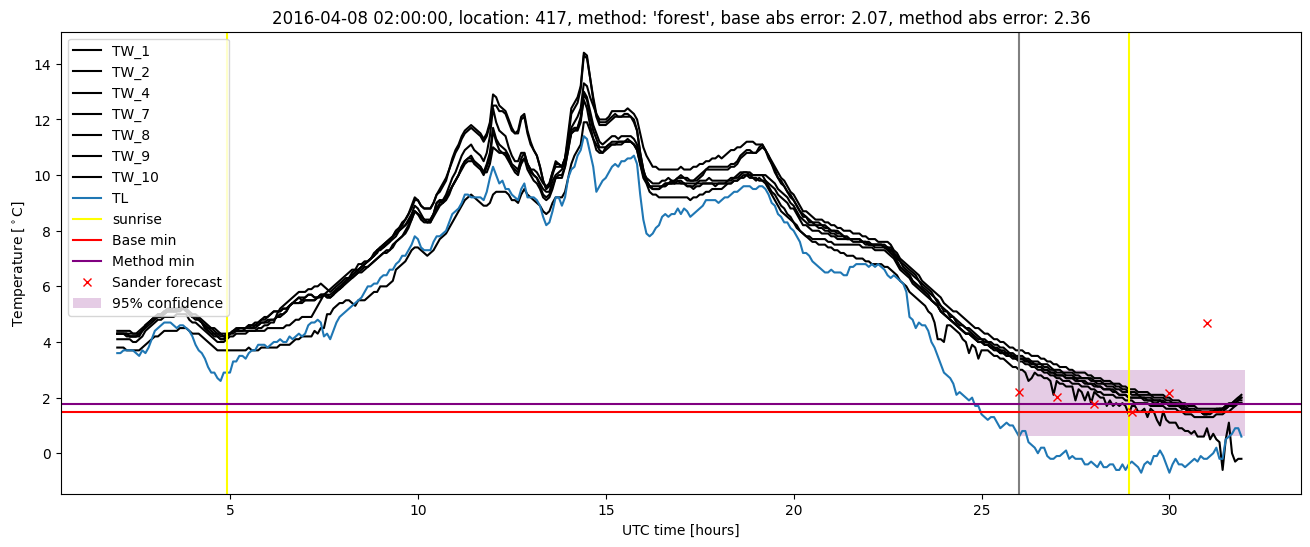
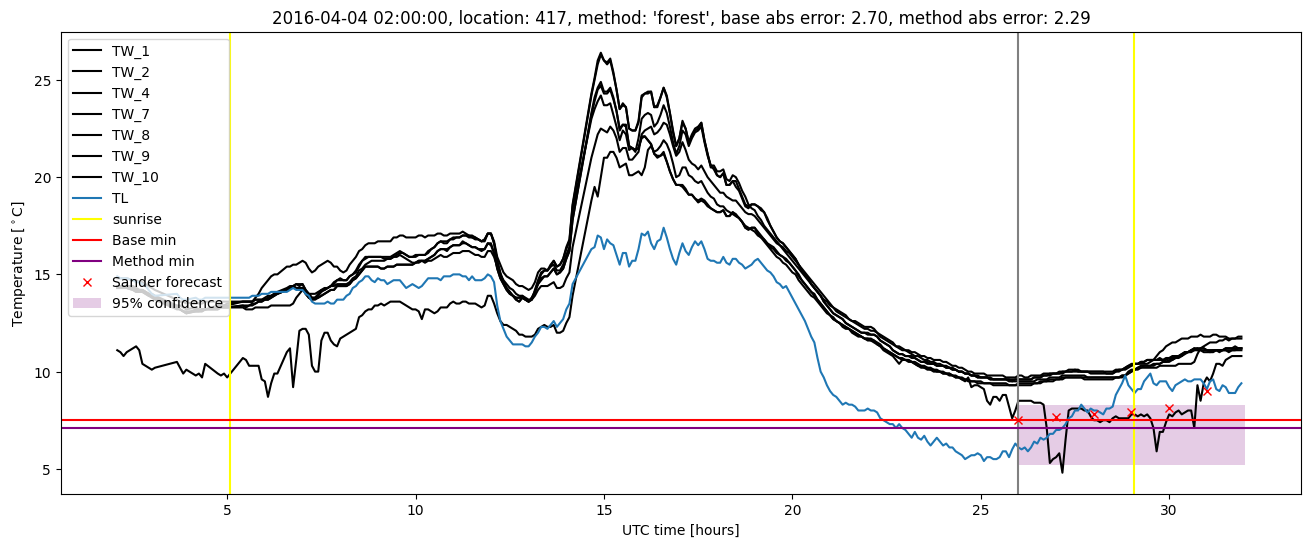
| forest |
winter 2016 |
0.977 |
0.032 |
0.400 |
0.424 |
3.247 |
0.442 |
3.085 |
| baseline |
winter 2017 |
1.000 |
0.022 |
0.366 |
0.424 |
2.396 |
NaN |
NaN |
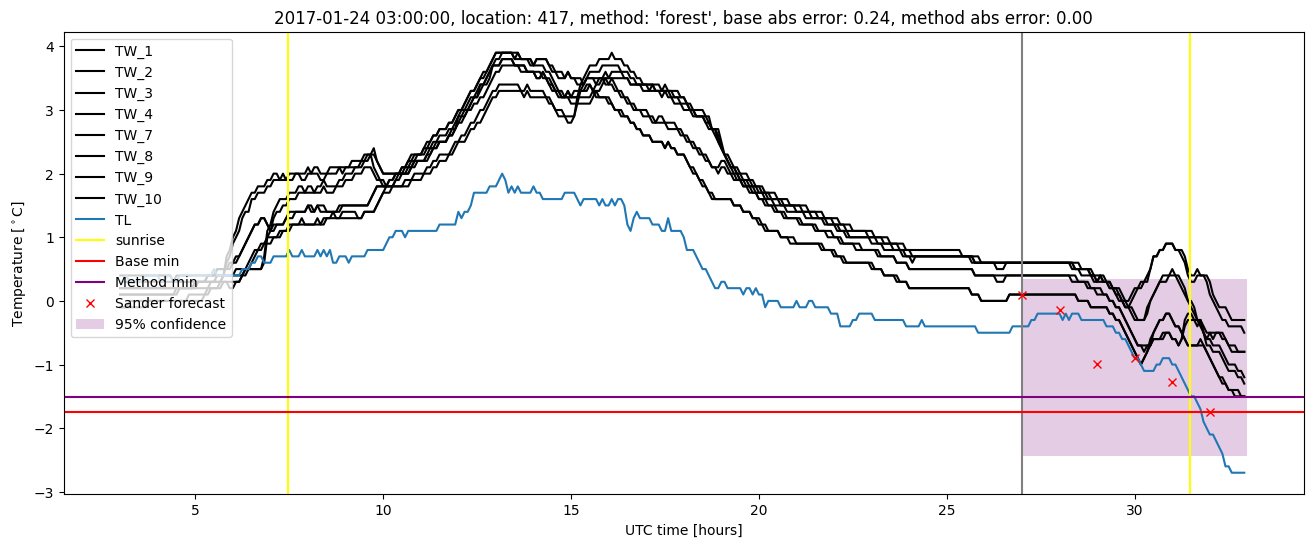
| forest |
winter 2017 |
1.000 |
0.022 |
0.303 |
0.400 |
2.001 |
0.440 |
2.257 |
| baseline |
winter 2018 |
0.985 |
0.073 |
0.509 |
0.495 |
3.696 |
NaN |
NaN |
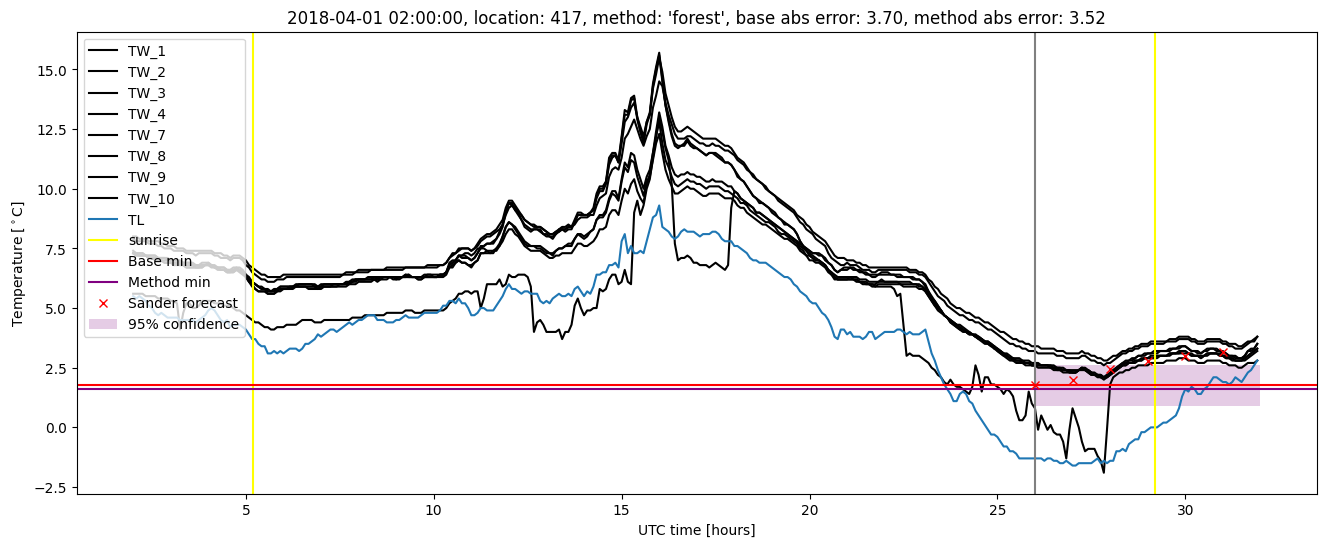
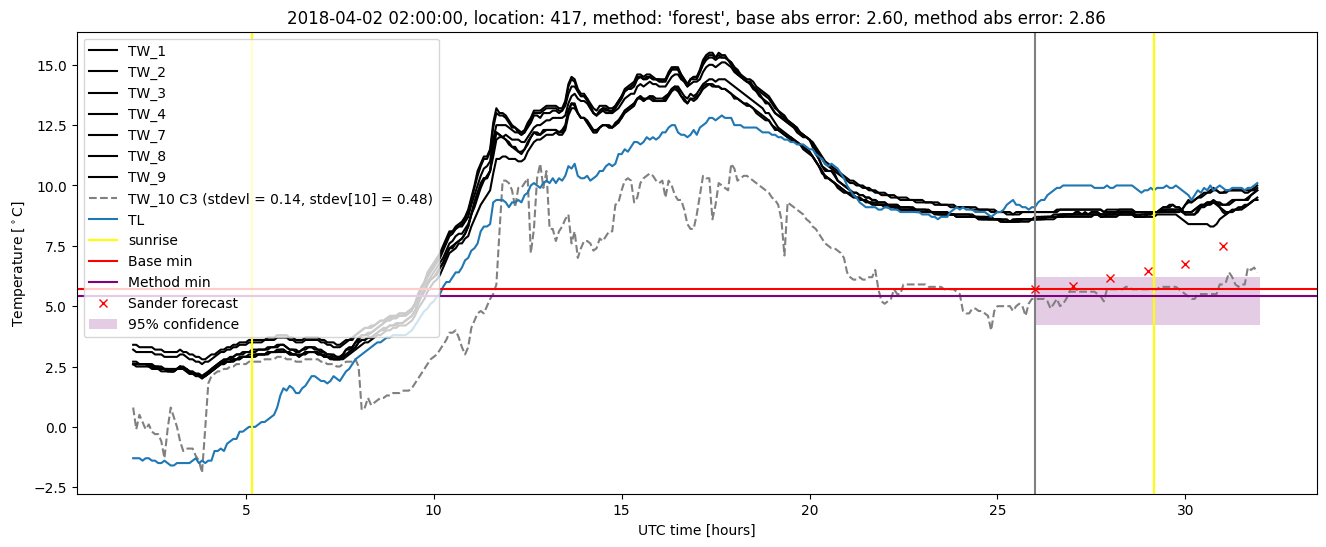
| forest |
winter 2018 |
0.978 |
0.122 |
0.439 |
0.451 |
3.516 |
0.456 |
2.708 |
| baseline |
winter 2019 |
0.985 |
0.000e+00 |
0.332 |
0.395 |
2.293 |
NaN |
NaN |
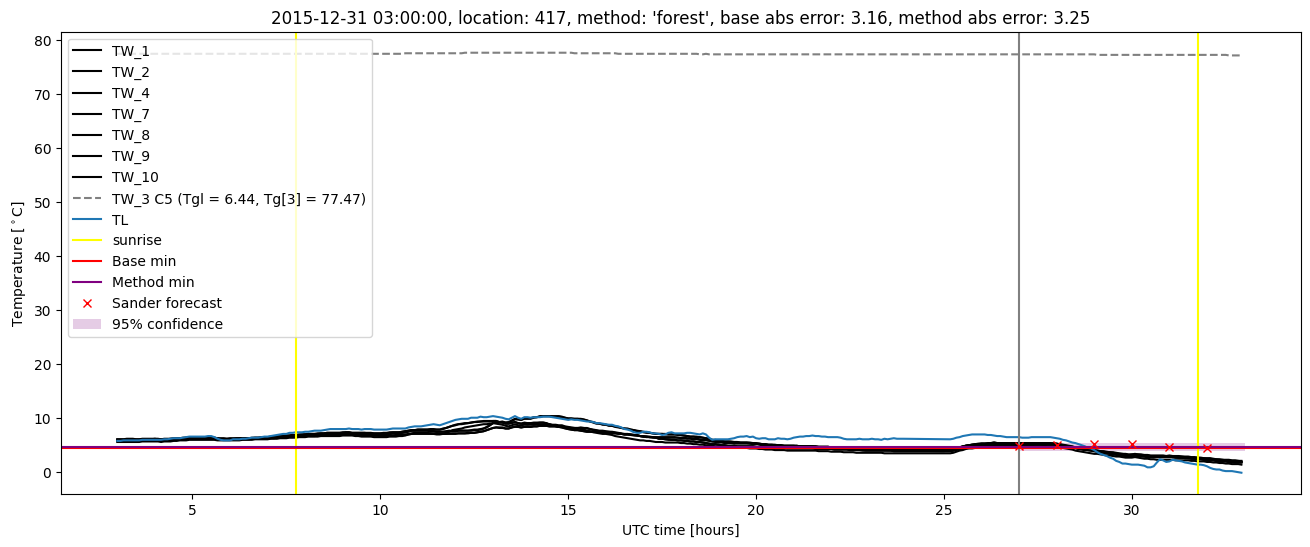
| forest |
winter 2019 |
0.993 |
0.000e+00 |
0.254 |
0.350 |
1.816 |
0.444 |
2.025 |
| baseline |
all |
0.986 |
0.044 |
0.422 |
0.449 |
3.696 |
NaN |
NaN |
| forest |
all |
0.986 |
0.051 |
0.353 |
0.408 |
3.516 |
0.446 |
2.534 |
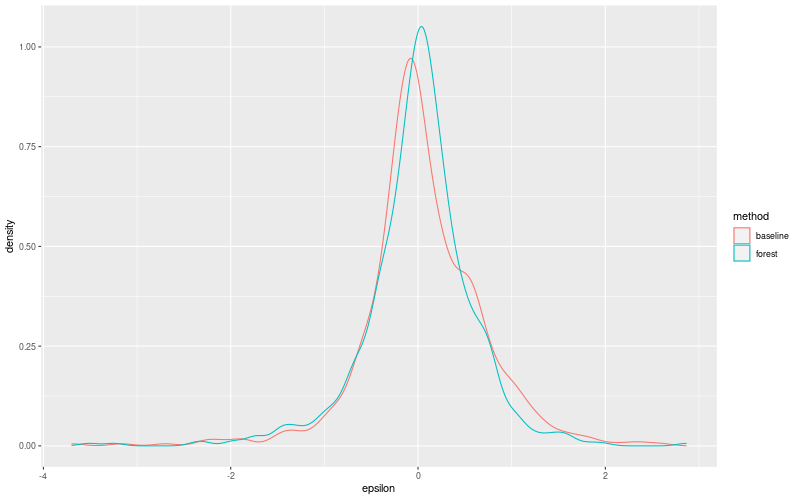
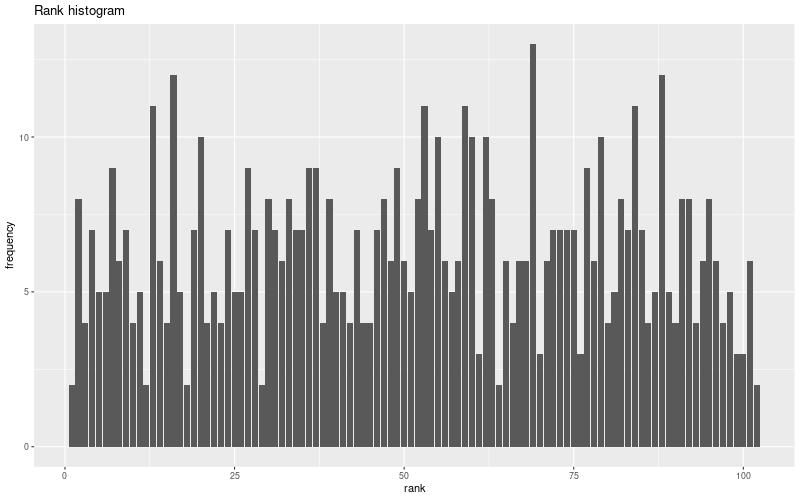
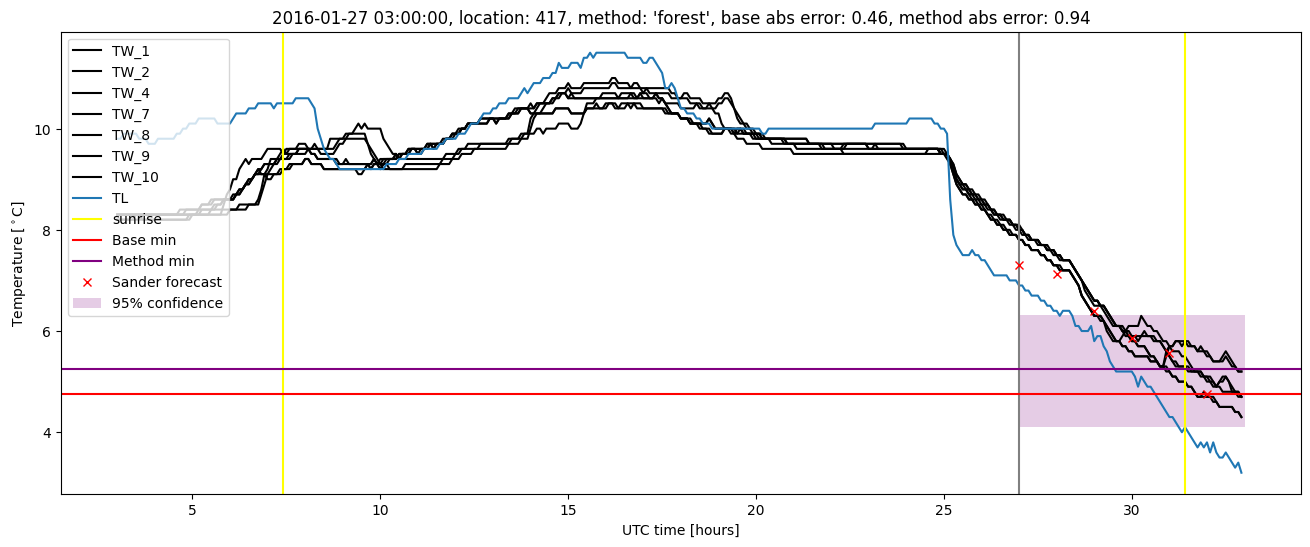
Random forest plots
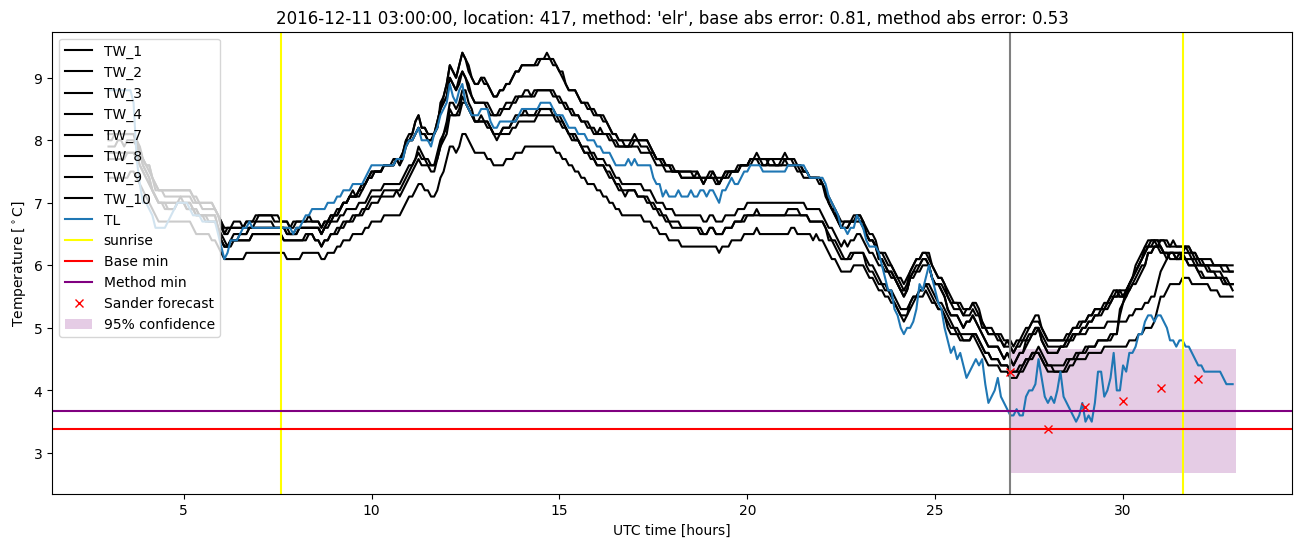
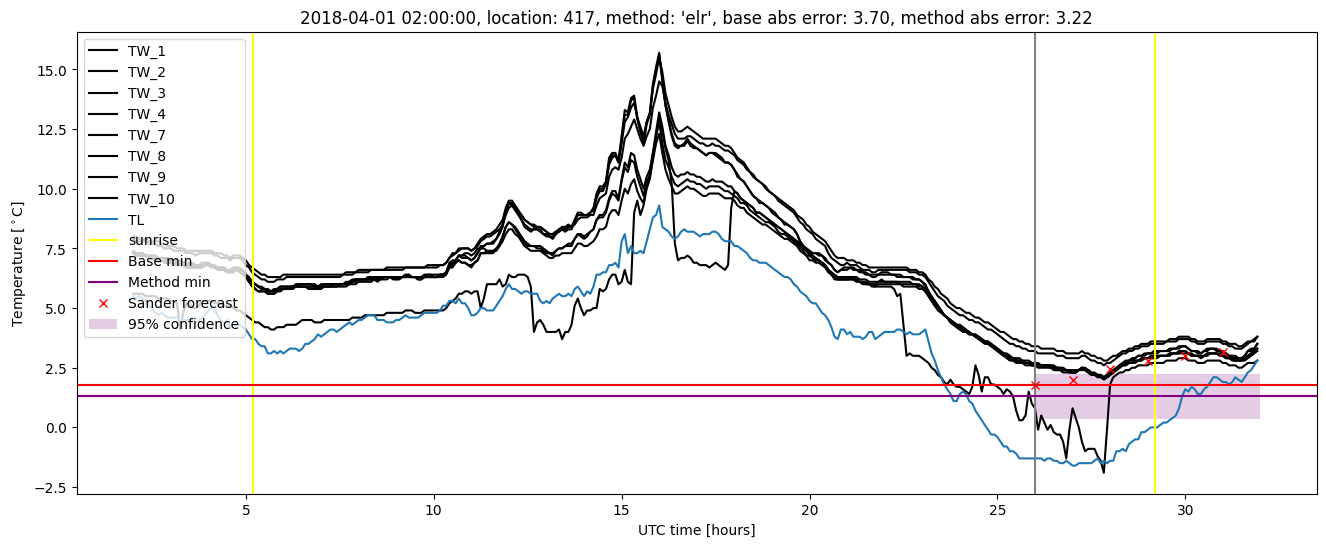
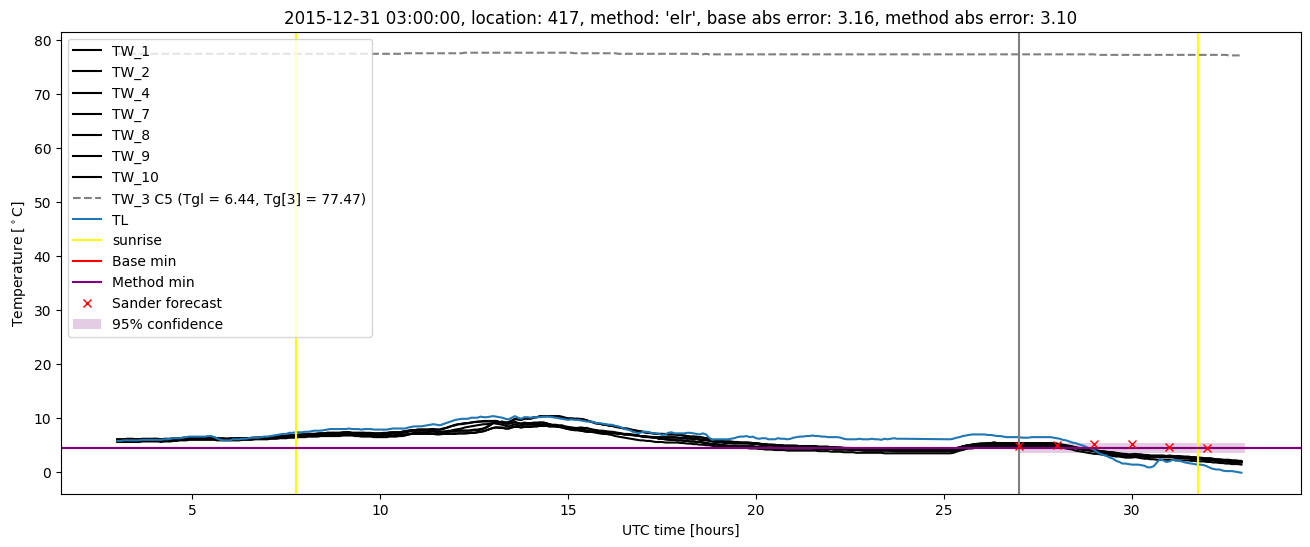
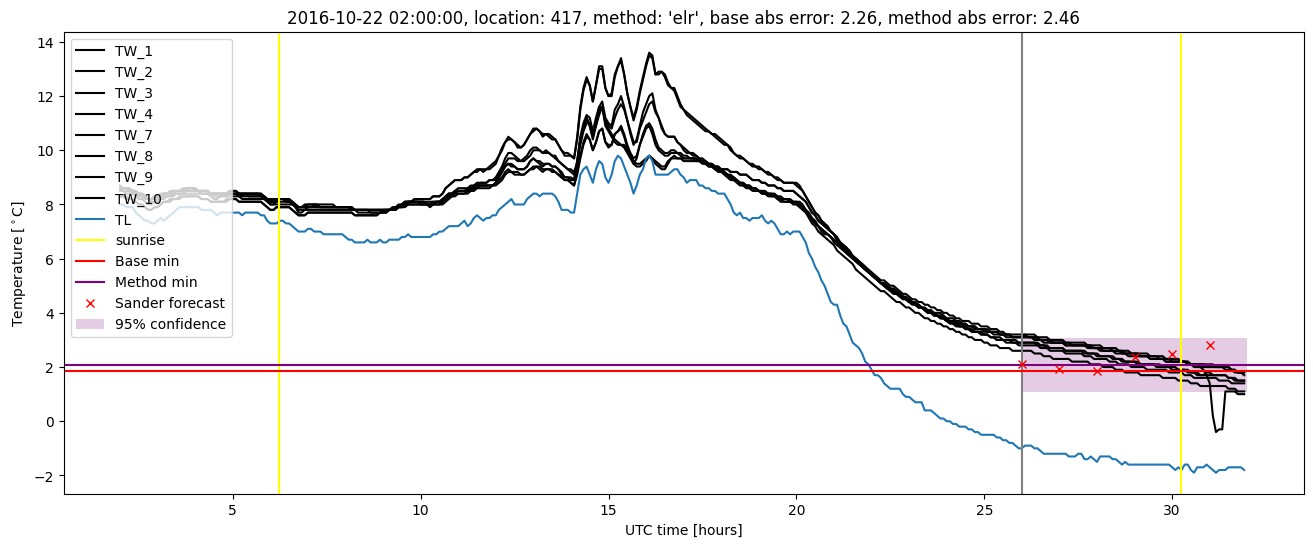
Extended logistic regression results
| names |
period |
power |
significance |
meanSquareError |
absError |
maxError |
CRPS |
IGN |
| baseline |
winter 2016 |
0.977 |
0.065 |
0.466 |
0.477 |
3.163 |
NaN |
NaN |
| elr |
winter 2016 |
0.977 |
0.032 |
0.397 |
0.451 |
3.104 |
0.506 |
2.975 |
| baseline |
winter 2017 |
1.000 |
0.022 |
0.366 |
0.424 |
2.396 |
NaN |
NaN |
| elr |
winter 2017 |
0.972 |
0.044 |
0.385 |
0.449 |
2.463 |
0.505 |
2.577 |
| baseline |
winter 2018 |
0.985 |
0.073 |
0.509 |
0.495 |
3.696 |
NaN |
NaN |
| elr |
winter 2018 |
0.978 |
0.122 |
0.450 |
0.460 |
3.216 |
0.532 |
3.356 |
| baseline |
winter 2019 |
0.985 |
0.000e+00 |
0.332 |
0.395 |
2.293 |
NaN |
NaN |
| elr |
winter 2019 |
0.993 |
0.000e+00 |
0.290 |
0.400 |
2.001 |
0.482 |
2.230 |
| baseline |
all |
0.986 |
0.044 |
0.422 |
0.449 |
3.696 |
NaN |
NaN |
| elr |
all |
0.980 |
0.059 |
0.383 |
0.441 |
3.216 |
0.507 |
2.806 |
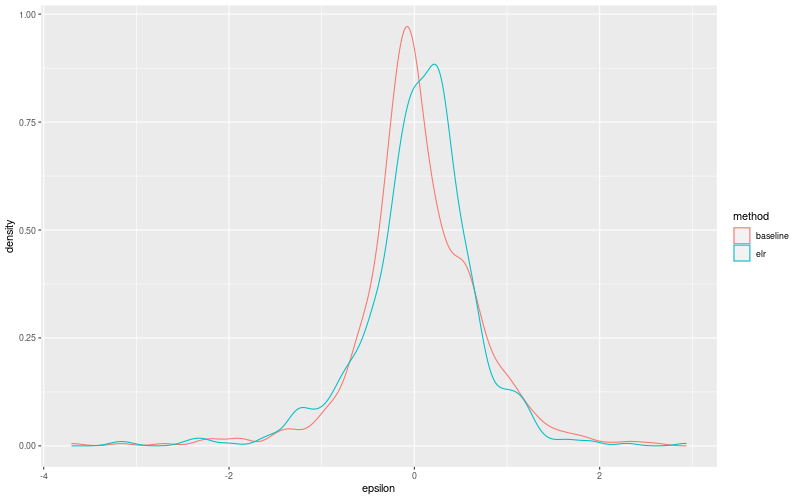
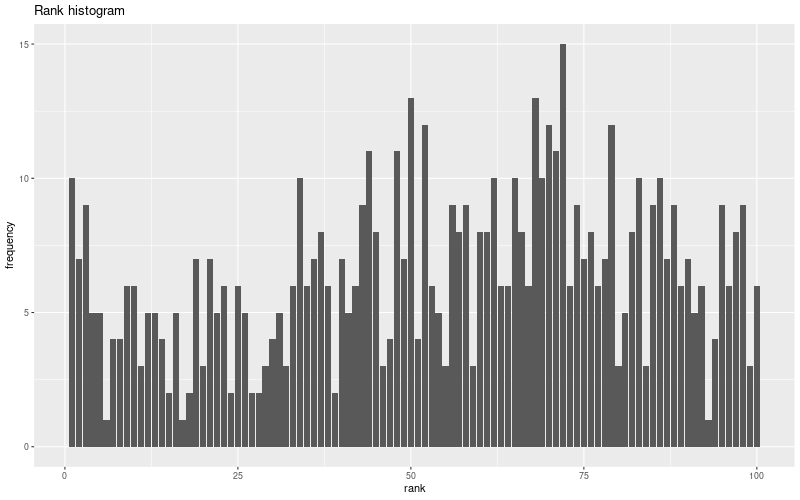
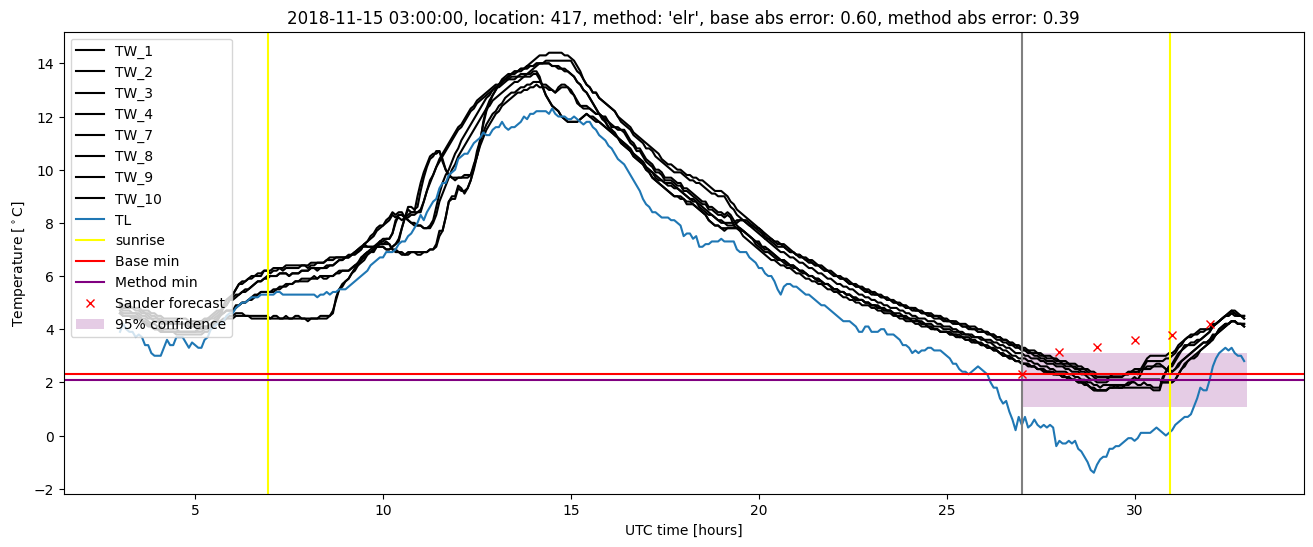
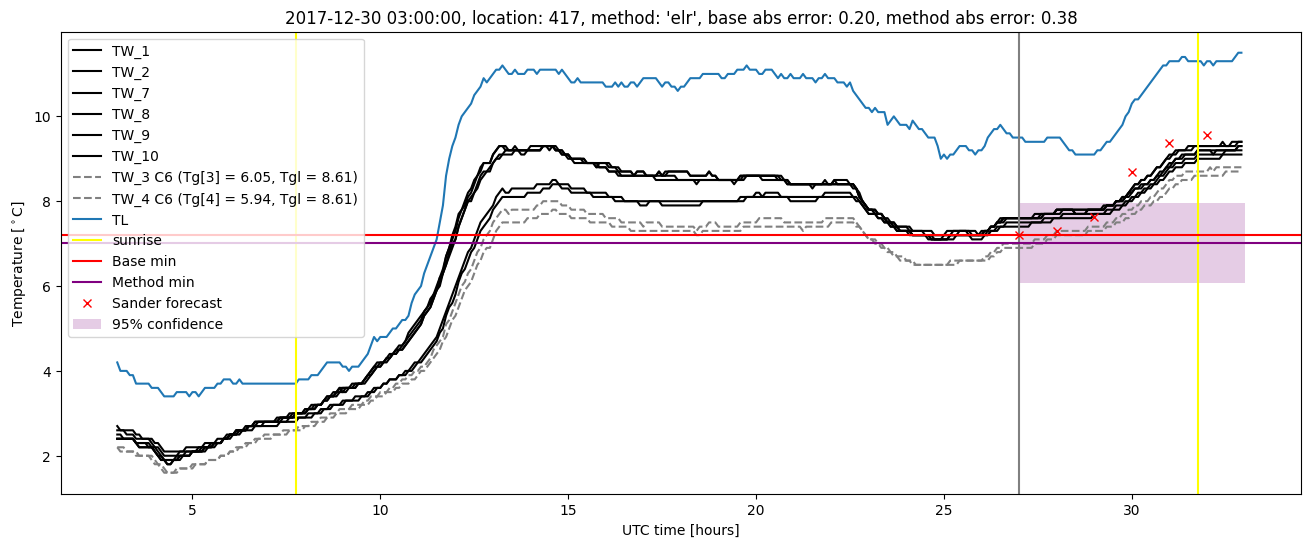
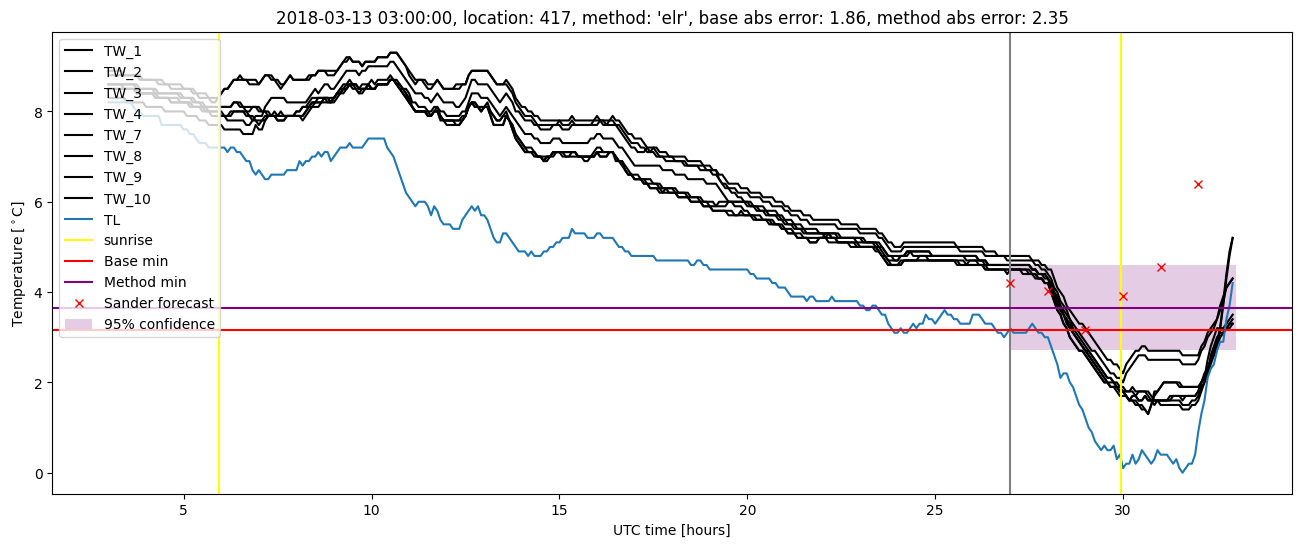
Extended logistic regression plots