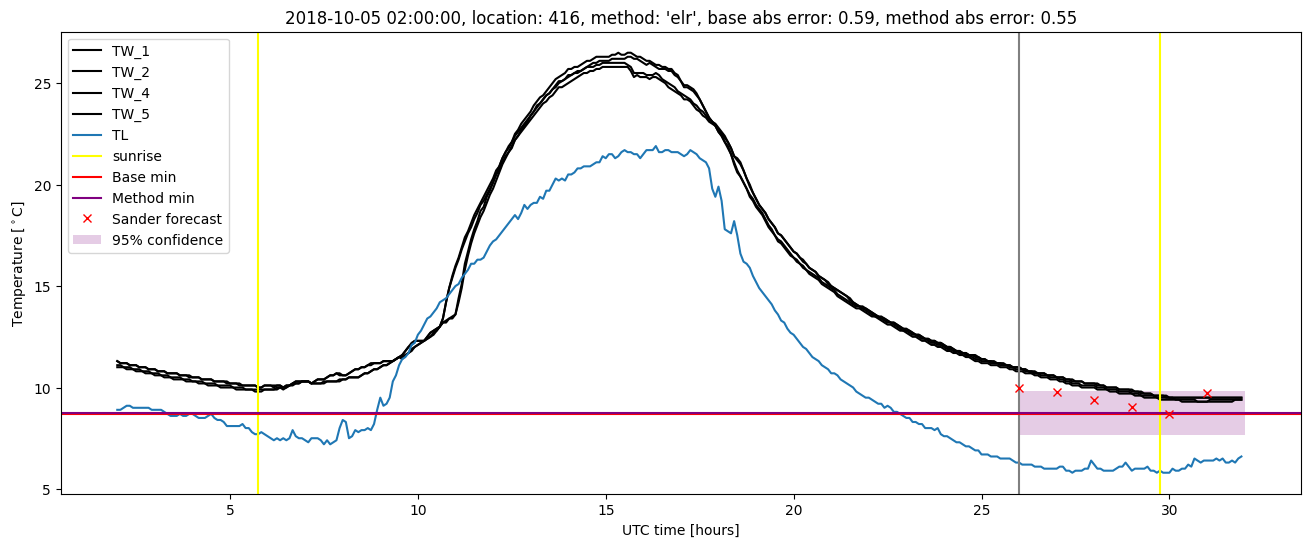
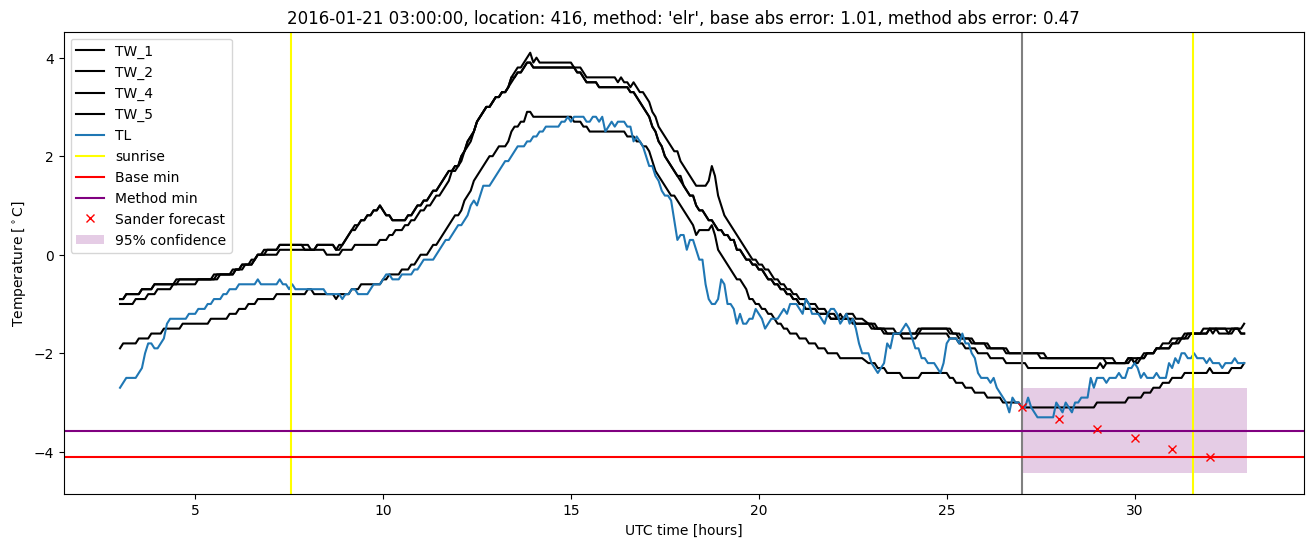
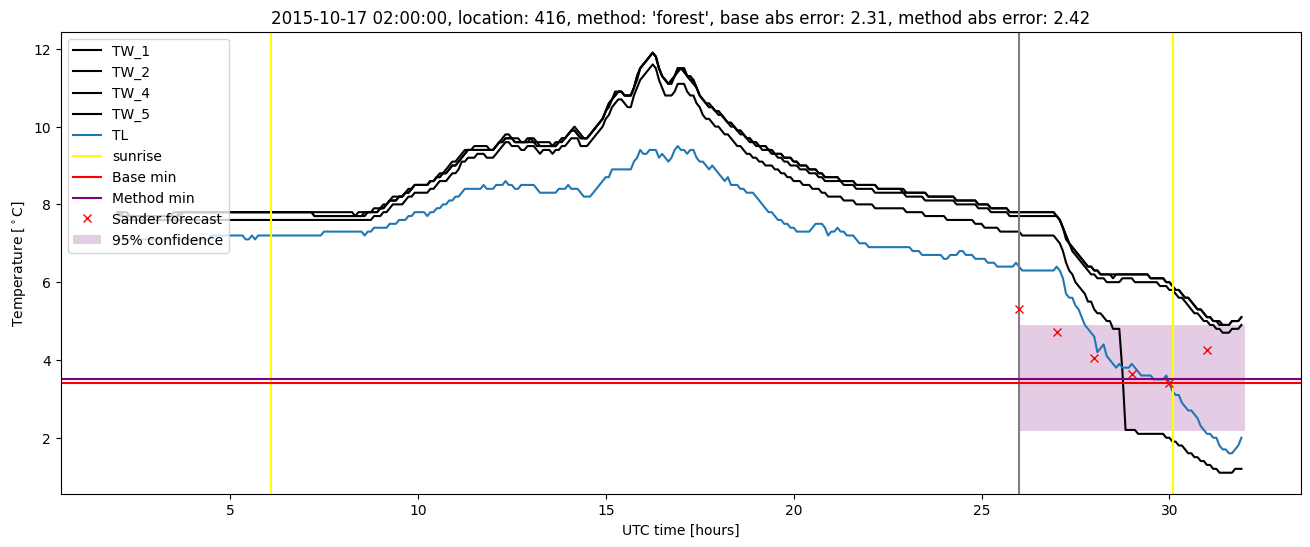
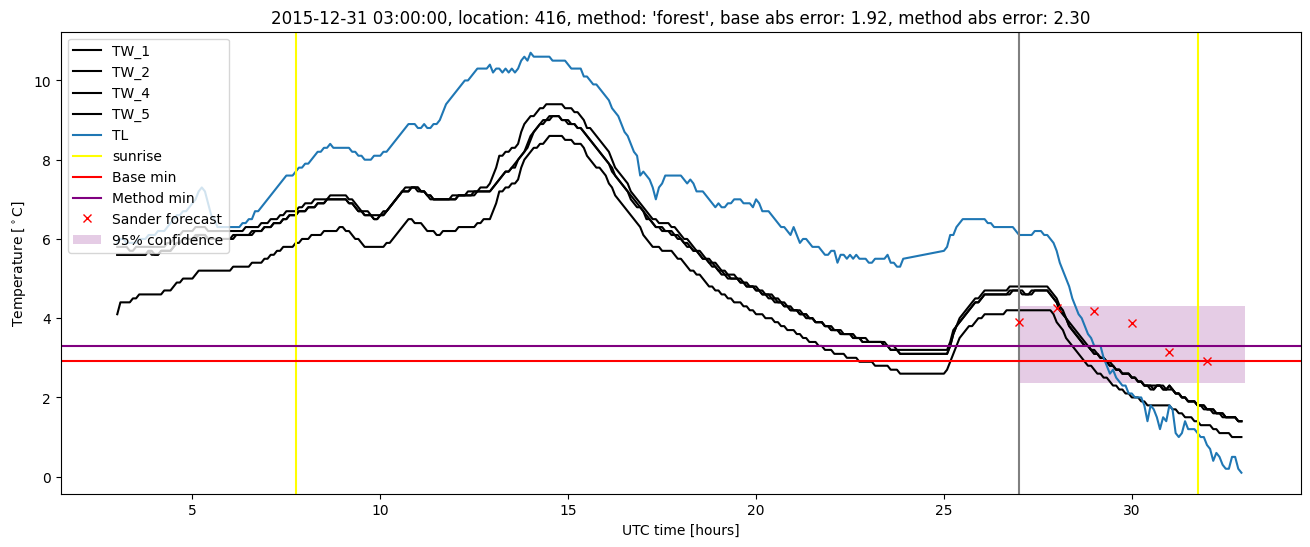
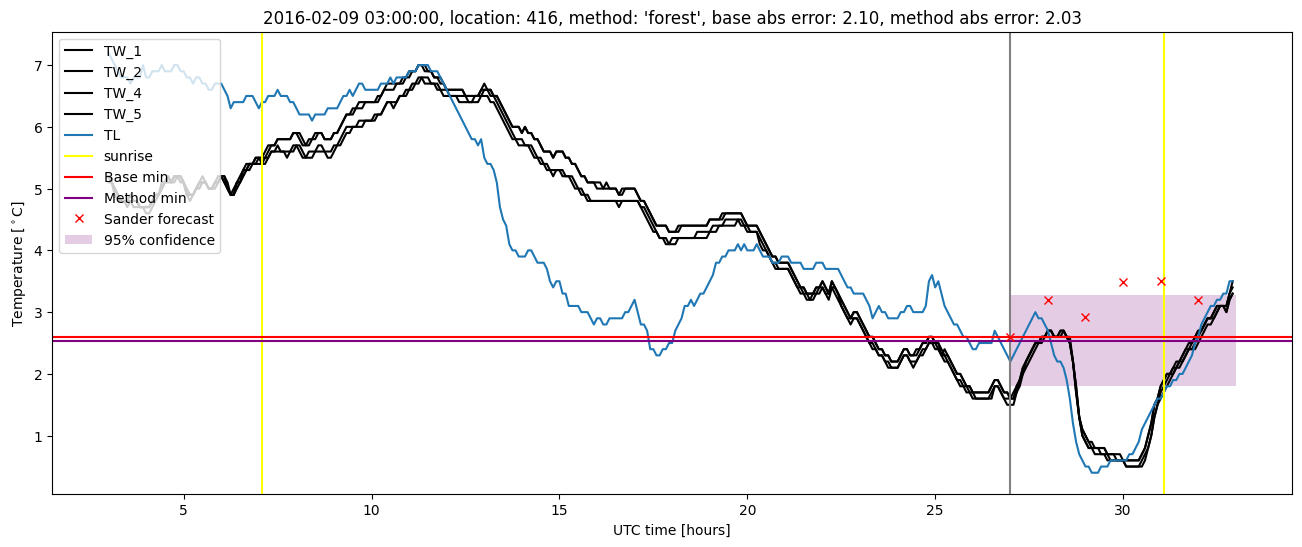
GMS location: 416
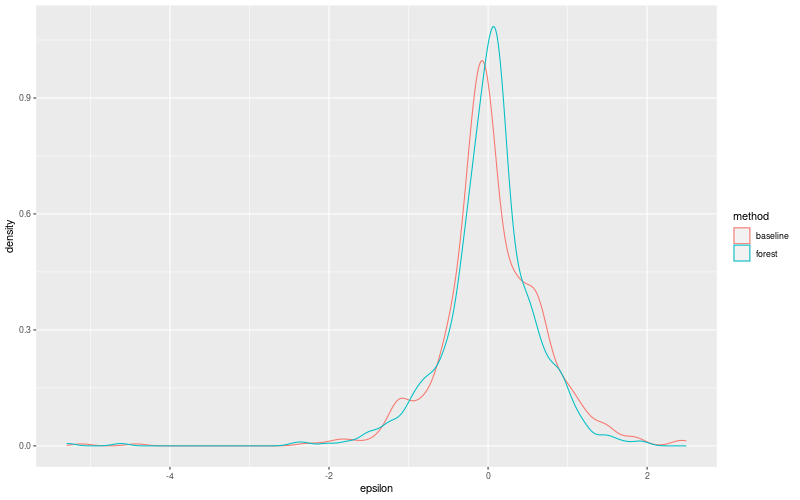
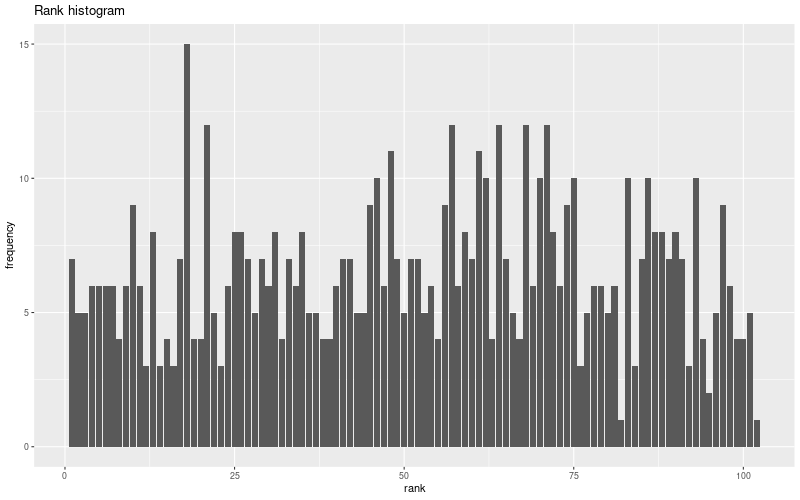
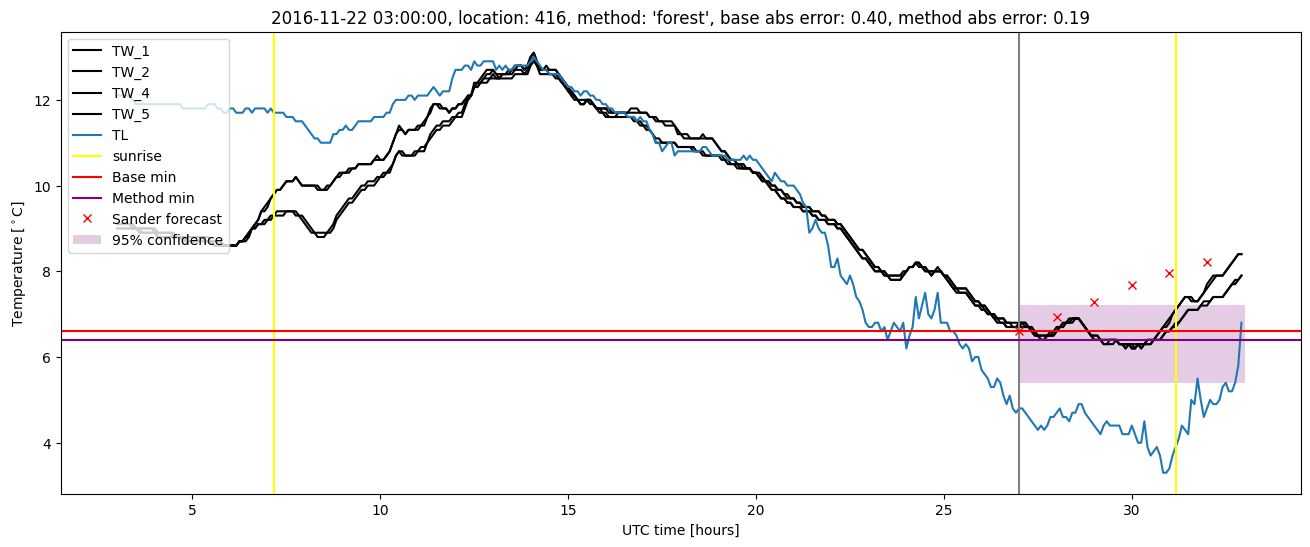
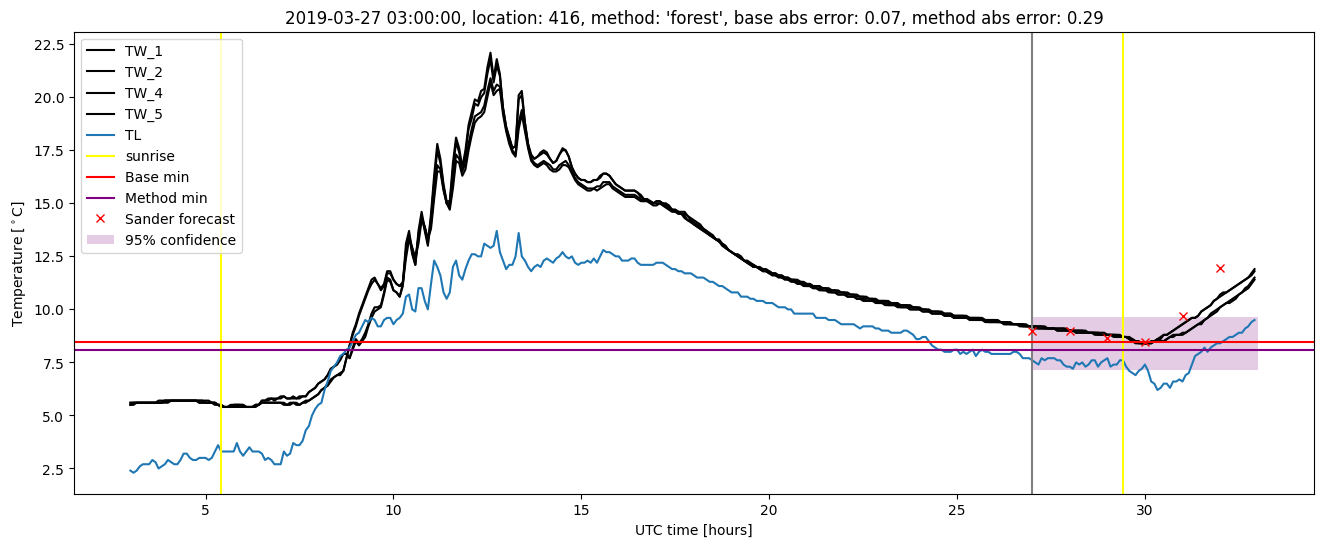
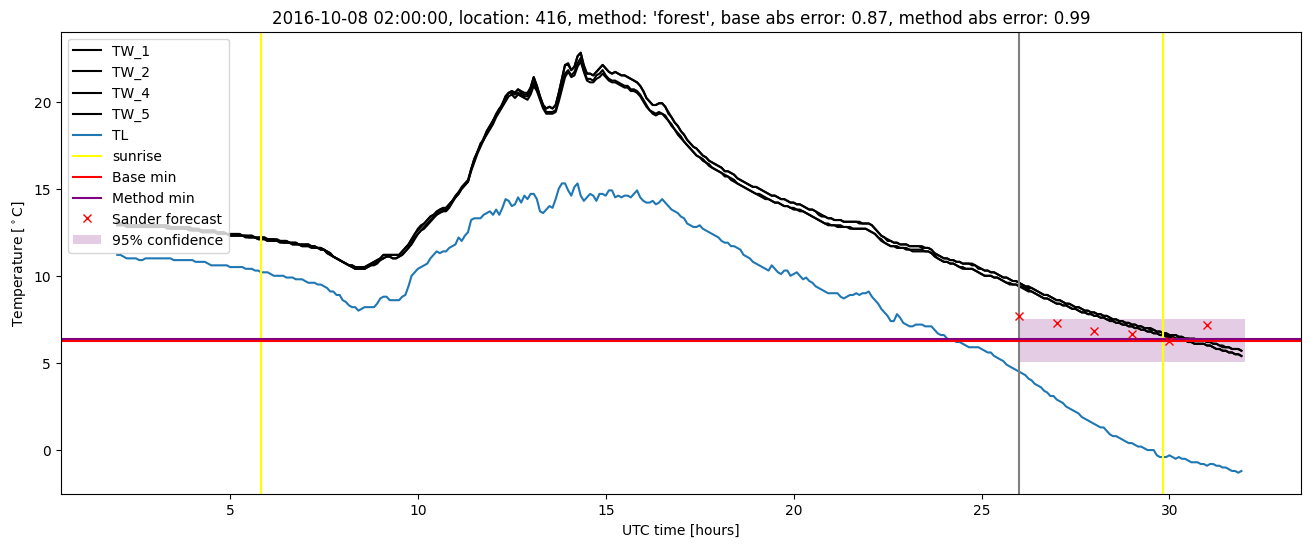
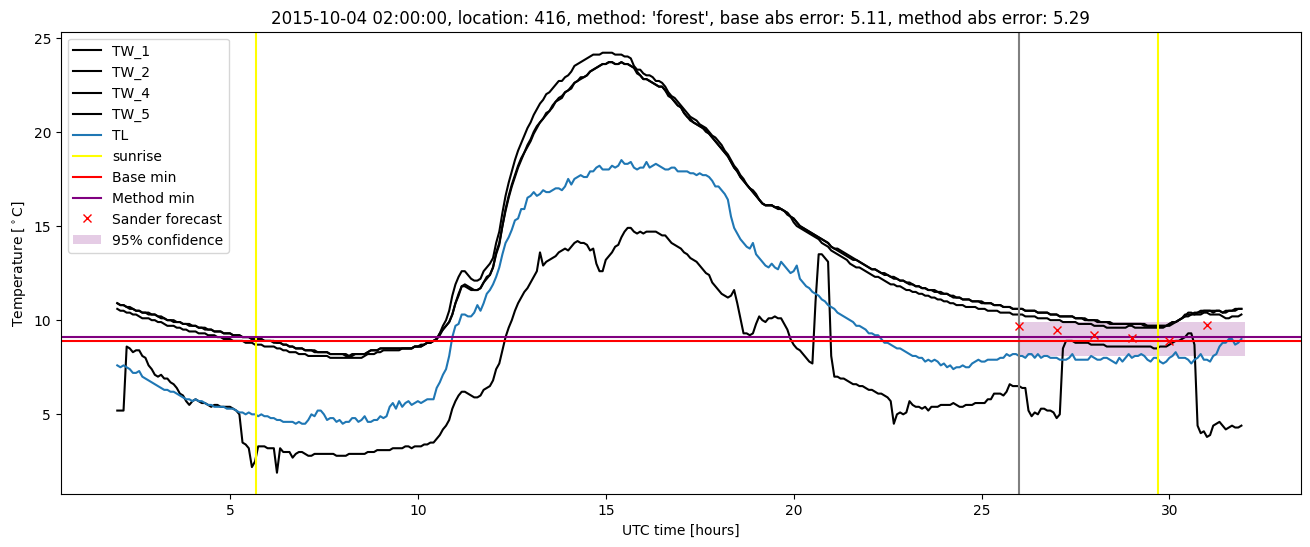
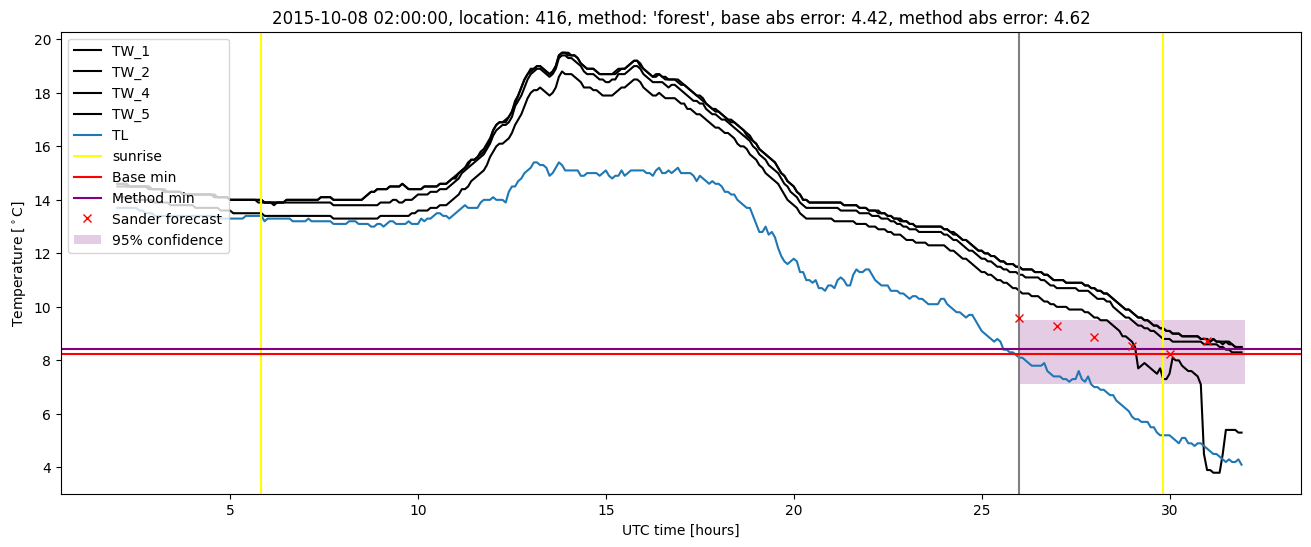
Random forest results
| names |
period |
power |
significance |
meanSquareError |
absError |
maxError |
CRPS |
IGN |
| baseline |
winter 2016 |
1.000 |
0.071 |
0.660 |
0.503 |
5.111 |
NaN |
NaN |
| forest |
winter 2016 |
0.981 |
0.036 |
0.614 |
0.459 |
5.293 |
0.461 |
5.634 |
| baseline |
winter 2017 |
0.991 |
0.026 |
0.366 |
0.431 |
2.488 |
NaN |
NaN |
| forest |
winter 2017 |
0.983 |
0.026 |
0.281 |
0.385 |
1.712 |
0.447 |
2.604 |
| baseline |
winter 2018 |
1.000 |
0.121 |
0.323 |
0.433 |
1.766 |
NaN |
NaN |
| forest |
winter 2018 |
1.000 |
0.182 |
0.256 |
0.377 |
1.563 |
0.463 |
2.401 |
| baseline |
winter 2019 |
0.986 |
0.000e+00 |
0.427 |
0.466 |
2.444 |
NaN |
NaN |
| forest |
winter 2019 |
0.986 |
0.000e+00 |
0.337 |
0.424 |
1.893 |
0.476 |
2.576 |
| baseline |
all |
0.995 |
0.061 |
0.453 |
0.460 |
5.111 |
NaN |
NaN |
| forest |
all |
0.987 |
0.070 |
0.382 |
0.413 |
5.293 |
0.462 |
3.406 |
Random forest plots
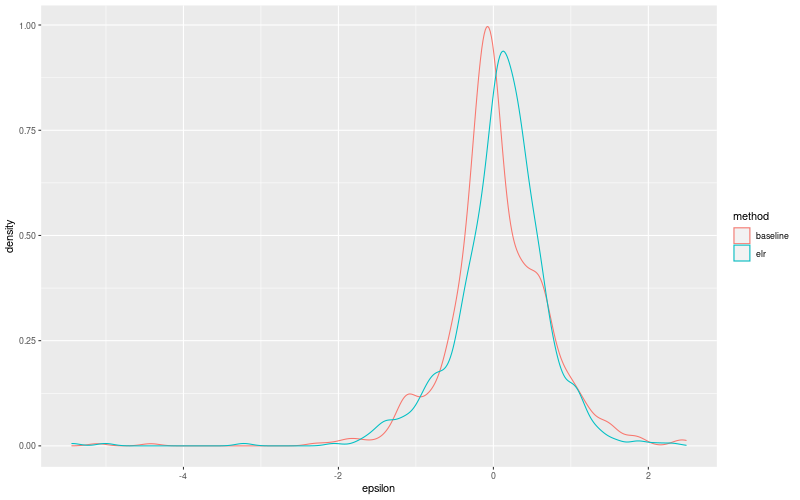
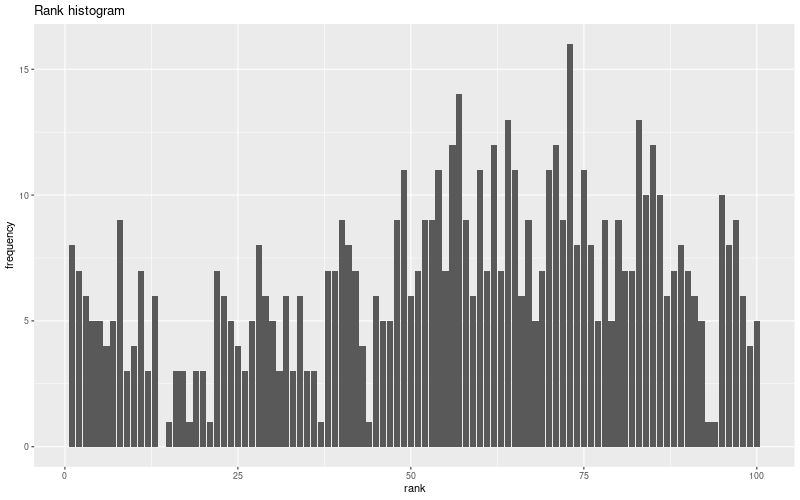
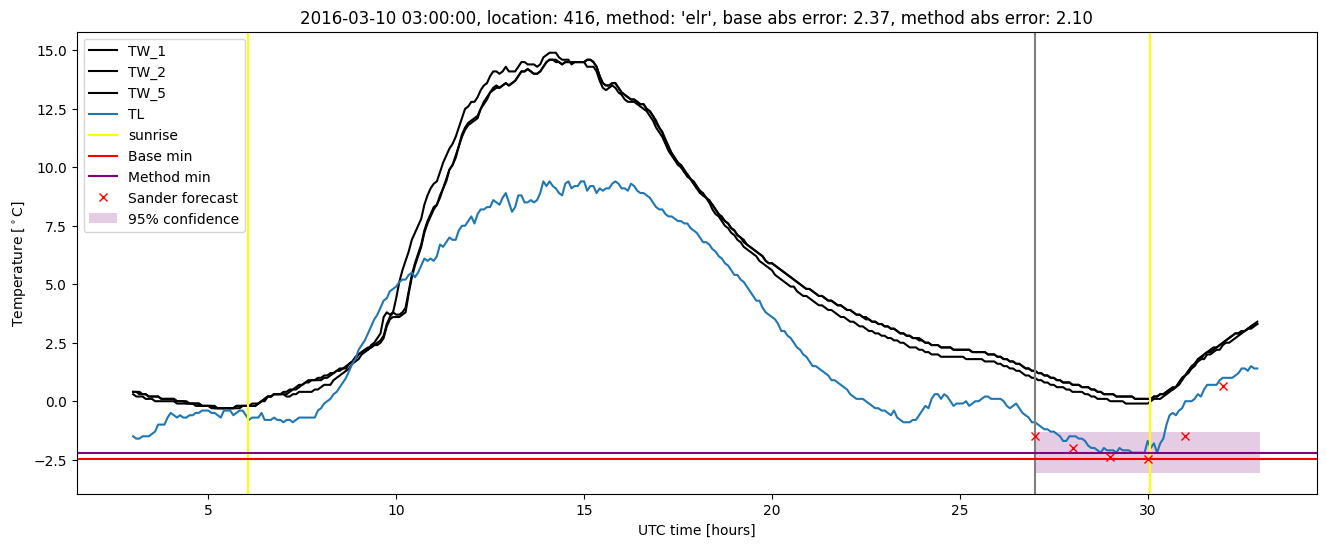
Extended logistic regression results
| names |
period |
power |
significance |
meanSquareError |
absError |
maxError |
CRPS |
IGN |
| baseline |
winter 2016 |
1.000 |
0.071 |
0.660 |
0.503 |
5.111 |
NaN |
NaN |
| elr |
winter 2016 |
0.981 |
0.036 |
0.661 |
0.485 |
5.440 |
0.552 |
4.815 |
| baseline |
winter 2017 |
0.991 |
0.026 |
0.366 |
0.431 |
2.488 |
NaN |
NaN |
| elr |
winter 2017 |
0.947 |
0.051 |
0.339 |
0.440 |
2.313 |
0.491 |
2.049 |
| baseline |
winter 2018 |
1.000 |
0.121 |
0.323 |
0.433 |
1.766 |
NaN |
NaN |
| elr |
winter 2018 |
0.993 |
0.182 |
0.290 |
0.410 |
1.746 |
0.523 |
2.166 |
| baseline |
winter 2019 |
0.986 |
0.000e+00 |
0.427 |
0.466 |
2.444 |
NaN |
NaN |
| elr |
winter 2019 |
0.993 |
0.000e+00 |
0.352 |
0.444 |
1.887 |
0.531 |
2.228 |
| baseline |
all |
0.995 |
0.061 |
0.453 |
0.460 |
5.111 |
NaN |
NaN |
| elr |
all |
0.980 |
0.079 |
0.421 |
0.446 |
5.440 |
0.526 |
2.905 |
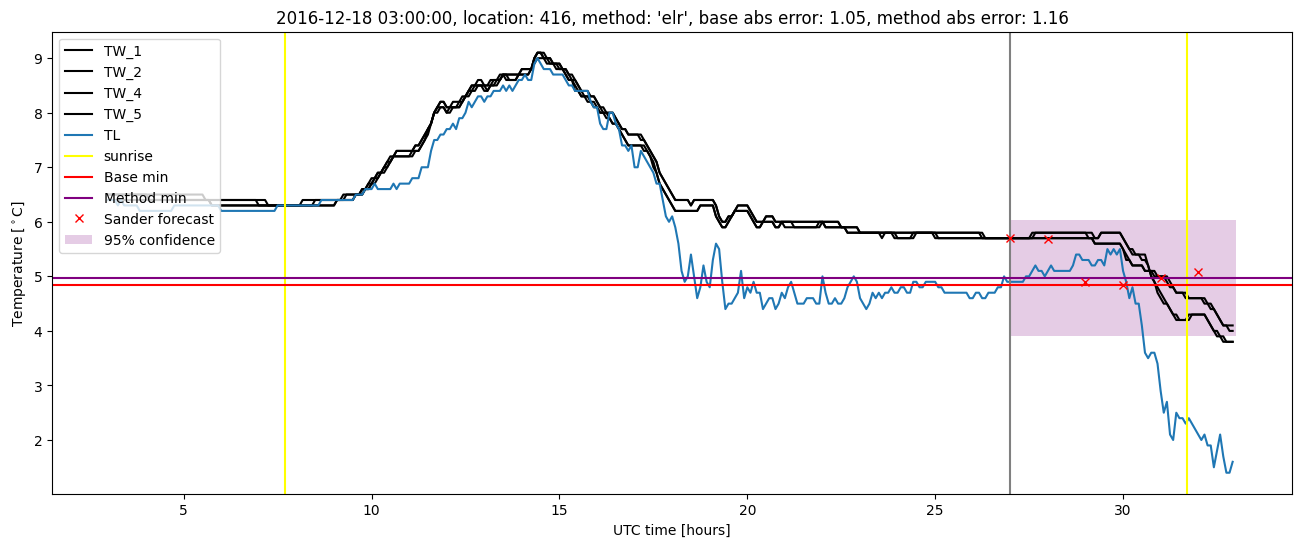
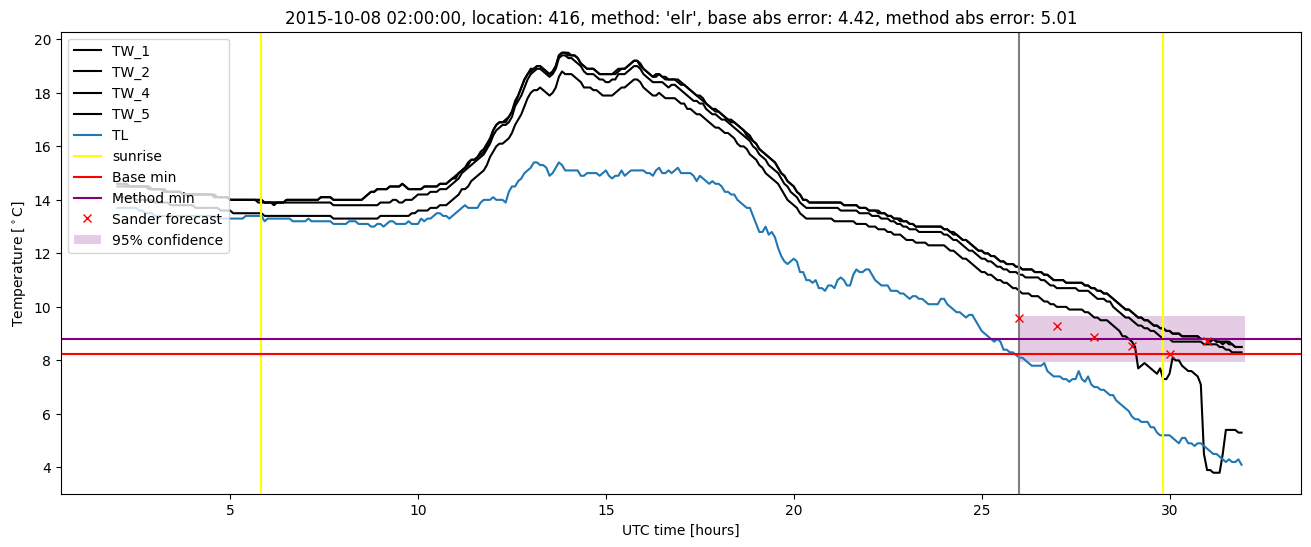
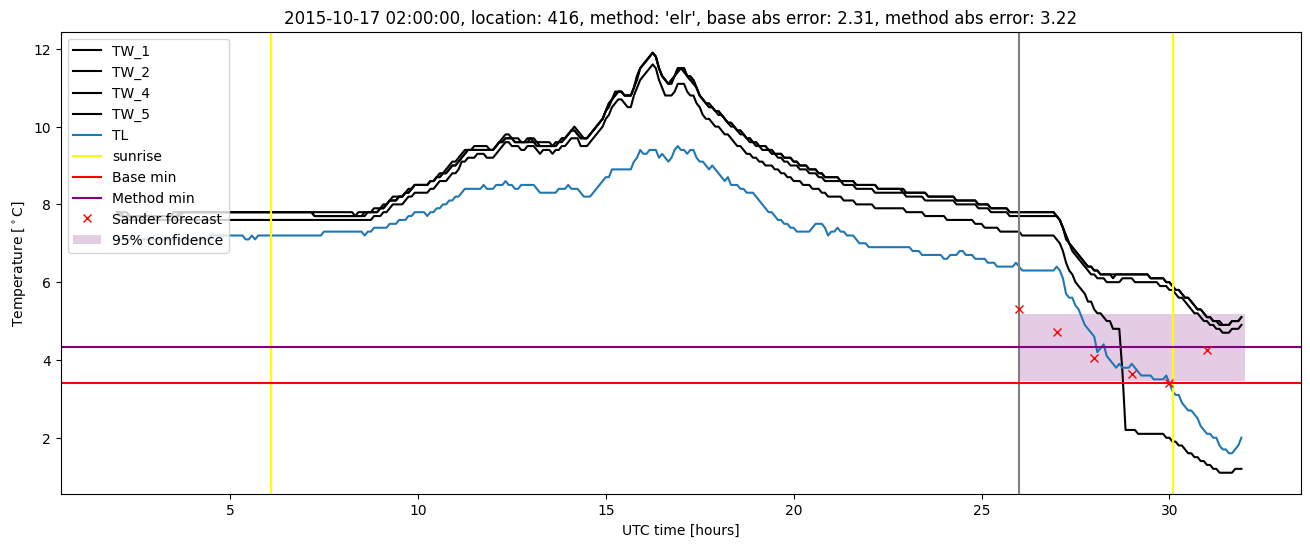
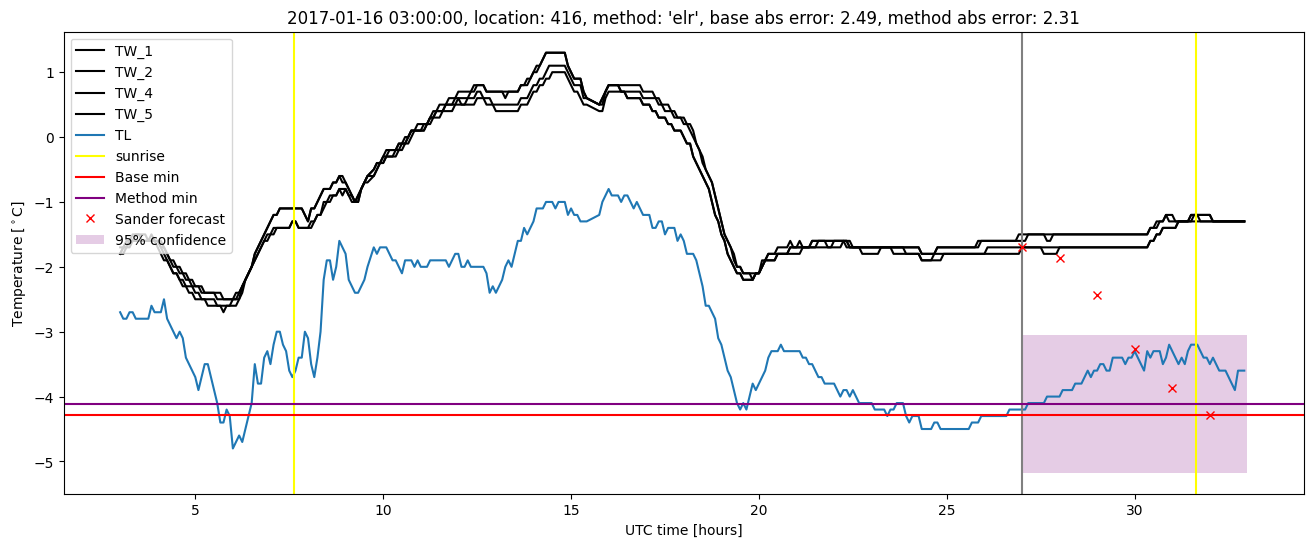
Extended logistic regression plots