GMS location: 415
Random forest results
| names |
period |
power |
significance |
meanSquareError |
absError |
maxError |
CRPS |
IGN |
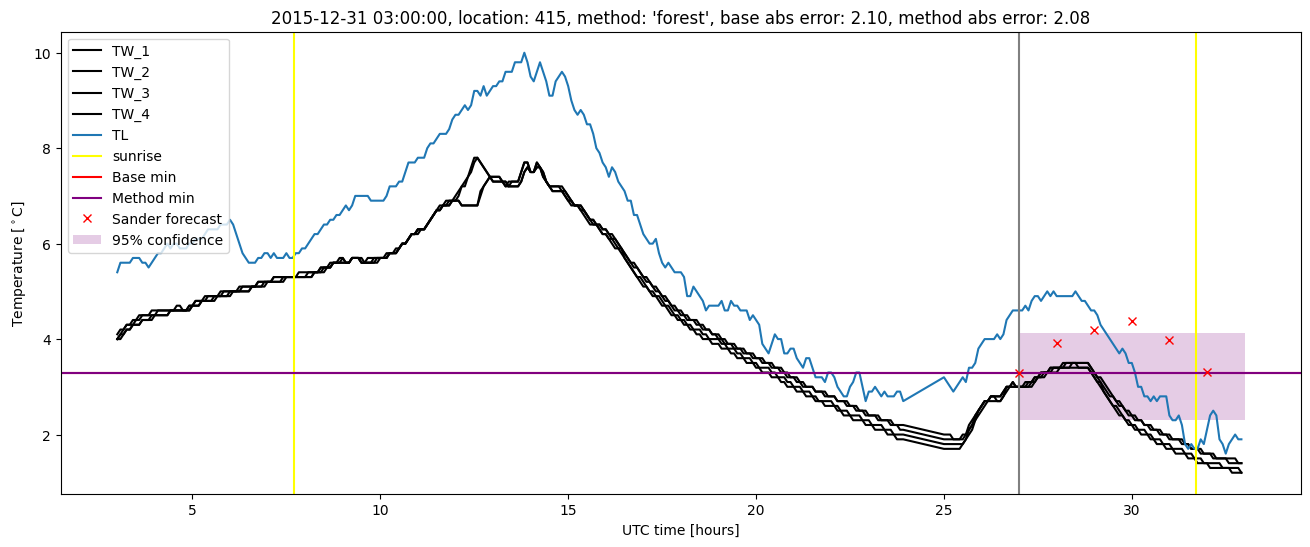
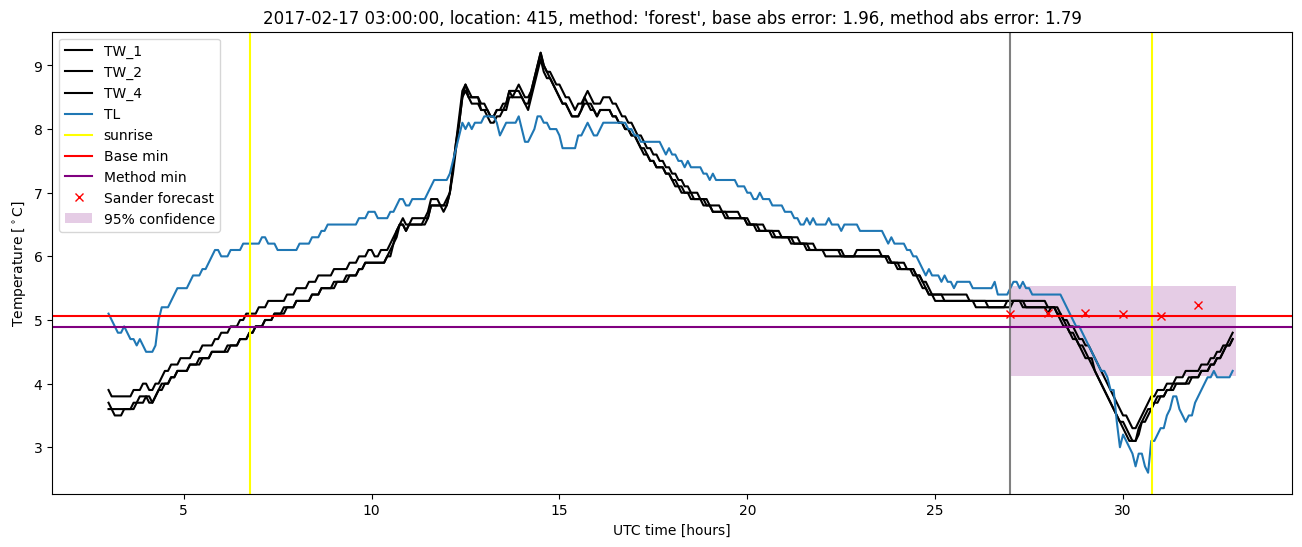
| baseline |
winter 2016 |
1.000 |
0.069 |
0.289 |
0.419 |
2.100 |
NaN |
NaN |
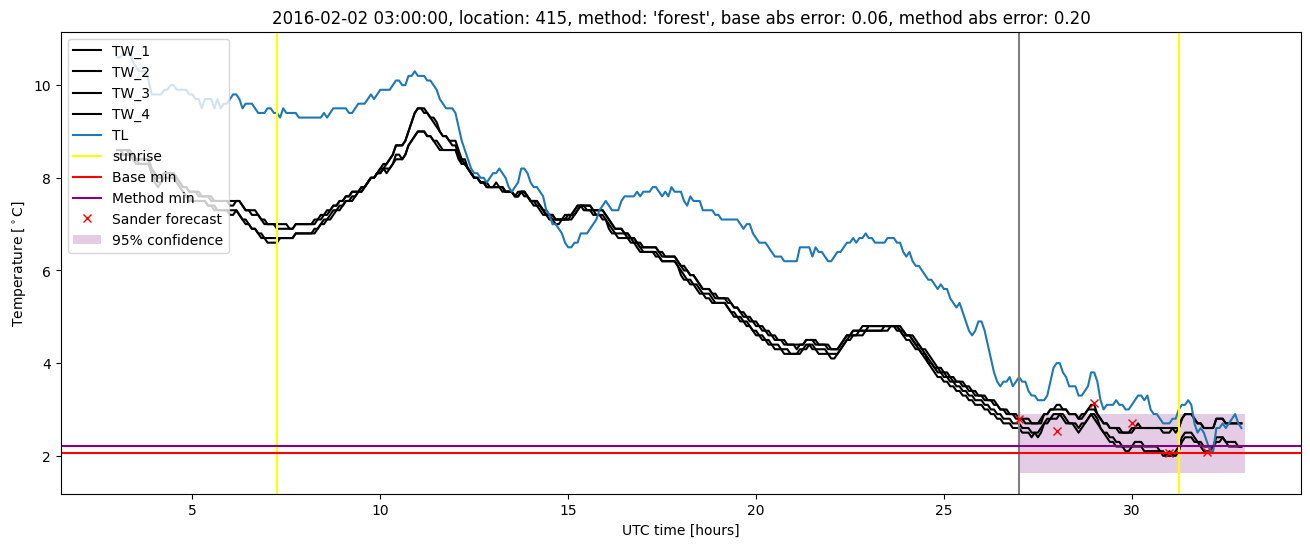
| forest |
winter 2016 |
1.000 |
0.000e+00 |
0.226 |
0.351 |
2.084 |
0.479 |
5.553 |
| baseline |
winter 2017 |
0.981 |
0.043 |
0.398 |
0.433 |
2.829 |
NaN |
NaN |
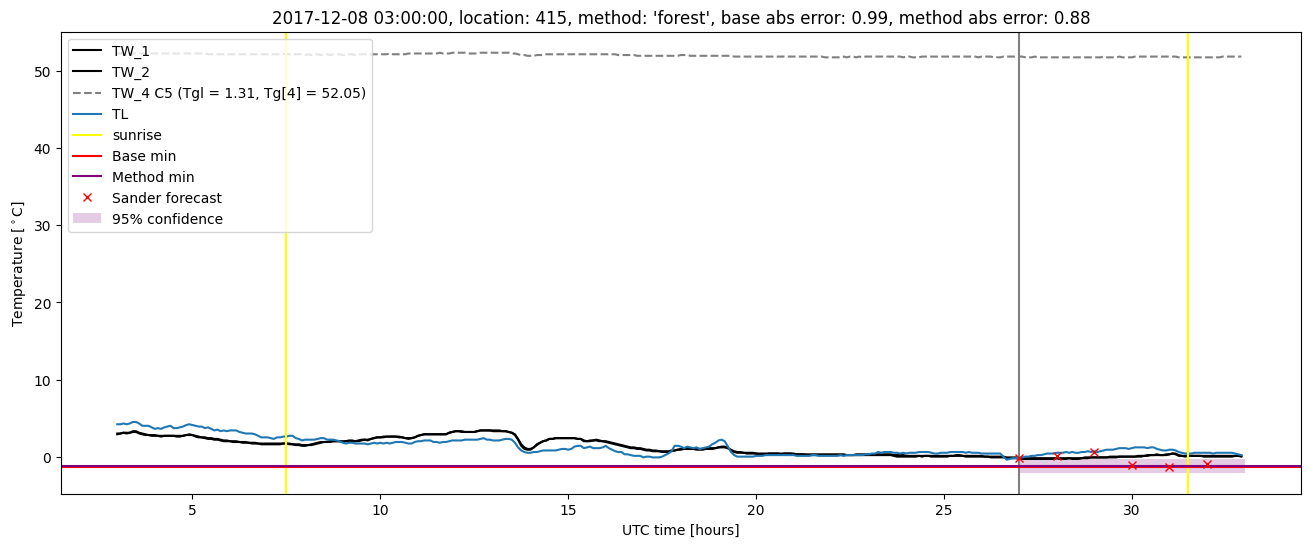
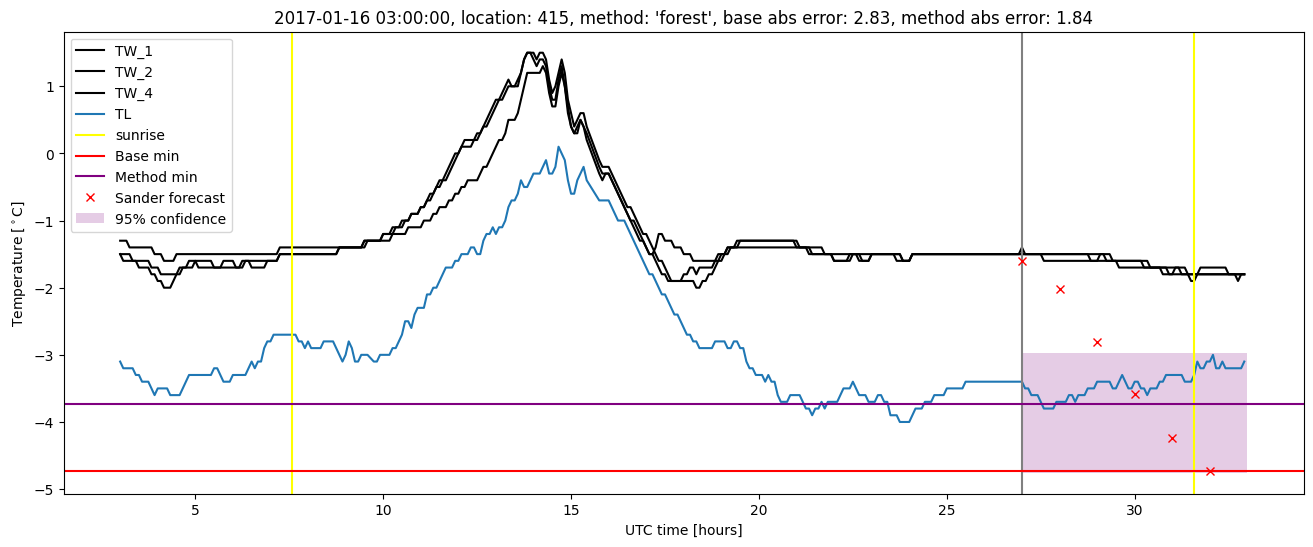
| forest |
winter 2017 |
0.981 |
0.043 |
0.254 |
0.361 |
1.839 |
0.452 |
3.872 |
| baseline |
winter 2018 |
0.969 |
0.111 |
0.346 |
0.424 |
2.280 |
NaN |
NaN |
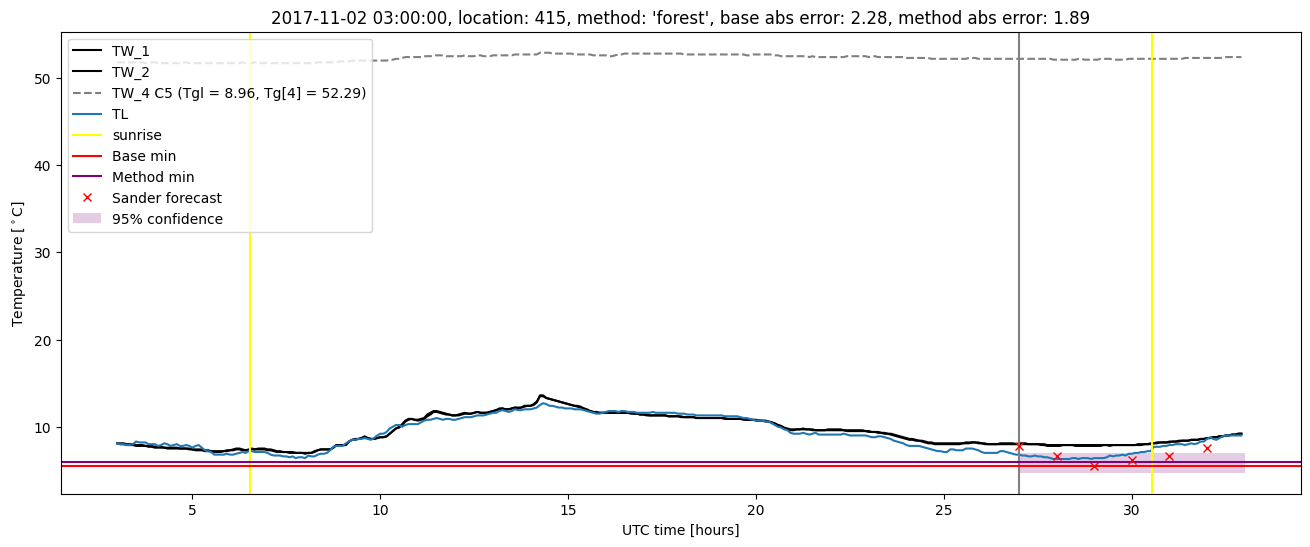
| forest |
winter 2018 |
0.985 |
0.056 |
0.257 |
0.368 |
1.889 |
0.469 |
4.073 |
| baseline |
winter 2019 |
0.965 |
0.000e+00 |
0.369 |
0.432 |
2.531 |
NaN |
NaN |
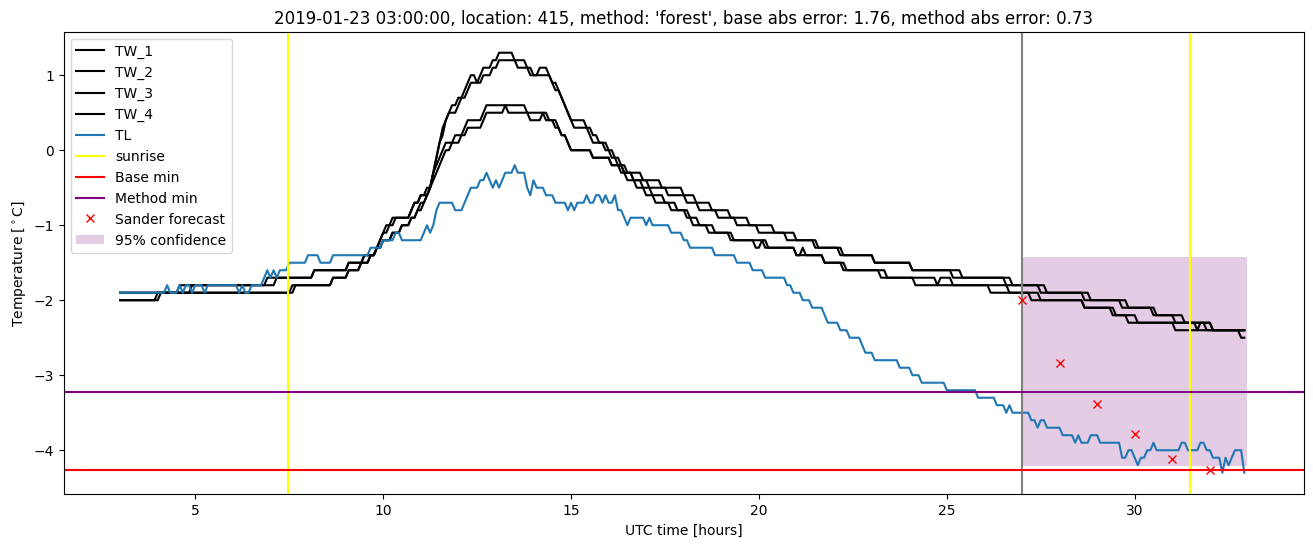
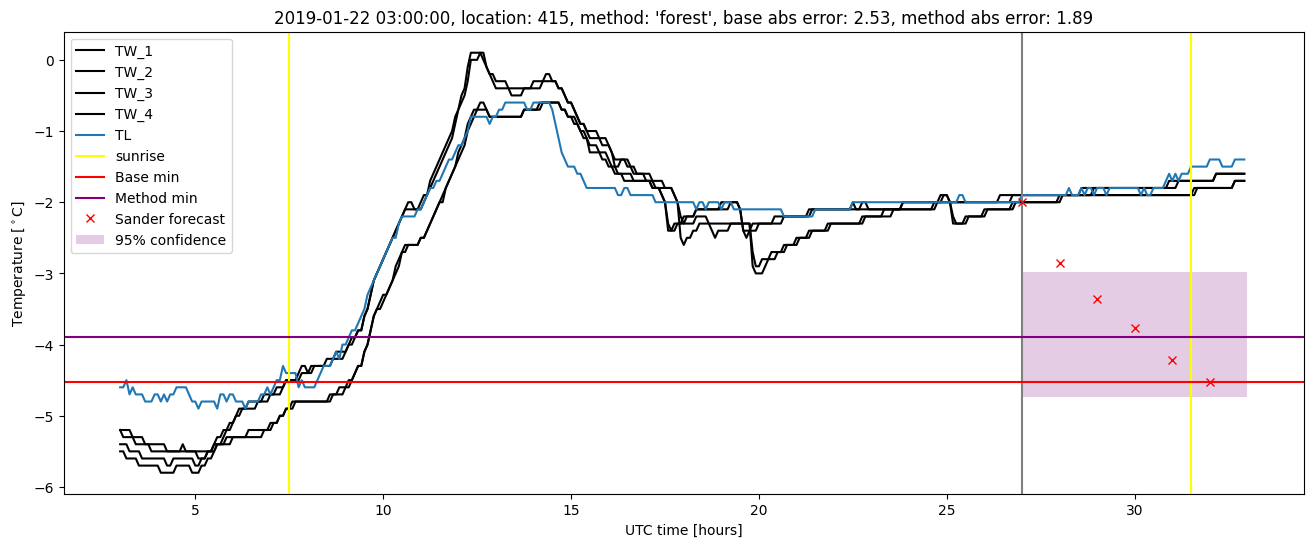
| forest |
winter 2019 |
0.986 |
0.000e+00 |
0.254 |
0.356 |
1.889 |
0.462 |
3.540 |
| baseline |
all |
0.979 |
0.063 |
0.348 |
0.427 |
2.829 |
NaN |
NaN |
| forest |
all |
0.989 |
0.032 |
0.247 |
0.359 |
2.084 |
0.466 |
4.305 |
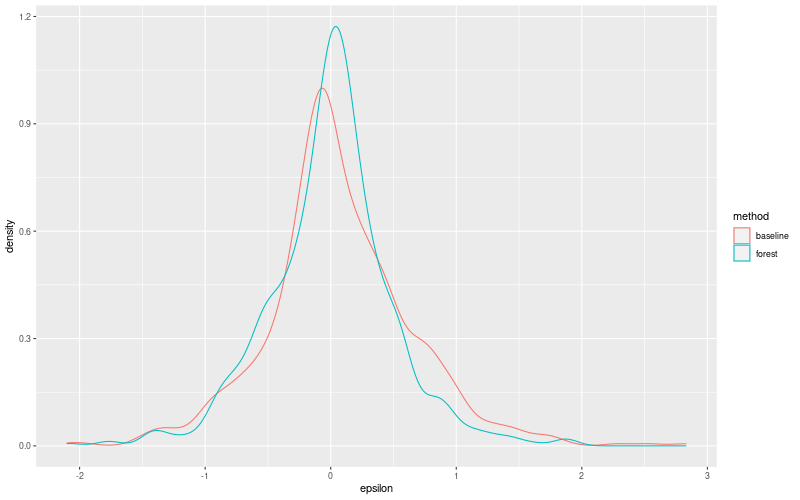
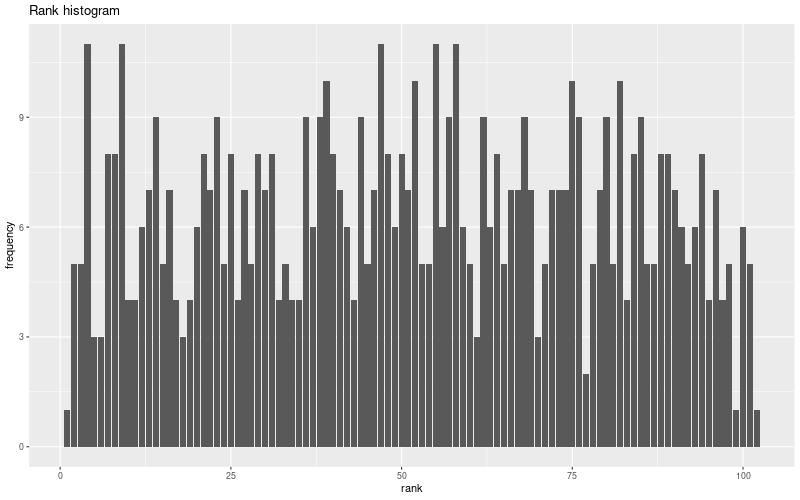
Random forest plots
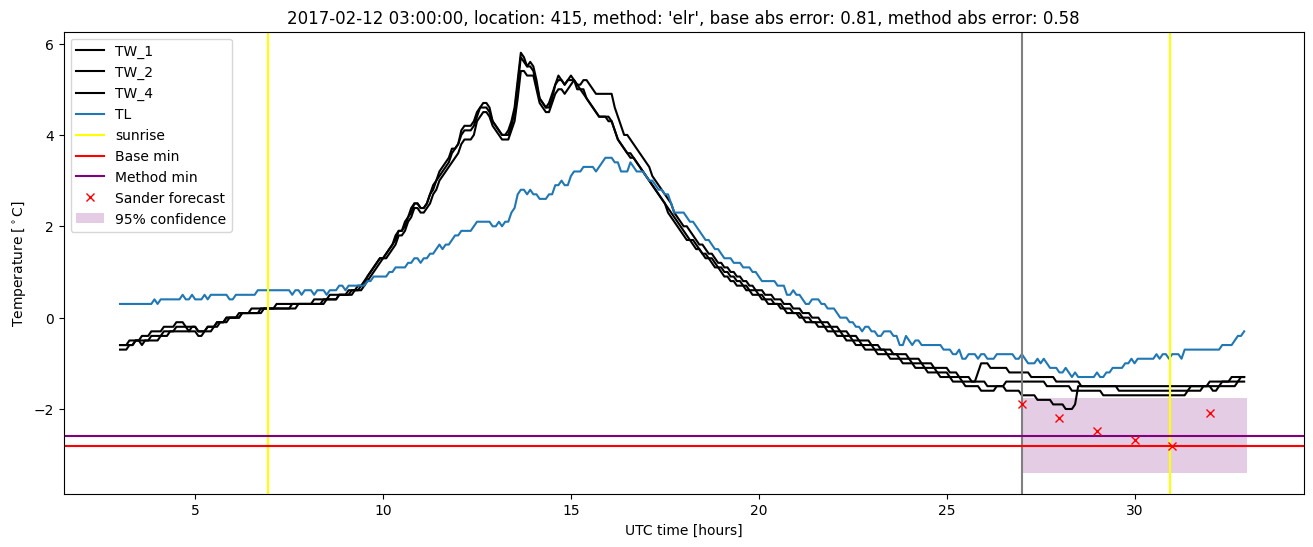
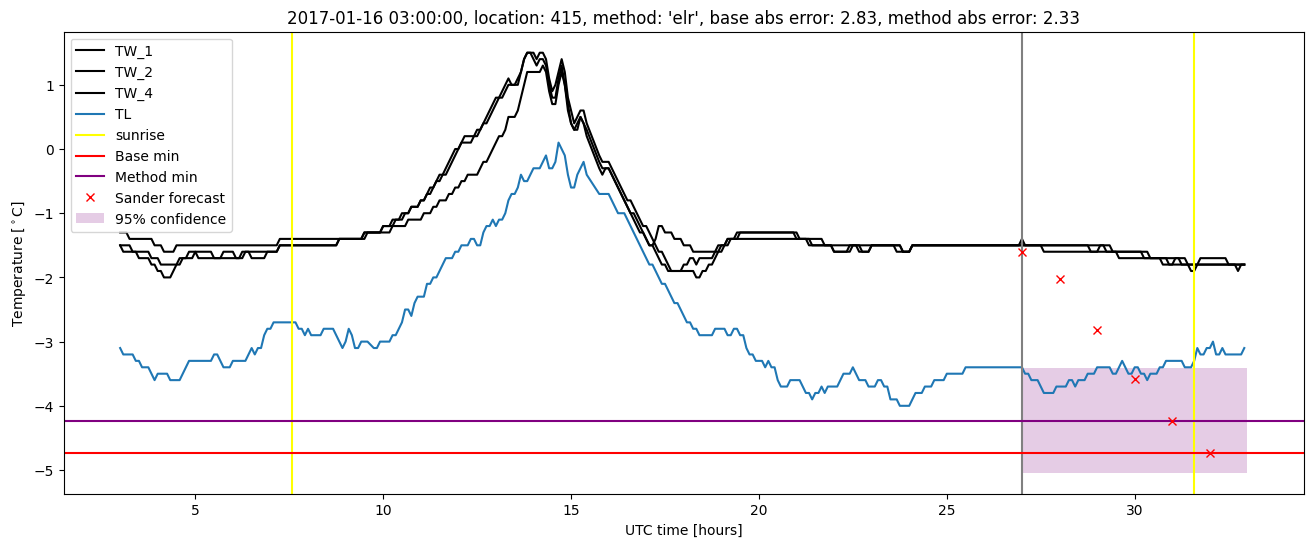
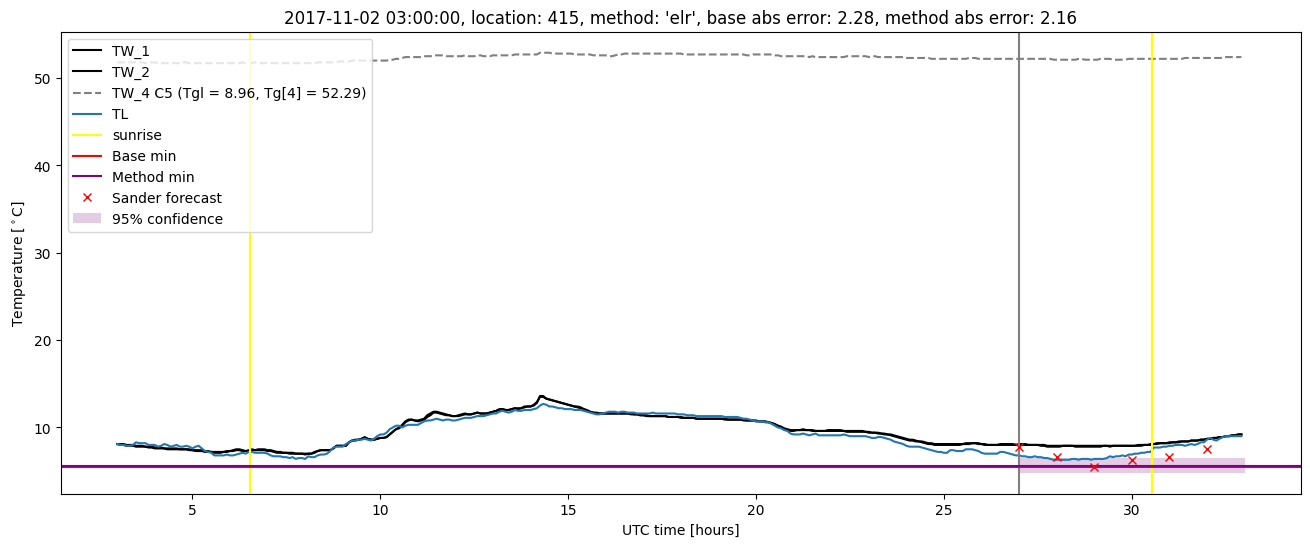
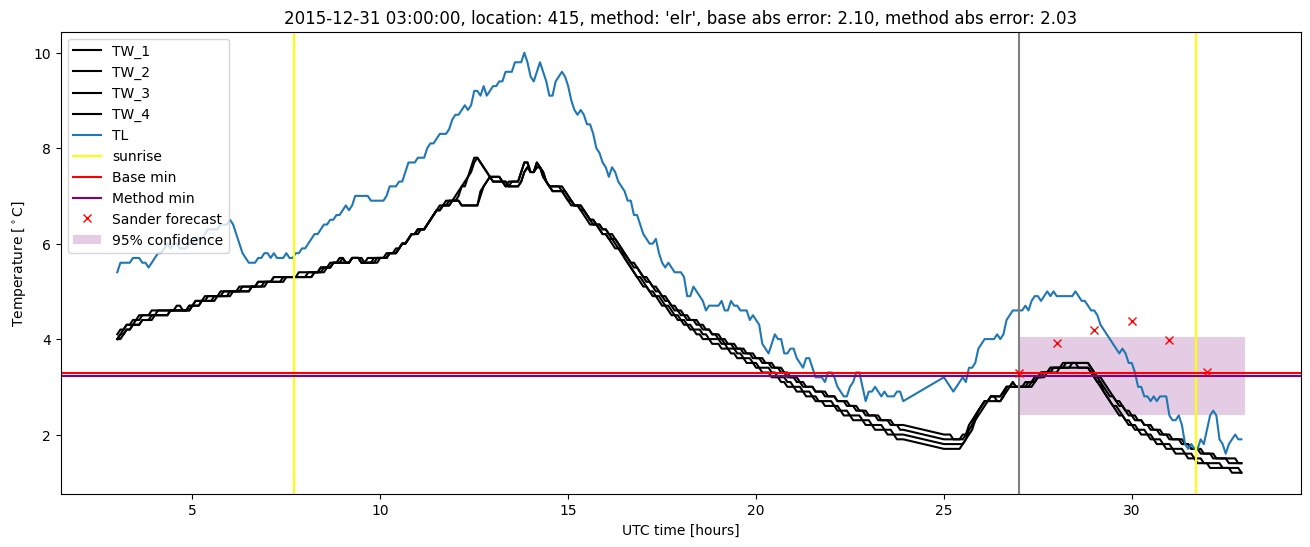
Extended logistic regression results
| names |
period |
power |
significance |
meanSquareError |
absError |
maxError |
CRPS |
IGN |
| baseline |
winter 2016 |
1.000 |
0.069 |
0.289 |
0.419 |
2.100 |
NaN |
NaN |
| elr |
winter 2016 |
0.993 |
0.000e+00 |
0.274 |
0.411 |
2.031 |
0.528 |
5.335 |
| baseline |
winter 2017 |
0.981 |
0.043 |
0.398 |
0.433 |
2.829 |
NaN |
NaN |
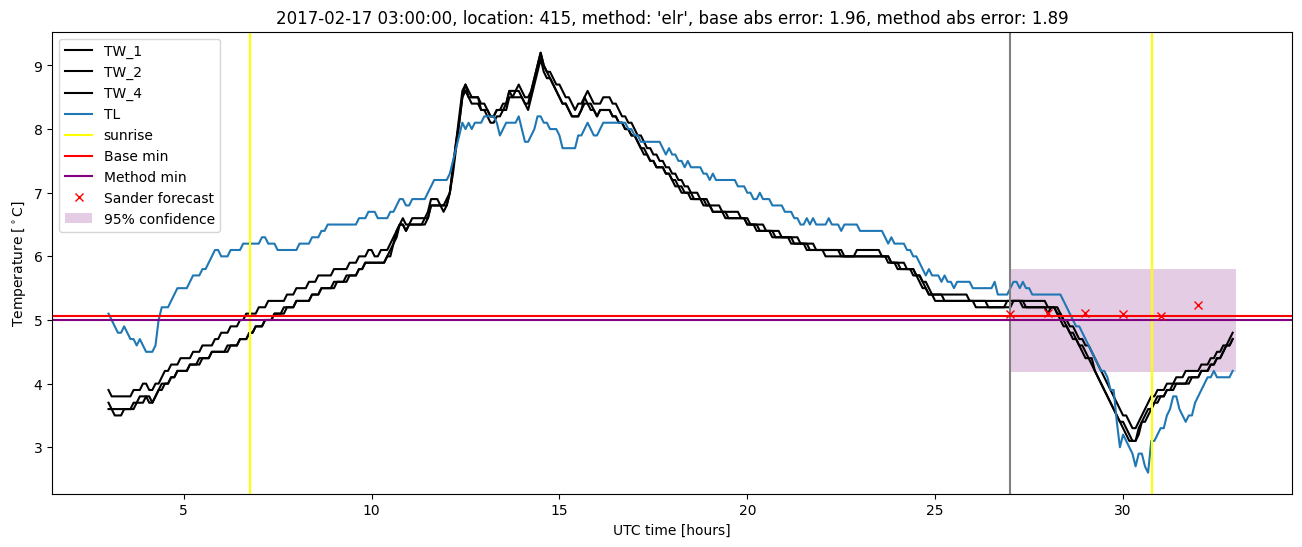
| elr |
winter 2017 |
0.991 |
0.021 |
0.316 |
0.399 |
2.333 |
0.515 |
5.163 |
| baseline |
winter 2018 |
0.969 |
0.111 |
0.346 |
0.424 |
2.280 |
NaN |
NaN |
| elr |
winter 2018 |
0.985 |
0.056 |
0.260 |
0.385 |
2.157 |
0.536 |
5.247 |
| baseline |
winter 2019 |
0.965 |
0.000e+00 |
0.369 |
0.432 |
2.531 |
NaN |
NaN |
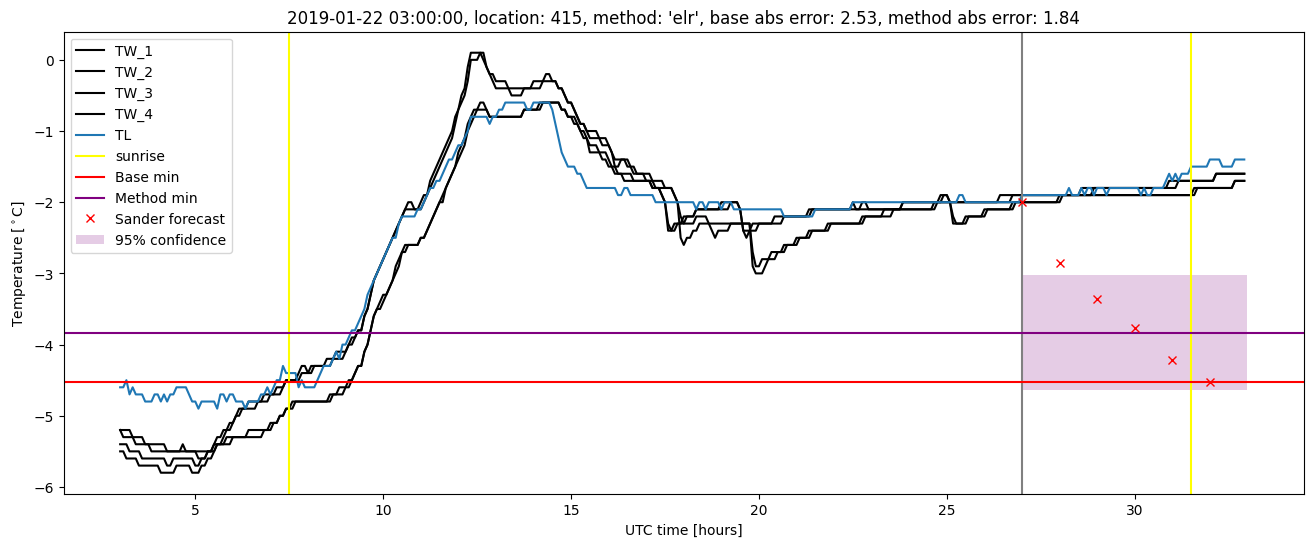
| elr |
winter 2019 |
0.986 |
0.000e+00 |
0.302 |
0.399 |
1.840 |
0.506 |
4.978 |
| baseline |
all |
0.979 |
0.063 |
0.348 |
0.427 |
2.829 |
NaN |
NaN |
| elr |
all |
0.989 |
0.024 |
0.287 |
0.399 |
2.333 |
0.522 |
5.187 |
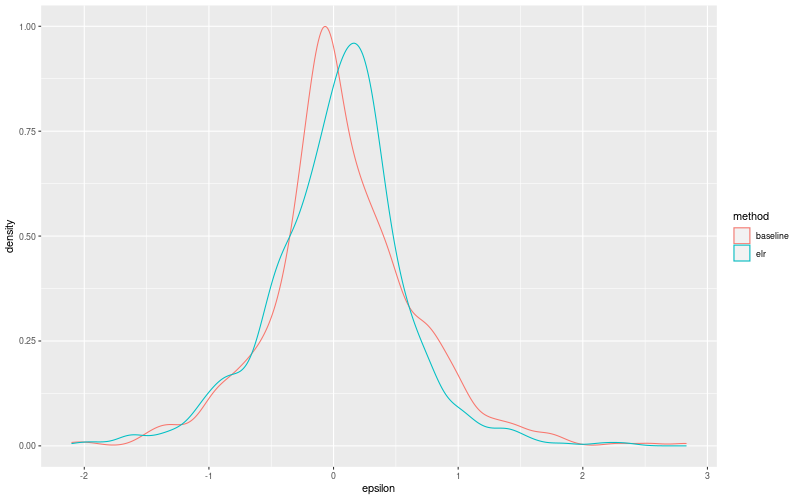
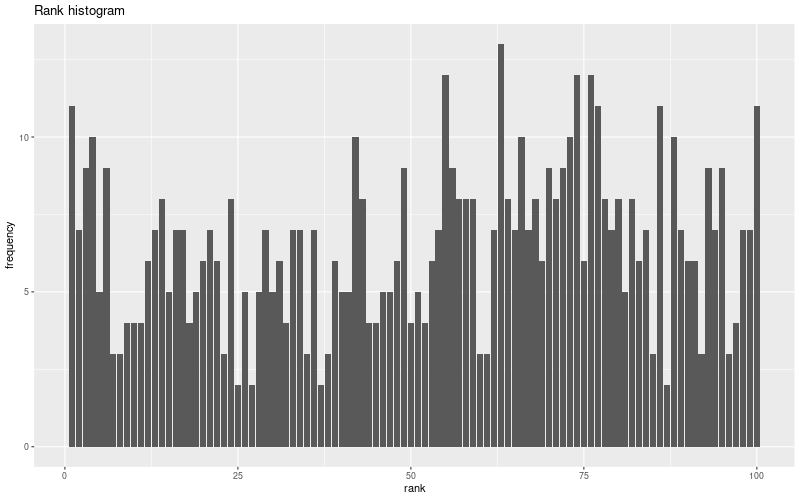
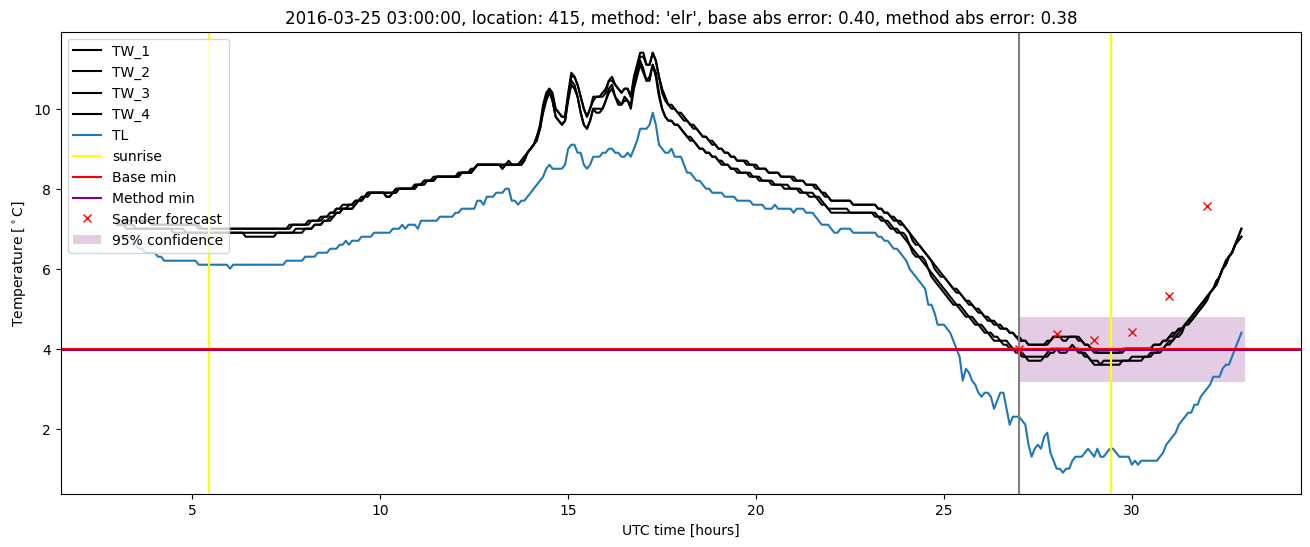
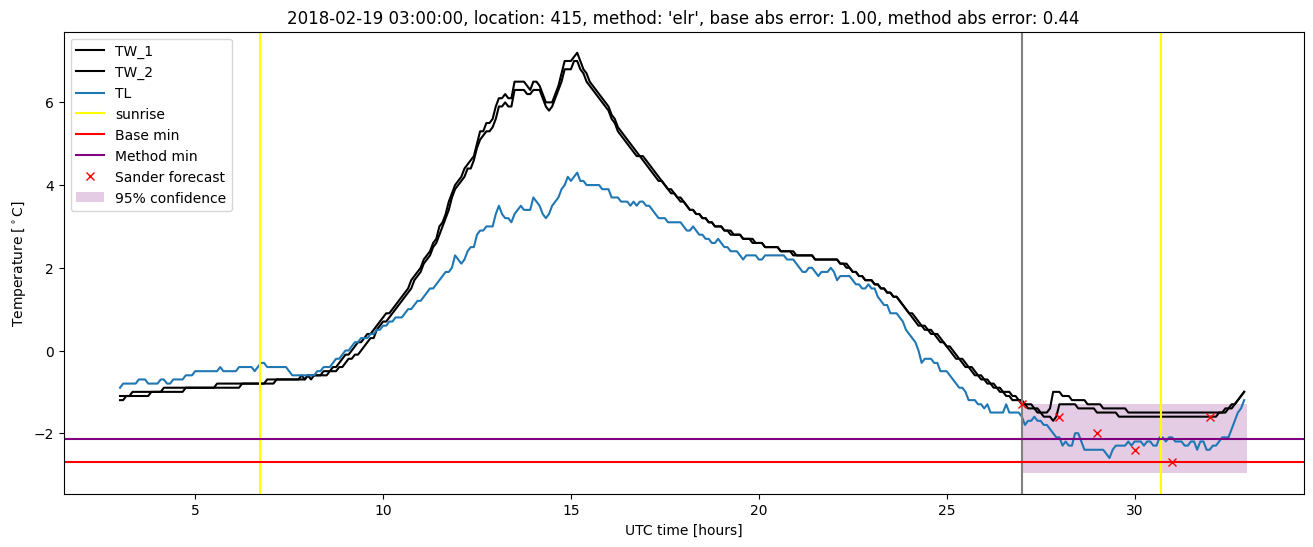
Extended logistic regression plots