GMS location: 413
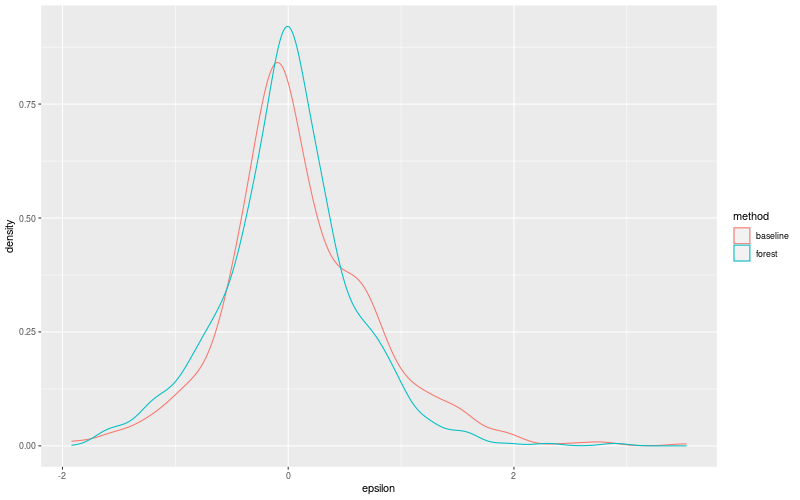
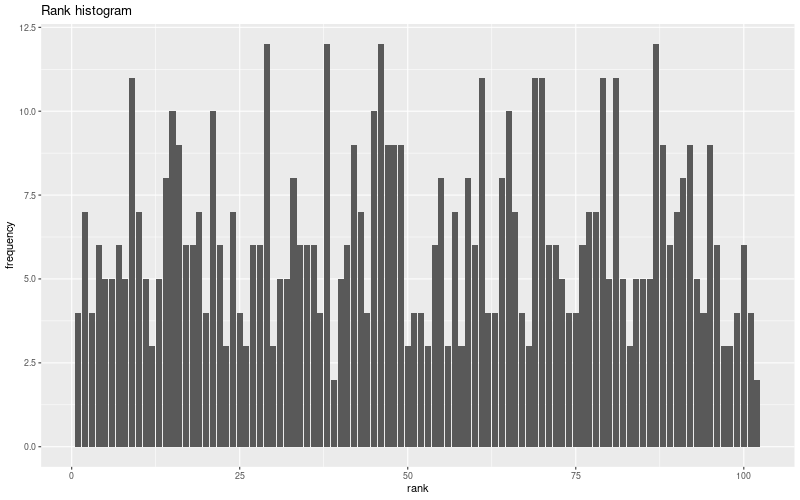
Random forest results
| names |
period |
power |
significance |
meanSquareError |
absError |
maxError |
CRPS |
IGN |
| baseline |
winter 2016 |
0.994 |
0.062 |
0.420 |
0.497 |
2.448 |
NaN |
NaN |
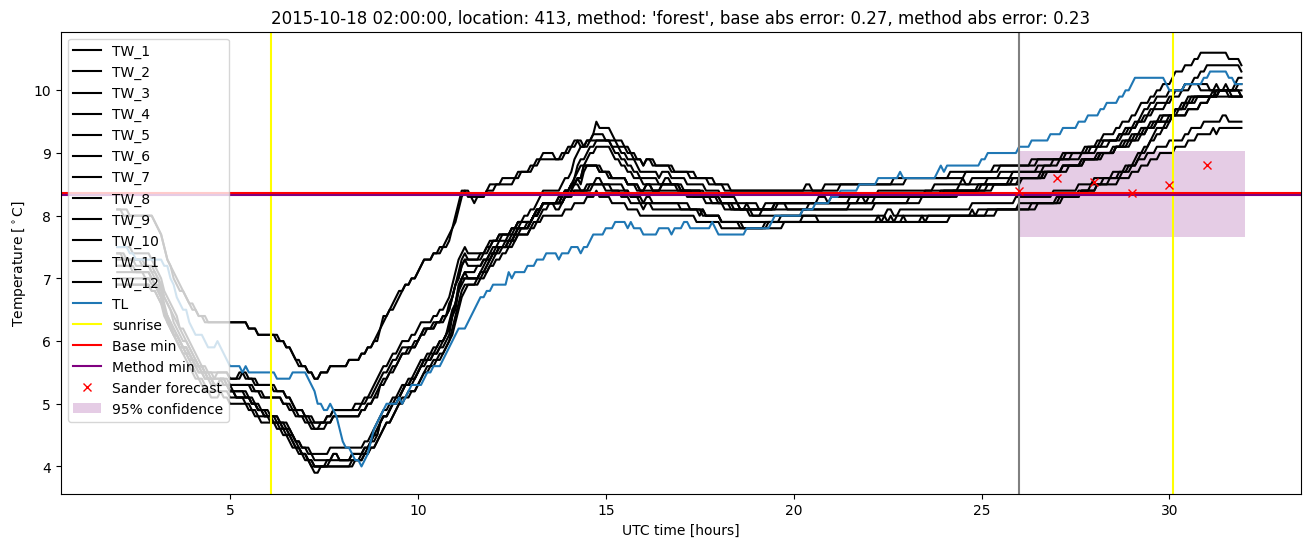
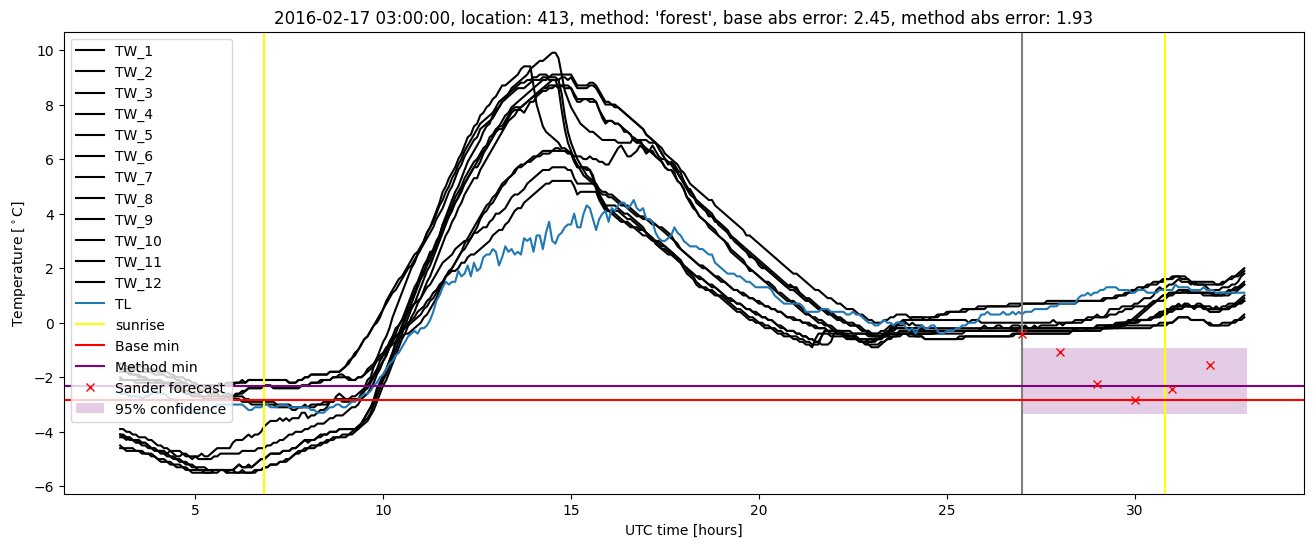
| forest |
winter 2016 |
0.981 |
0.062 |
0.303 |
0.412 |
1.932 |
0.447 |
2.954 |
| baseline |
winter 2017 |
0.972 |
0.023 |
0.550 |
0.537 |
2.808 |
NaN |
NaN |
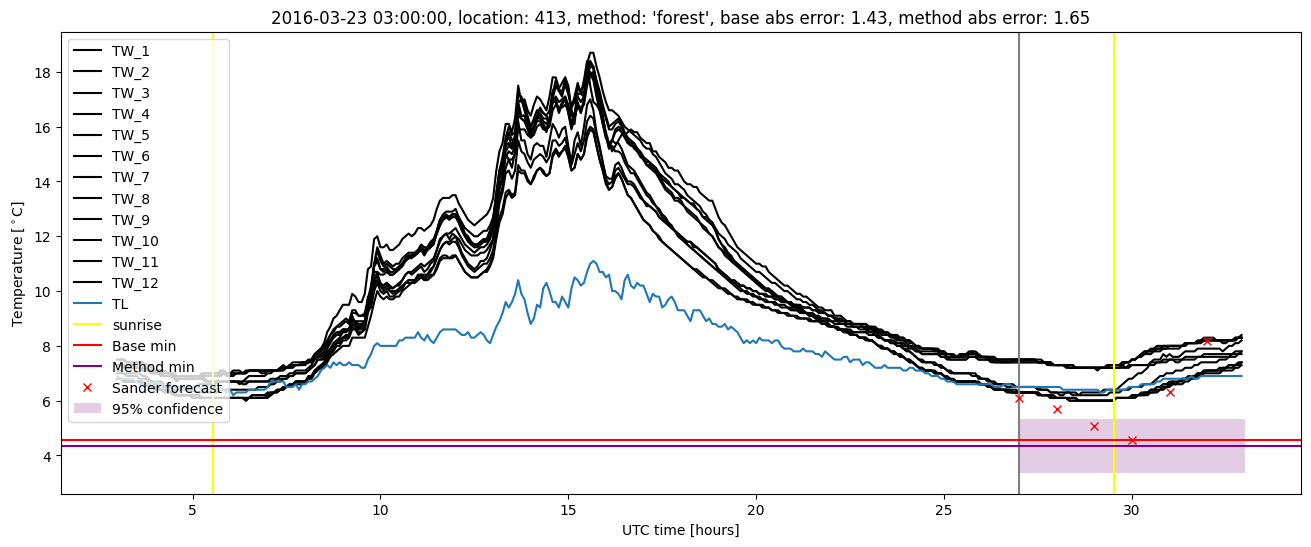
| forest |
winter 2017 |
0.962 |
0.023 |
0.349 |
0.451 |
1.606 |
0.425 |
2.590 |
| baseline |
winter 2018 |
0.992 |
0.108 |
0.399 |
0.451 |
2.713 |
NaN |
NaN |
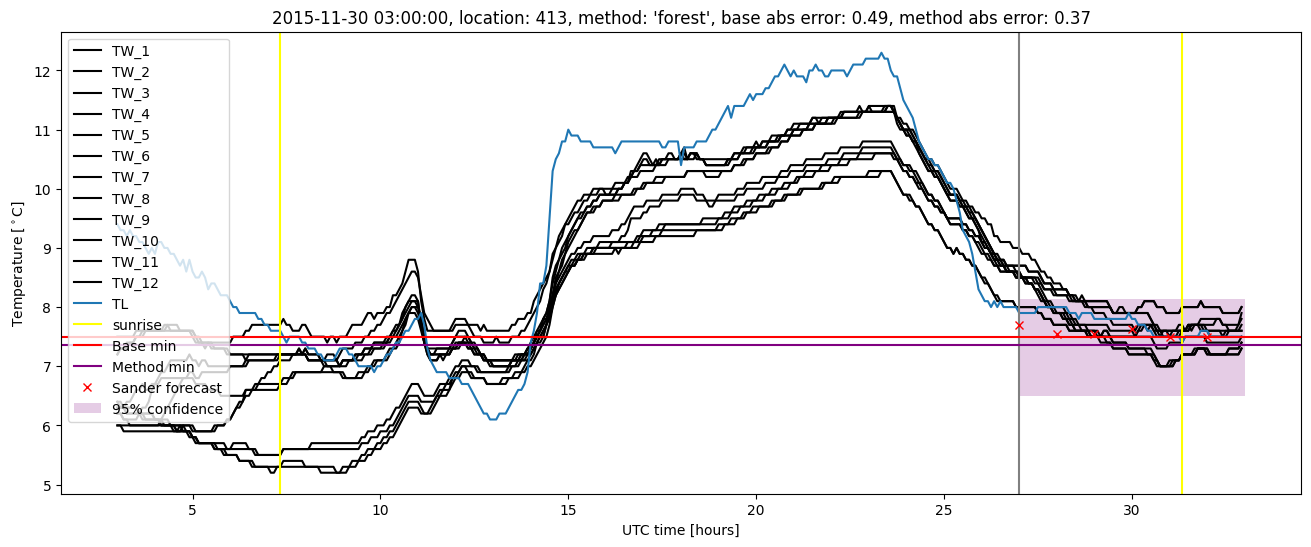
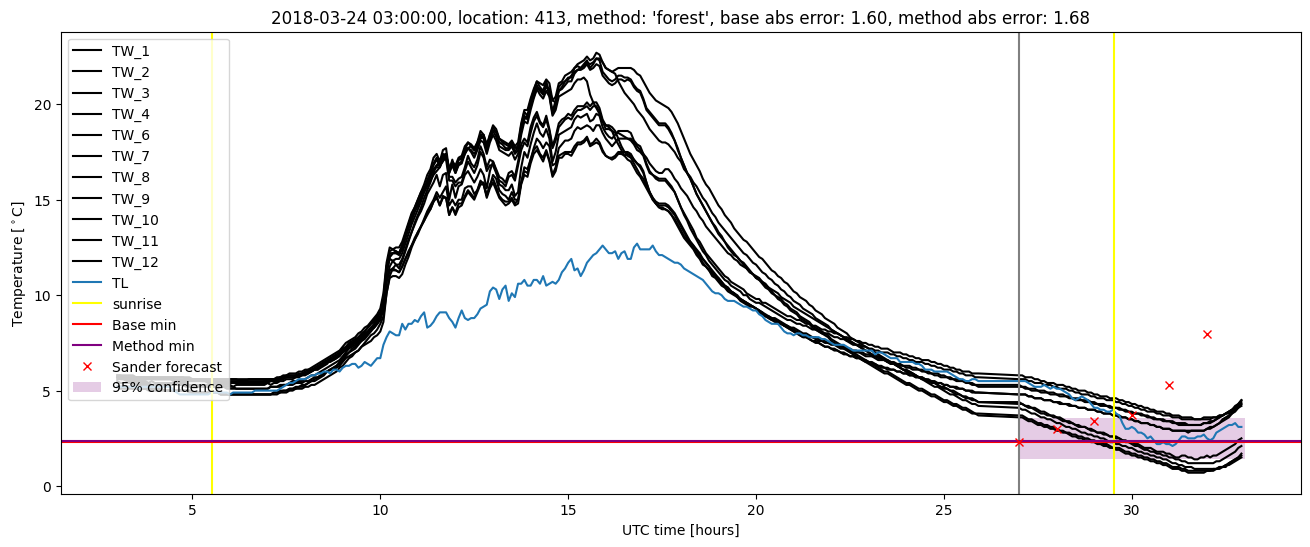
| forest |
winter 2018 |
0.992 |
0.108 |
0.380 |
0.448 |
2.893 |
0.453 |
3.228 |
| baseline |
winter 2019 |
0.991 |
0.040 |
0.477 |
0.472 |
3.526 |
NaN |
NaN |
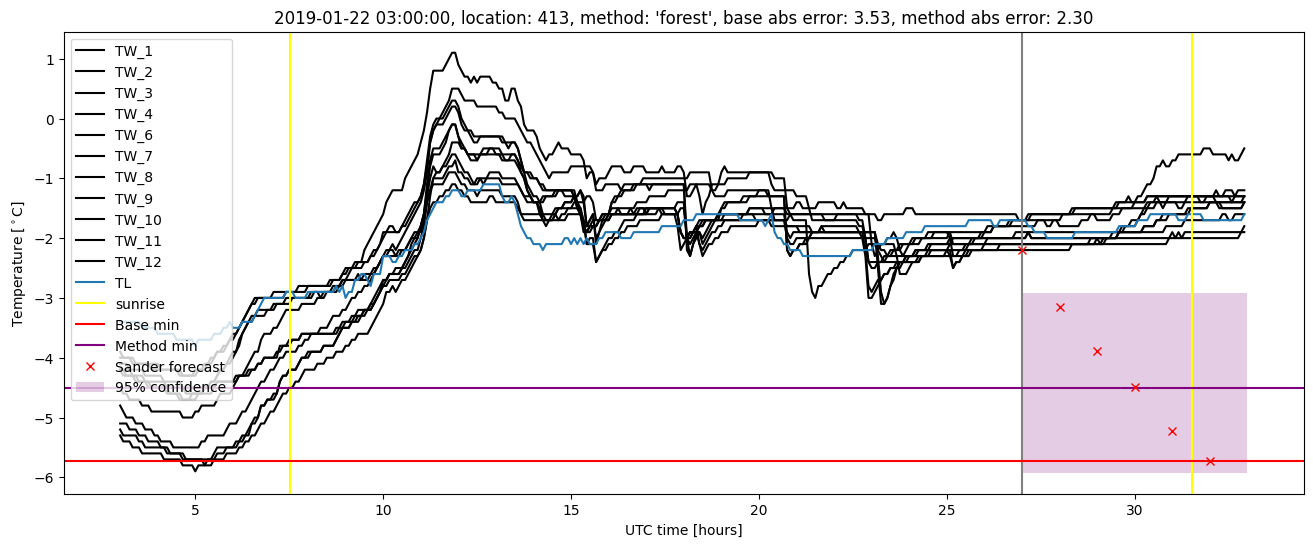
| forest |
winter 2019 |
1.000 |
0.080 |
0.334 |
0.409 |
2.298 |
0.429 |
2.254 |
| baseline |
all |
0.988 |
0.058 |
0.457 |
0.489 |
3.526 |
NaN |
NaN |
| forest |
all |
0.984 |
0.065 |
0.341 |
0.430 |
2.893 |
0.440 |
2.789 |
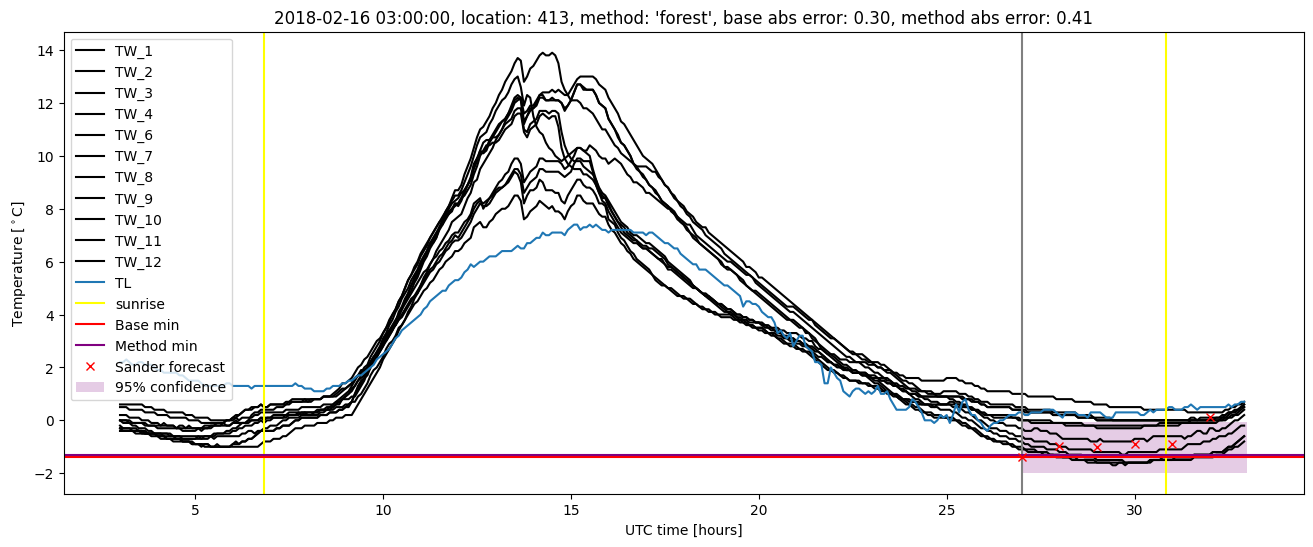
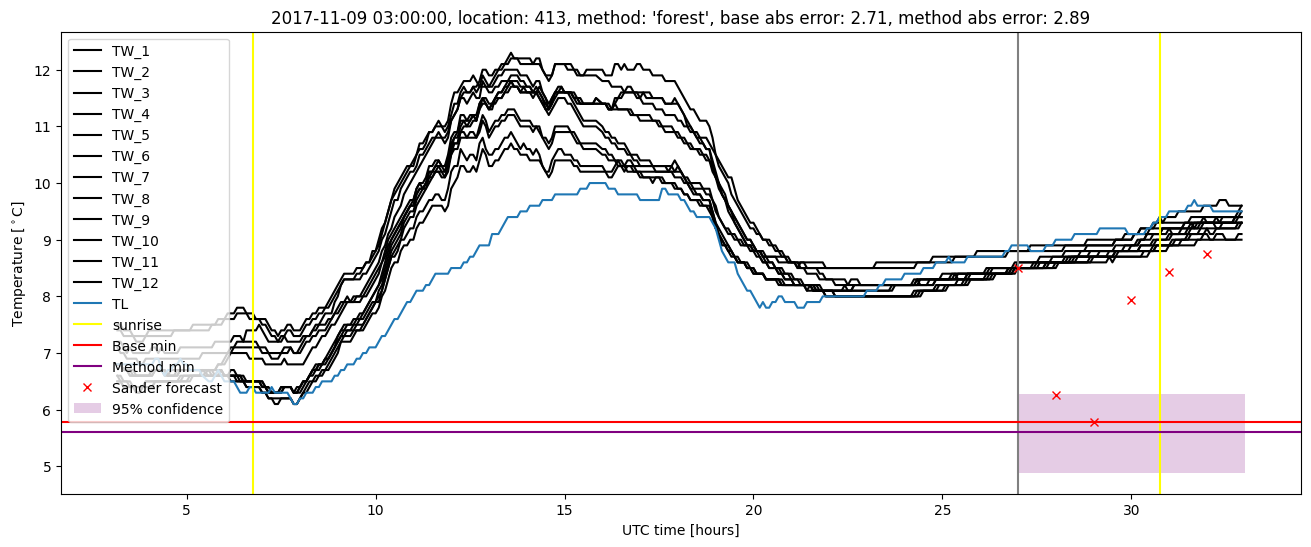
Random forest plots
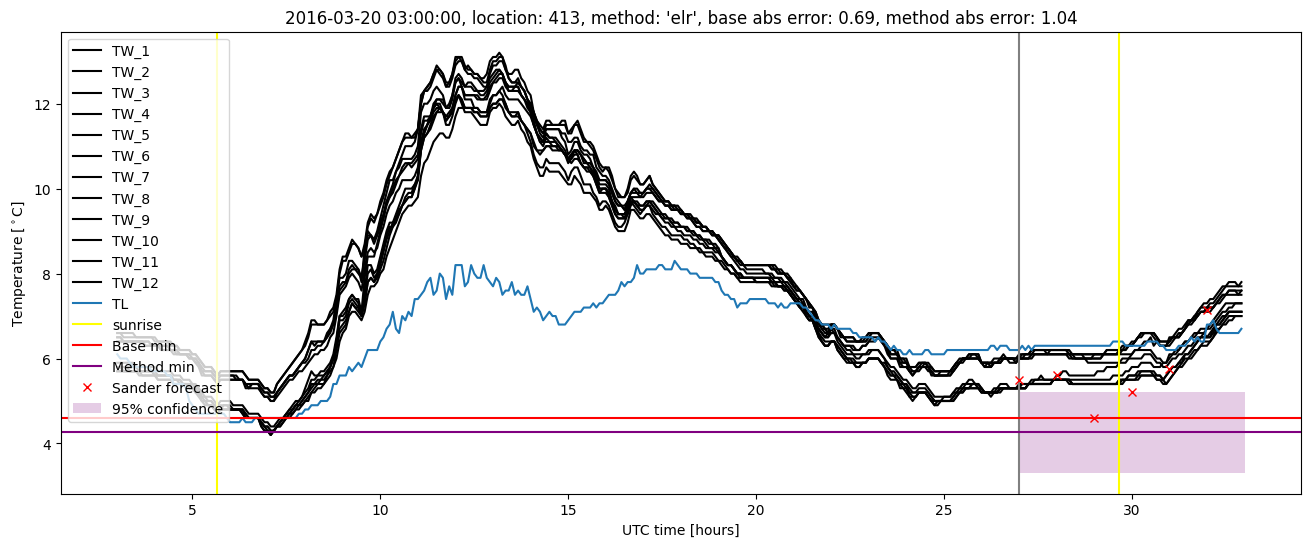
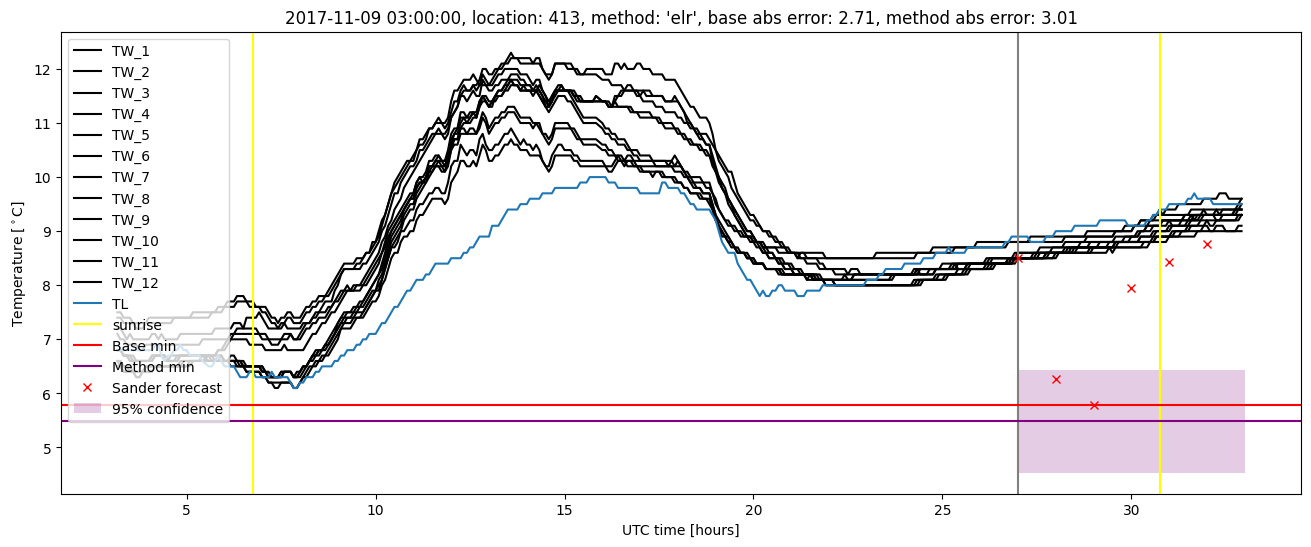
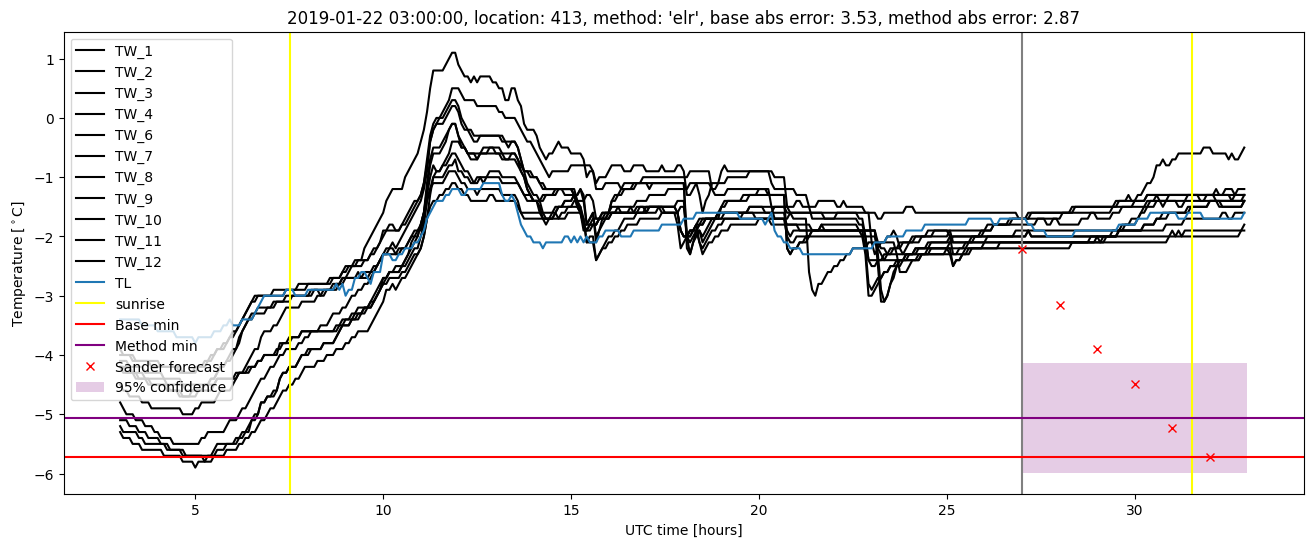
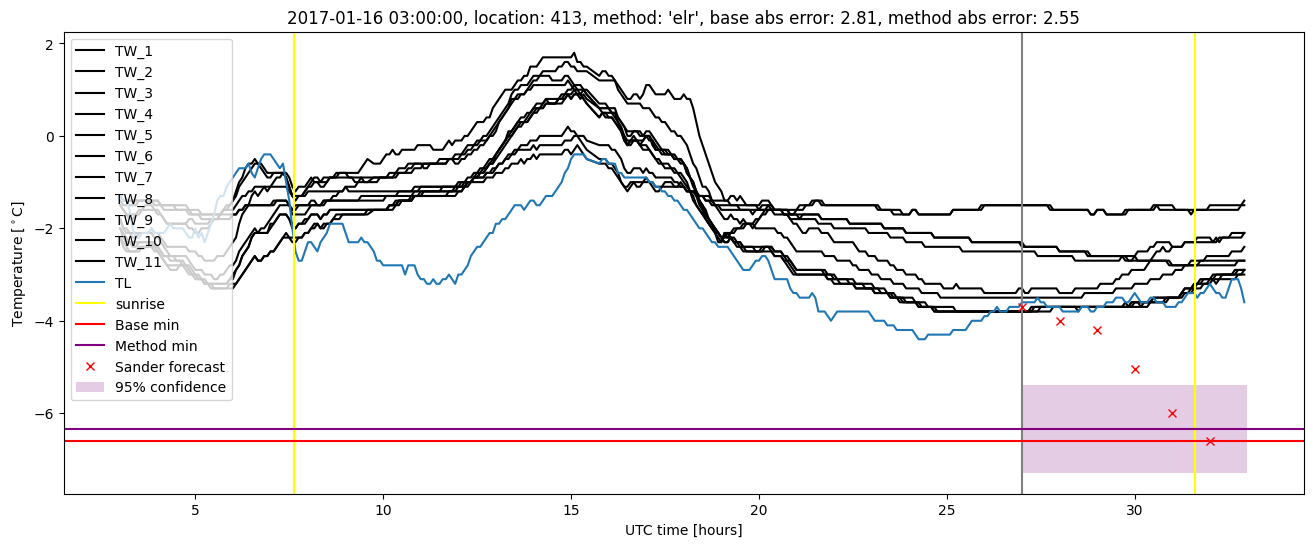
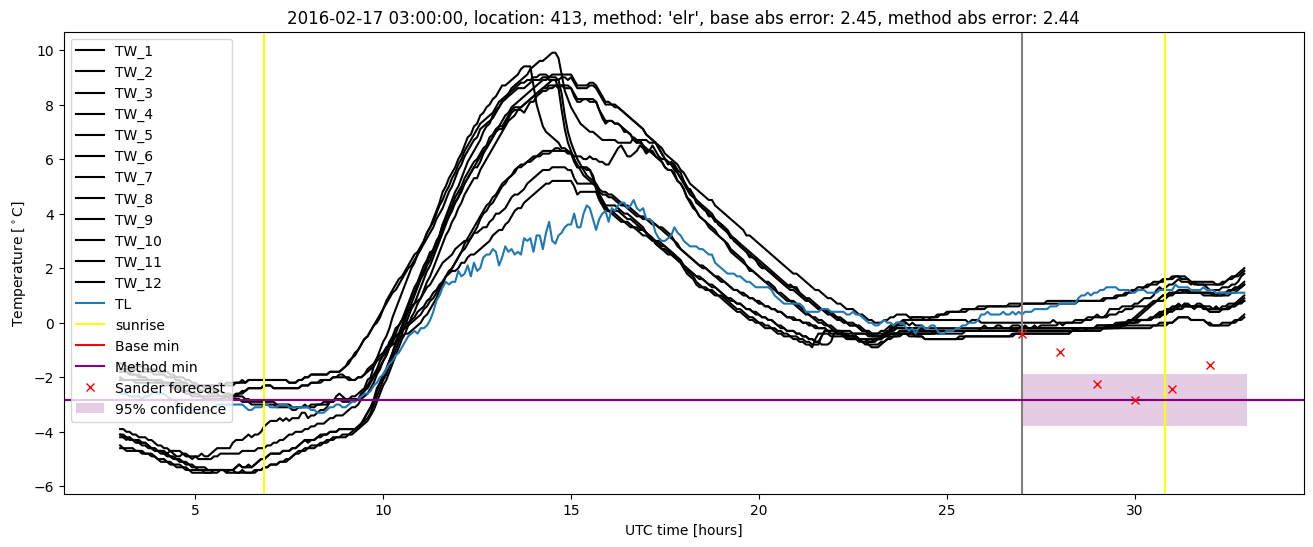
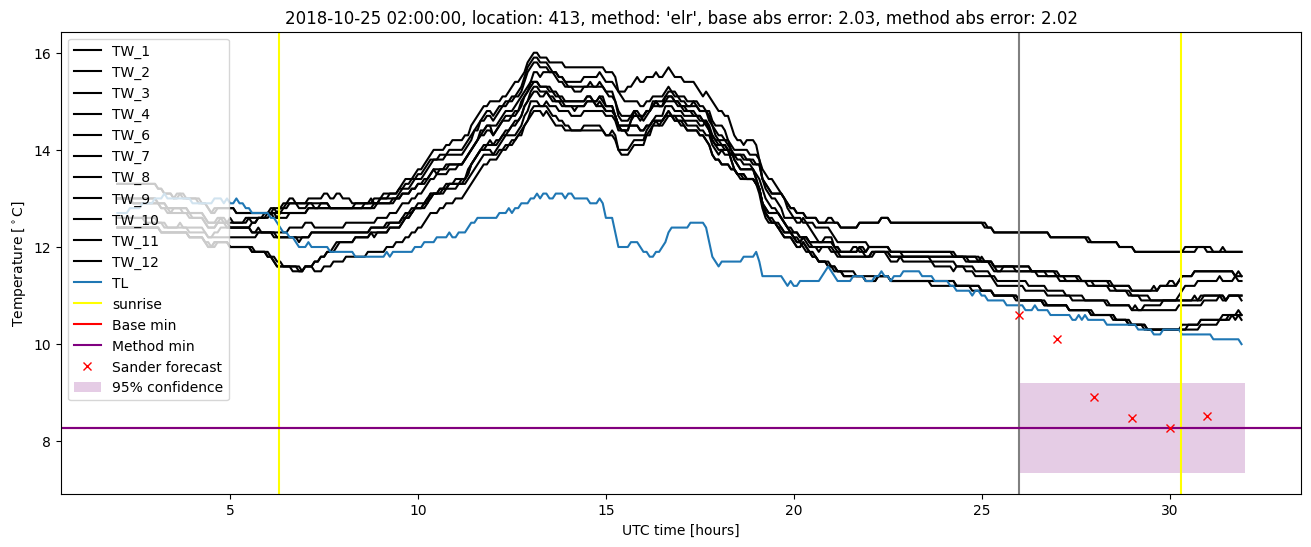
Extended logistic regression results
| names |
period |
power |
significance |
meanSquareError |
absError |
maxError |
CRPS |
IGN |
| baseline |
winter 2016 |
0.994 |
0.062 |
0.420 |
0.497 |
2.448 |
NaN |
NaN |
| elr |
winter 2016 |
0.981 |
0.031 |
0.413 |
0.488 |
2.445 |
0.536 |
3.357 |
| baseline |
winter 2017 |
0.972 |
0.023 |
0.550 |
0.537 |
2.808 |
NaN |
NaN |
| elr |
winter 2017 |
0.981 |
0.068 |
0.438 |
0.483 |
2.546 |
0.449 |
2.392 |
| baseline |
winter 2018 |
0.992 |
0.108 |
0.399 |
0.451 |
2.713 |
NaN |
NaN |
| elr |
winter 2018 |
1.000 |
0.081 |
0.373 |
0.453 |
3.012 |
0.542 |
3.305 |
| baseline |
winter 2019 |
0.991 |
0.040 |
0.477 |
0.472 |
3.526 |
NaN |
NaN |
| elr |
winter 2019 |
1.000 |
0.160 |
0.440 |
0.453 |
2.868 |
0.490 |
2.995 |
| baseline |
all |
0.988 |
0.058 |
0.457 |
0.489 |
3.526 |
NaN |
NaN |
| elr |
all |
0.990 |
0.080 |
0.414 |
0.470 |
3.012 |
0.507 |
3.039 |
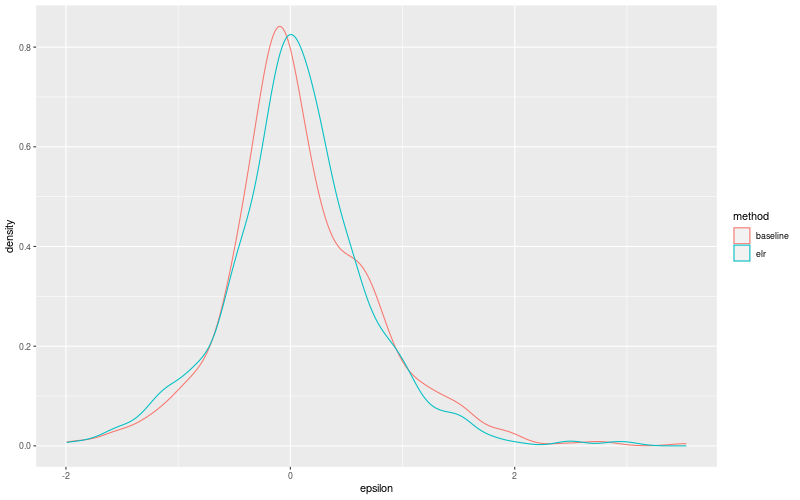
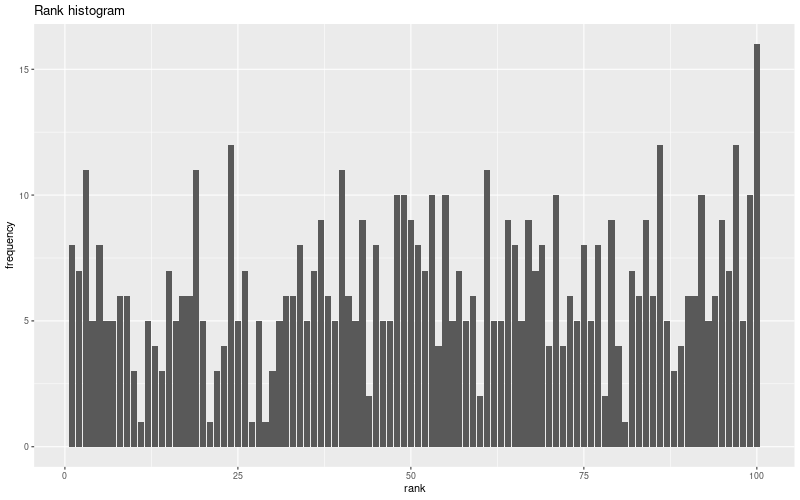
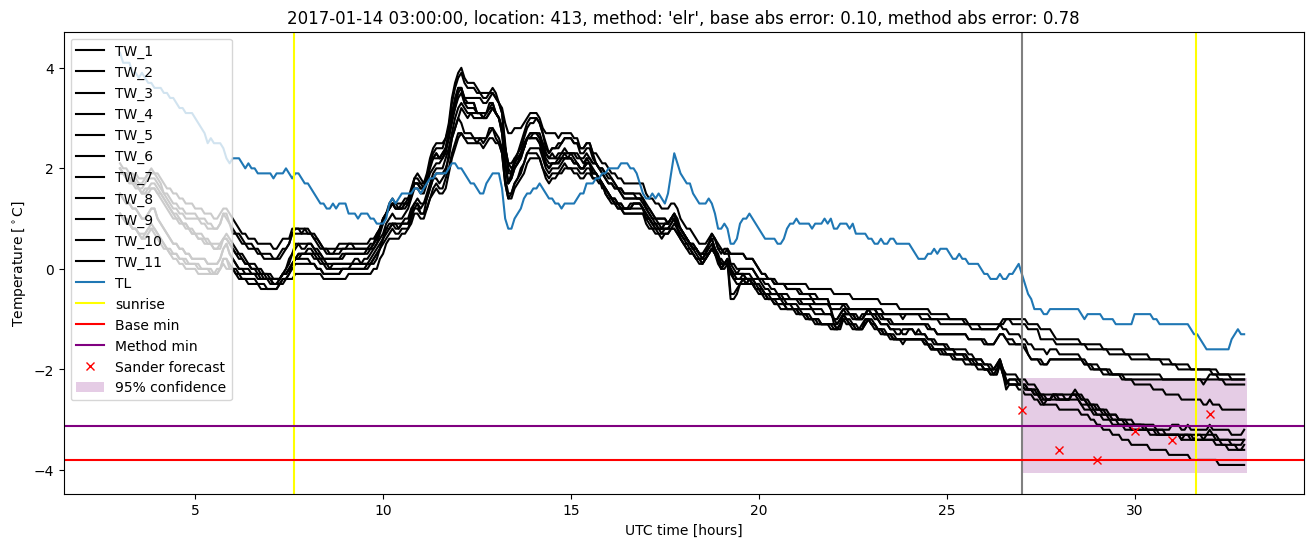
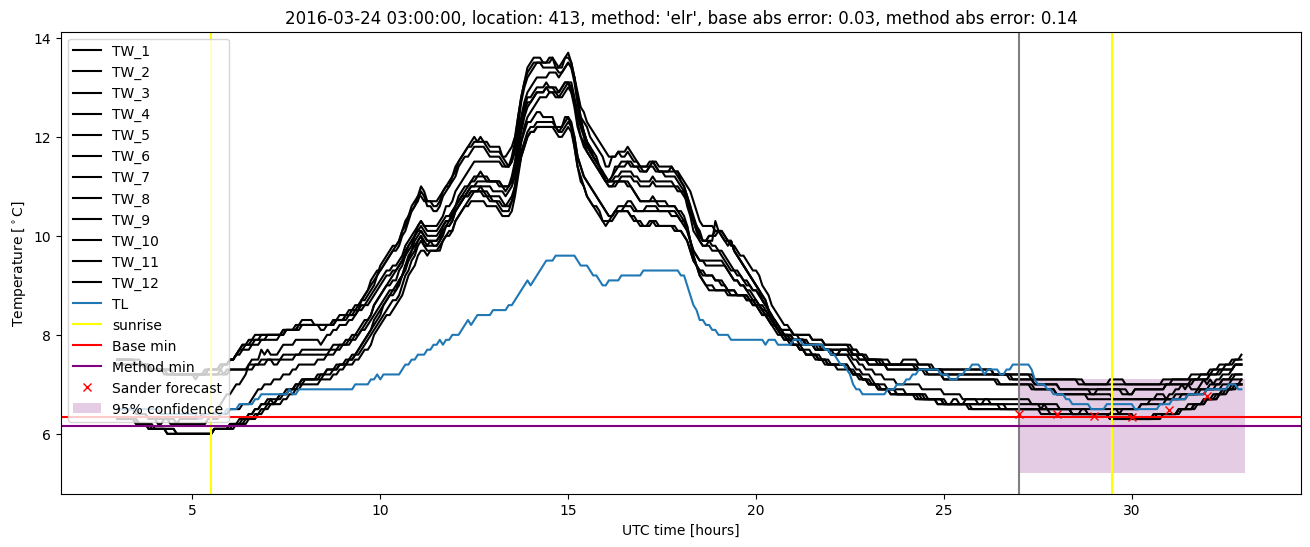
Extended logistic regression plots