GMS location: 412
Random forest results
| names |
period |
power |
significance |
meanSquareError |
absError |
maxError |
CRPS |
IGN |
| baseline |
winter 2016 |
0.989 |
0.000e+00 |
0.319 |
0.420 |
2.183 |
NaN |
NaN |
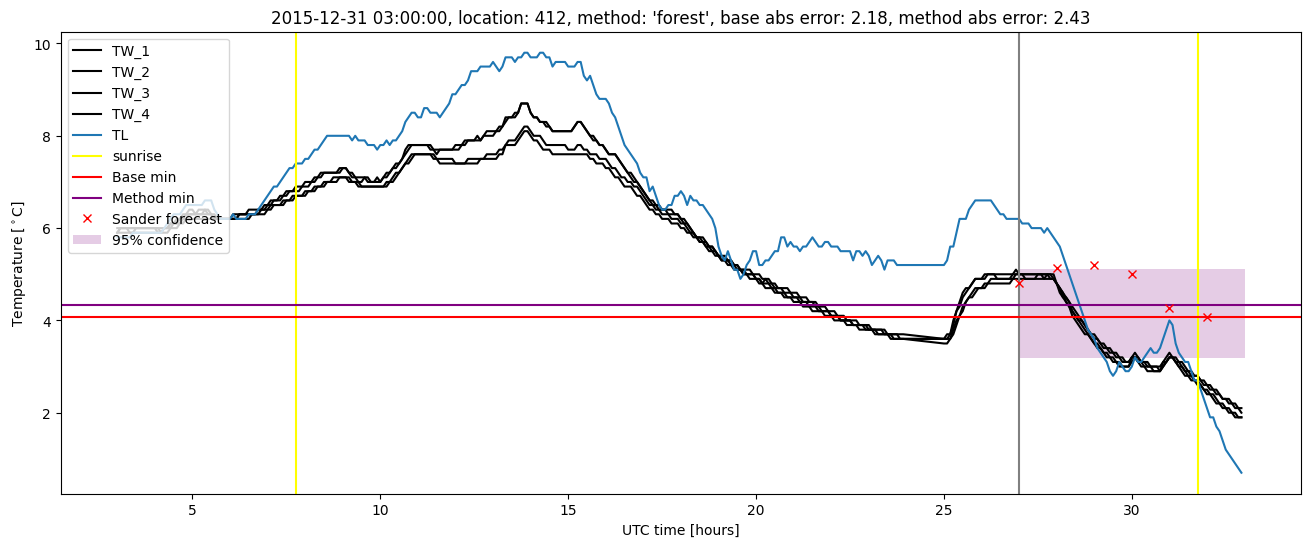
| forest |
winter 2016 |
0.983 |
0.000e+00 |
0.251 |
0.364 |
2.430 |
0.445 |
6.391 |
| baseline |
winter 2017 |
0.991 |
0.026 |
0.400 |
0.444 |
2.521 |
NaN |
NaN |
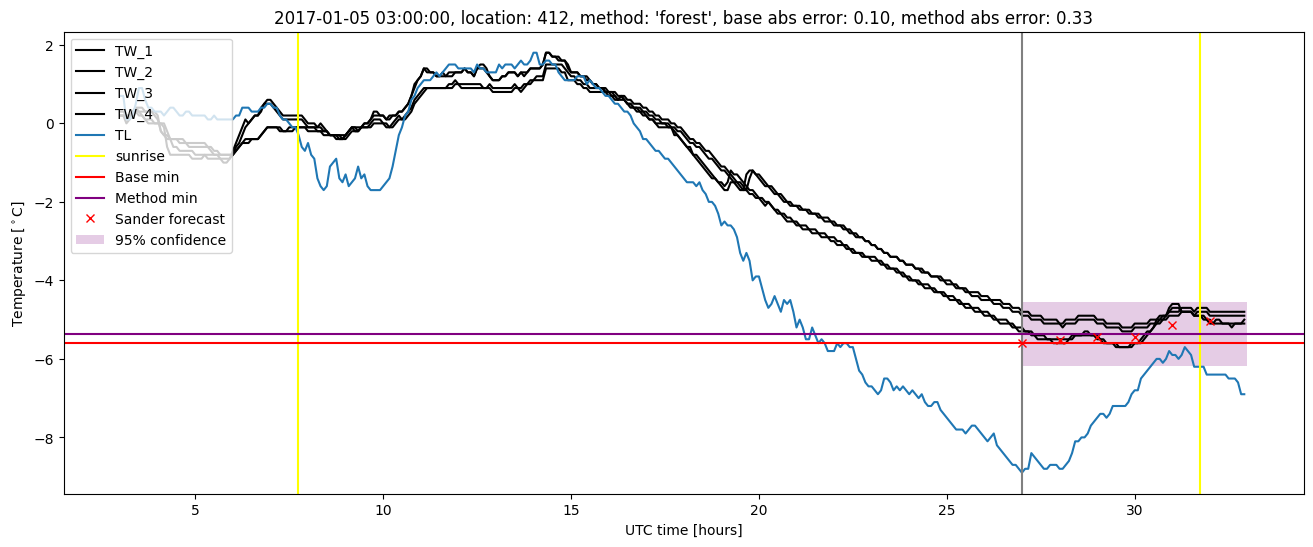
| forest |
winter 2017 |
0.965 |
0.026 |
0.293 |
0.391 |
1.875 |
0.446 |
4.784 |
| baseline |
winter 2018 |
0.984 |
0.071 |
0.362 |
0.461 |
1.740 |
NaN |
NaN |
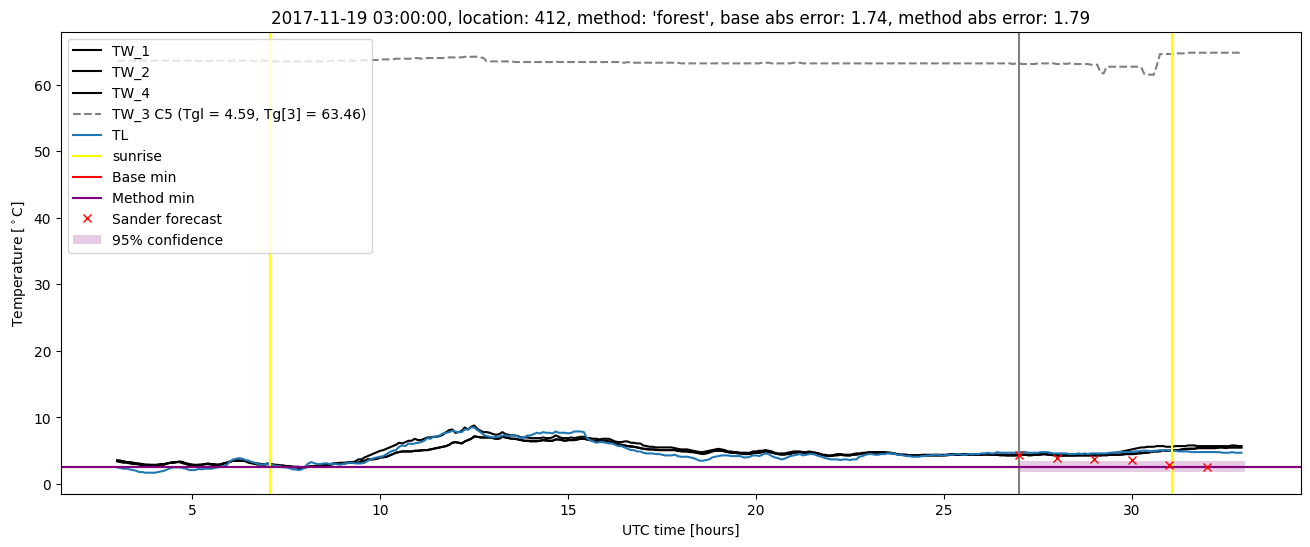
| forest |
winter 2018 |
0.992 |
0.071 |
0.273 |
0.384 |
1.792 |
0.447 |
4.863 |
| baseline |
winter 2019 |
0.985 |
0.000e+00 |
0.359 |
0.426 |
2.348 |
NaN |
NaN |
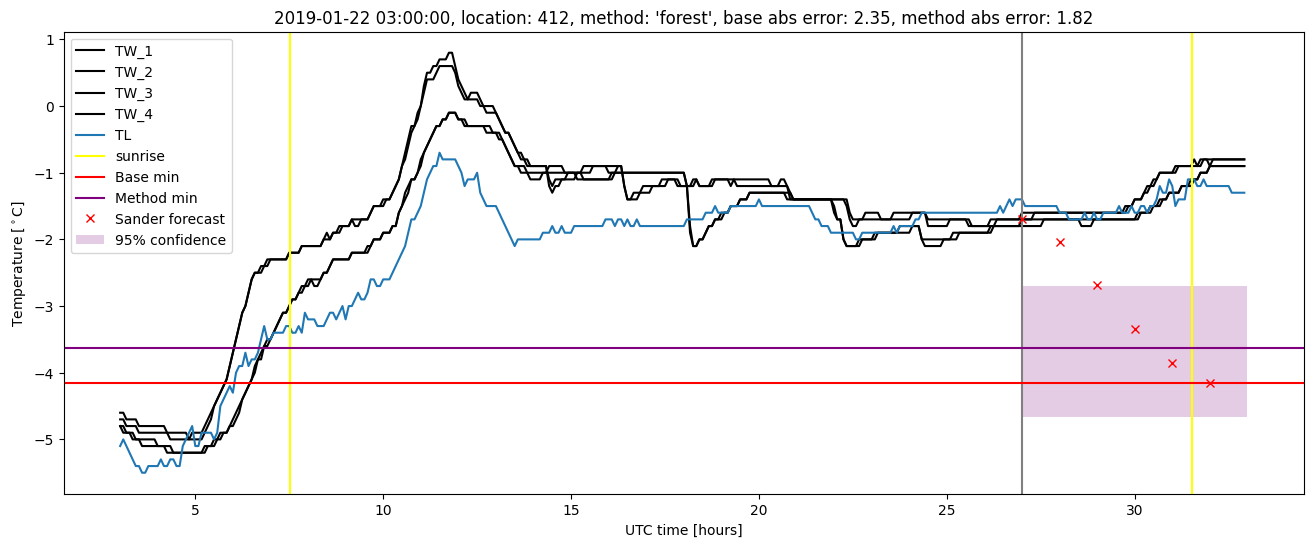
| forest |
winter 2019 |
0.978 |
0.000e+00 |
0.253 |
0.366 |
1.825 |
0.449 |
3.896 |
| baseline |
all |
0.987 |
0.028 |
0.357 |
0.436 |
2.521 |
NaN |
NaN |
| forest |
all |
0.980 |
0.028 |
0.267 |
0.375 |
2.430 |
0.447 |
5.096 |
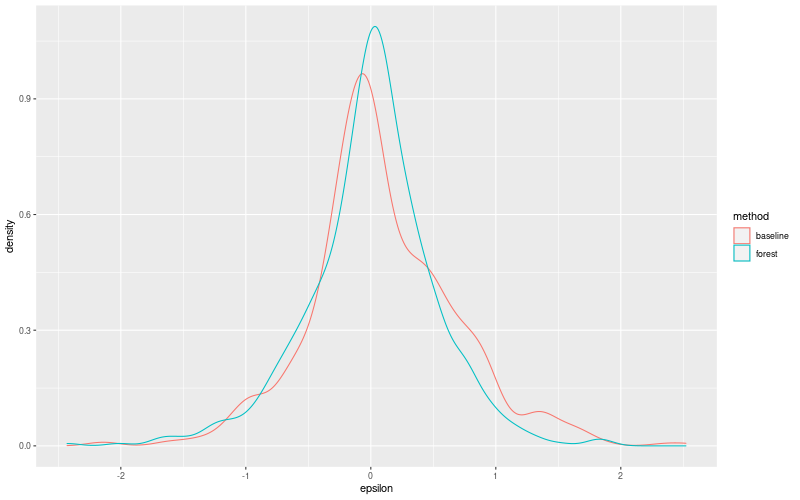
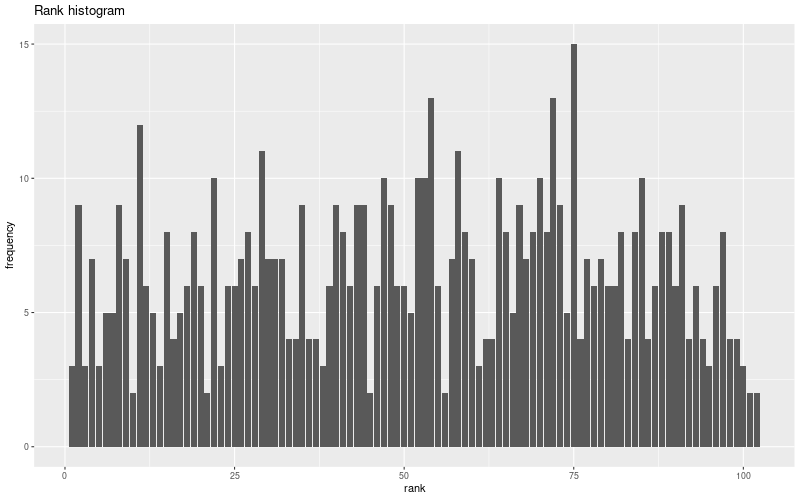
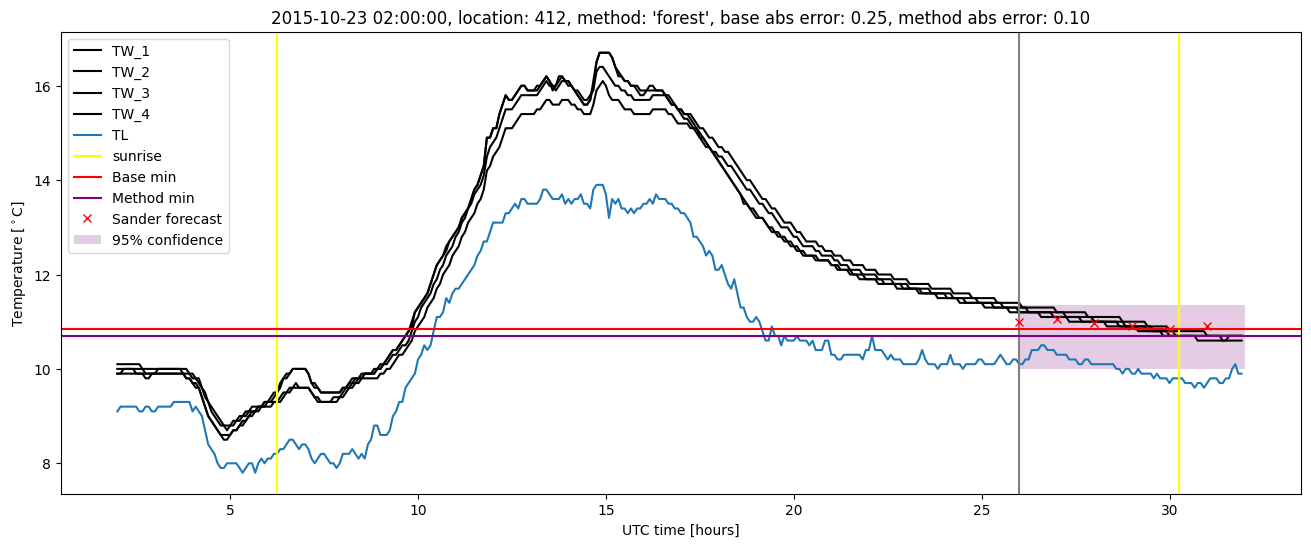
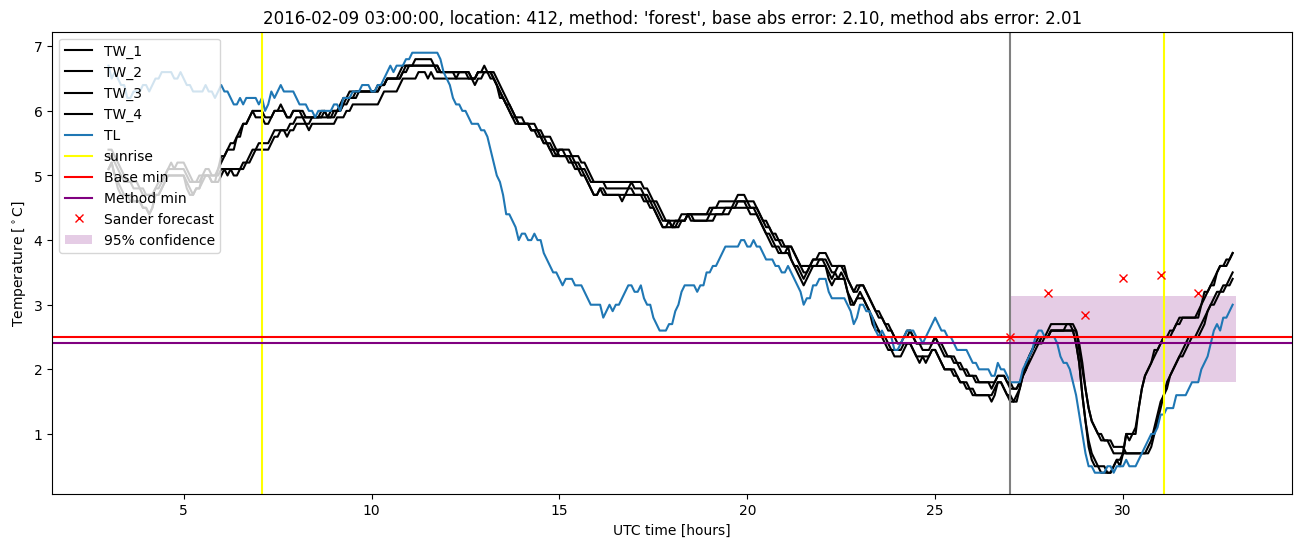
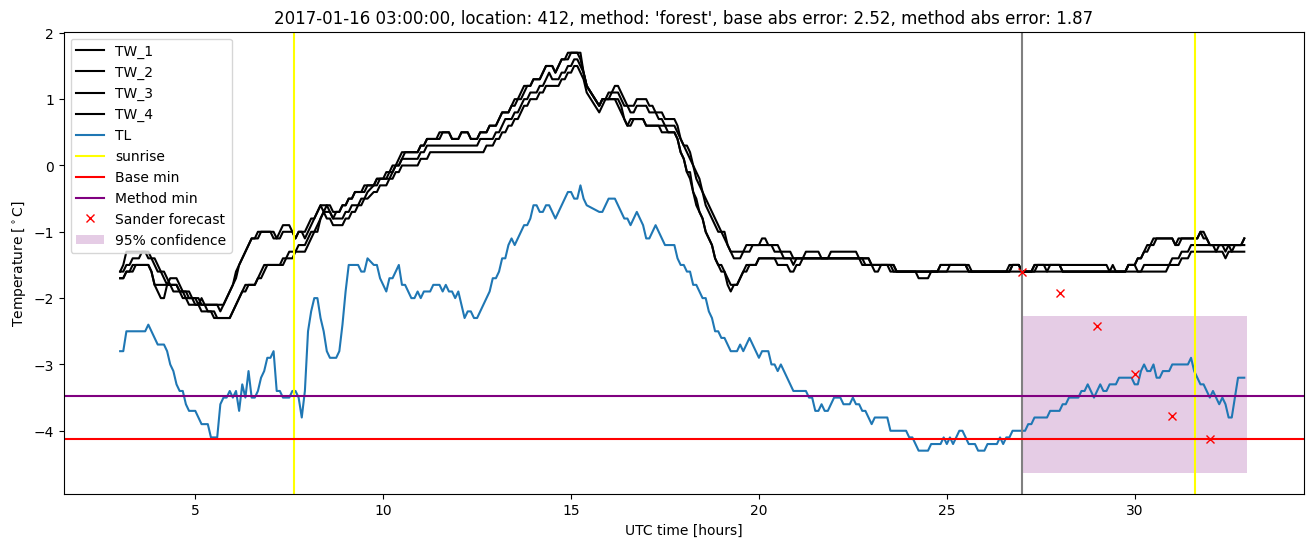
Random forest plots

Extended logistic regression results
| names |
period |
power |
significance |
meanSquareError |
absError |
maxError |
CRPS |
IGN |
| baseline |
winter 2016 |
0.989 |
0.000e+00 |
0.319 |
0.420 |
2.183 |
NaN |
NaN |
| elr |
winter 2016 |
0.977 |
0.000e+00 |
0.268 |
0.401 |
2.261 |
0.511 |
4.523 |
| baseline |
winter 2017 |
0.991 |
0.026 |
0.400 |
0.444 |
2.521 |
NaN |
NaN |
| elr |
winter 2017 |
0.957 |
0.026 |
0.344 |
0.411 |
2.248 |
0.514 |
5.225 |
| baseline |
winter 2018 |
0.984 |
0.071 |
0.362 |
0.461 |
1.740 |
NaN |
NaN |
| elr |
winter 2018 |
0.984 |
0.071 |
0.321 |
0.420 |
2.165 |
0.524 |
4.727 |
| baseline |
winter 2019 |
0.985 |
0.000e+00 |
0.359 |
0.426 |
2.348 |
NaN |
NaN |
| elr |
winter 2019 |
0.978 |
0.000e+00 |
0.302 |
0.407 |
2.261 |
0.505 |
3.975 |
| baseline |
all |
0.987 |
0.028 |
0.357 |
0.436 |
2.521 |
NaN |
NaN |
| elr |
all |
0.975 |
0.028 |
0.306 |
0.409 |
2.261 |
0.513 |
4.610 |
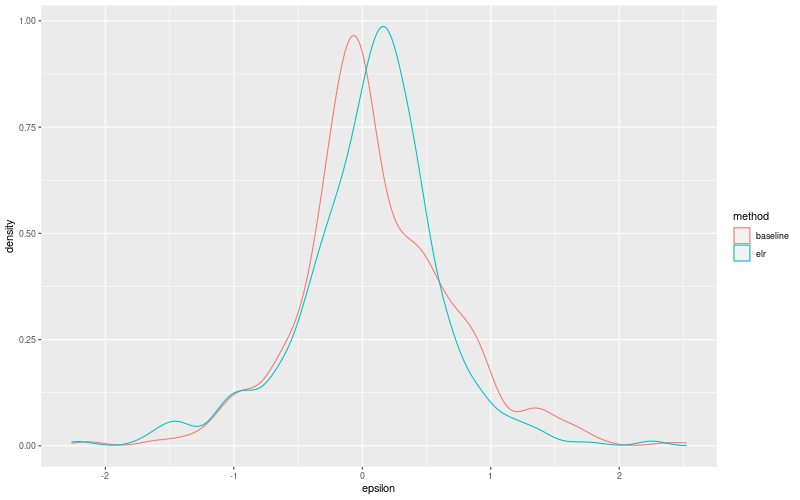
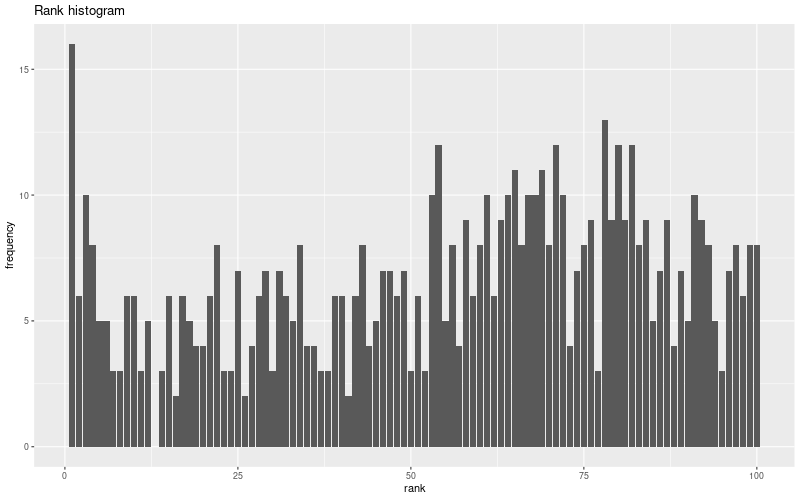
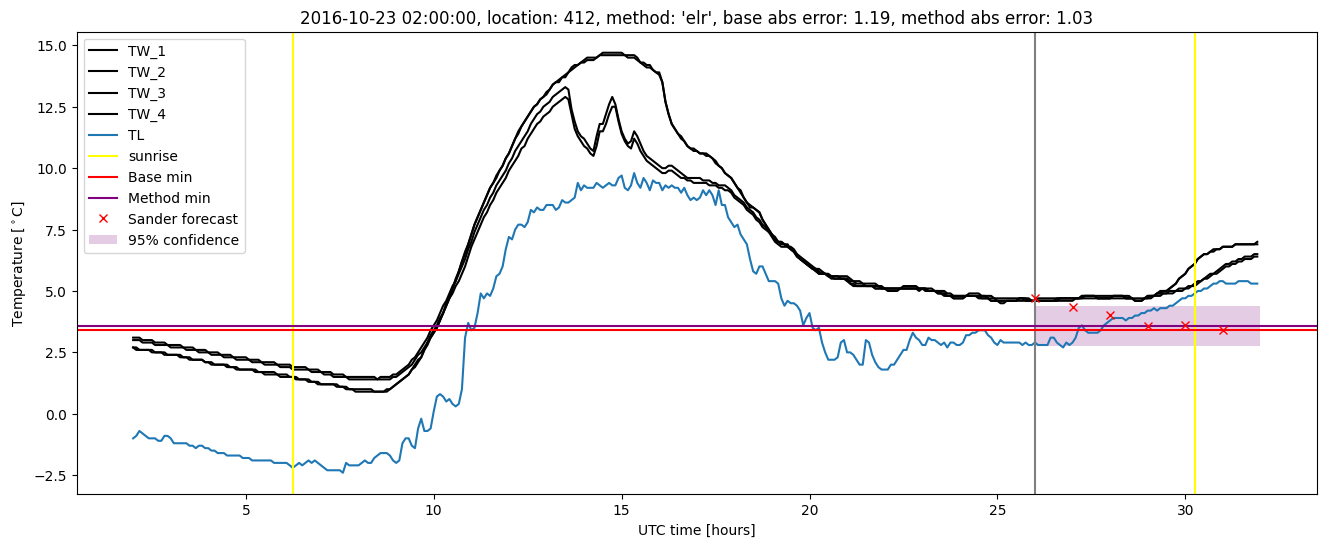
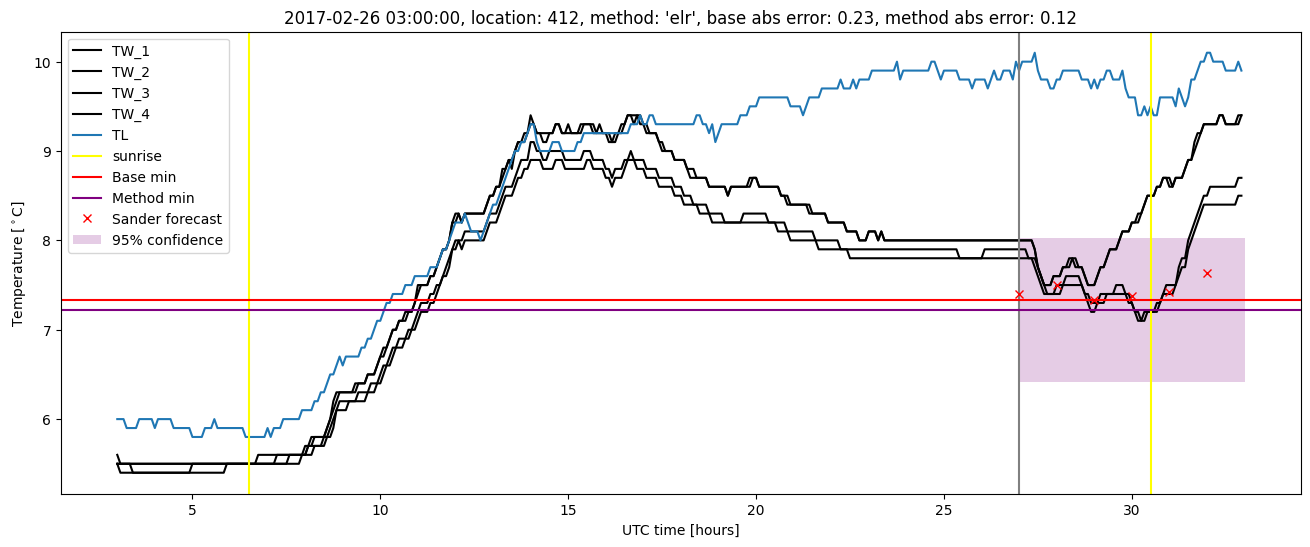
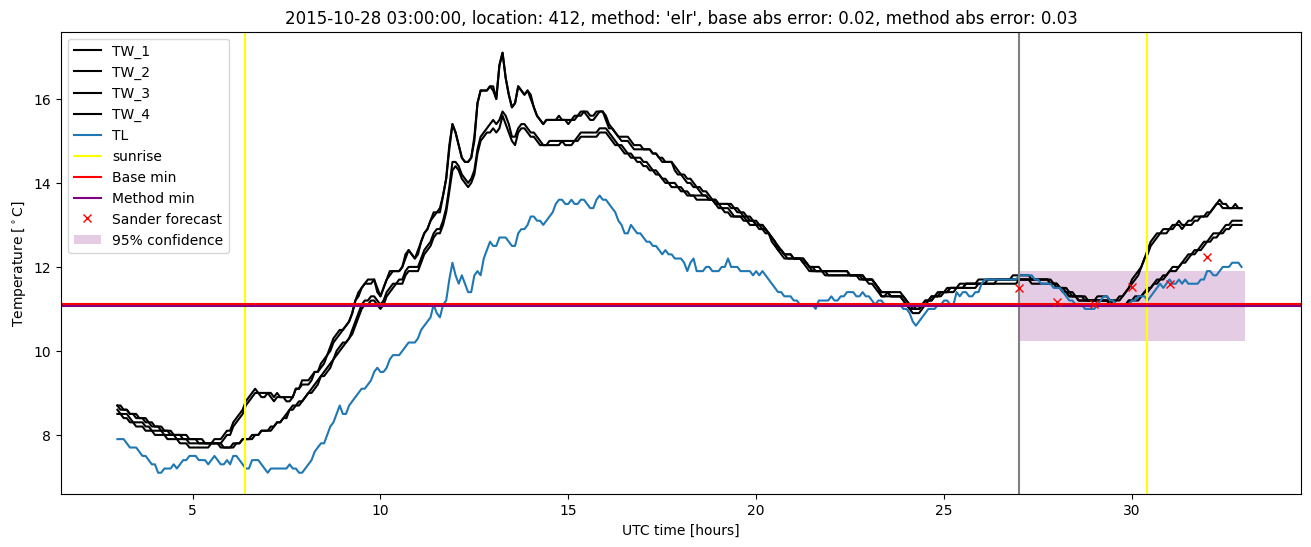
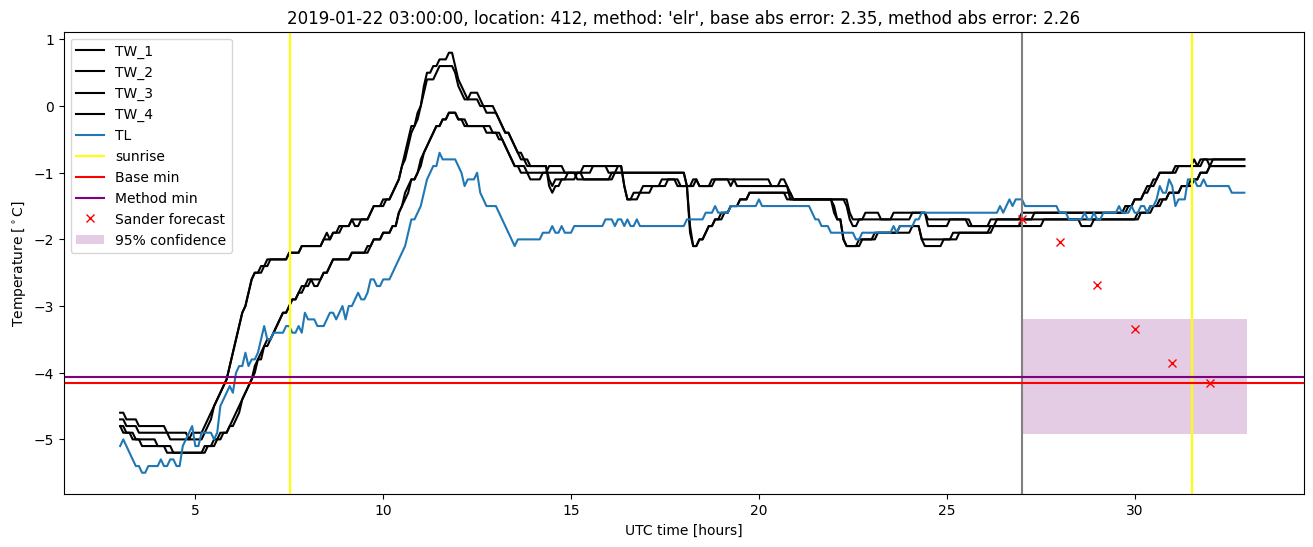
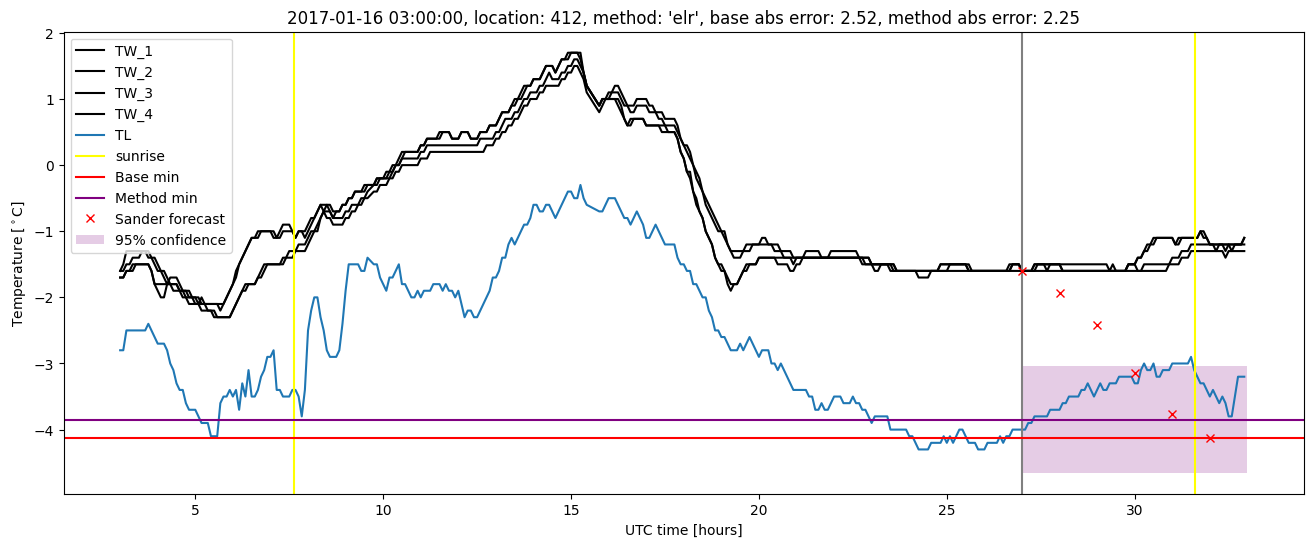
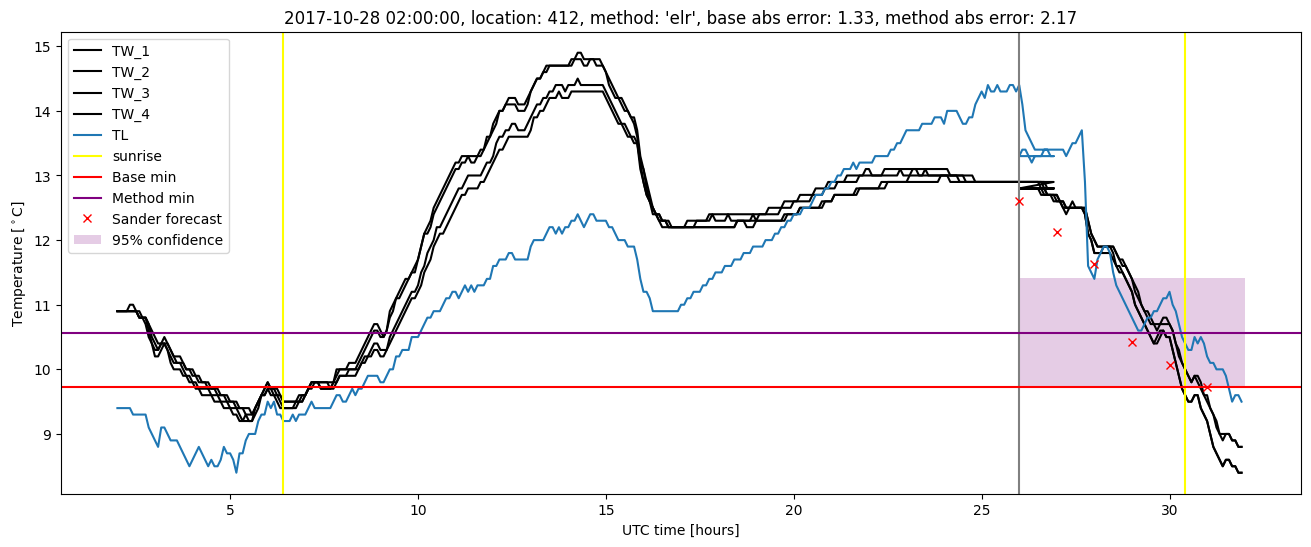
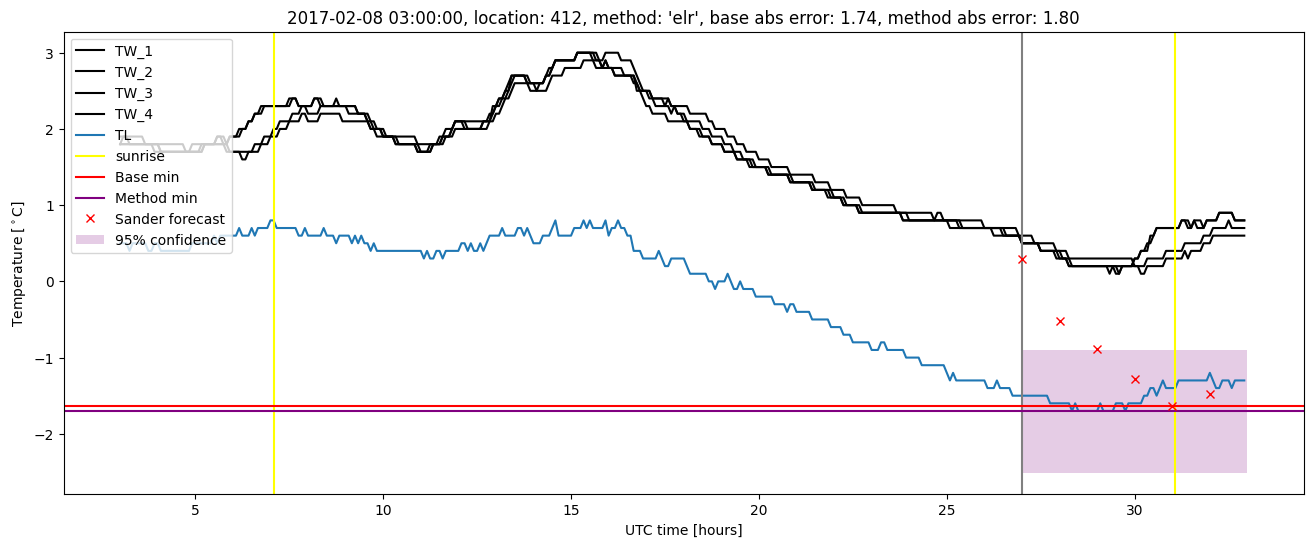
Extended logistic regression plots