GMS location: 410
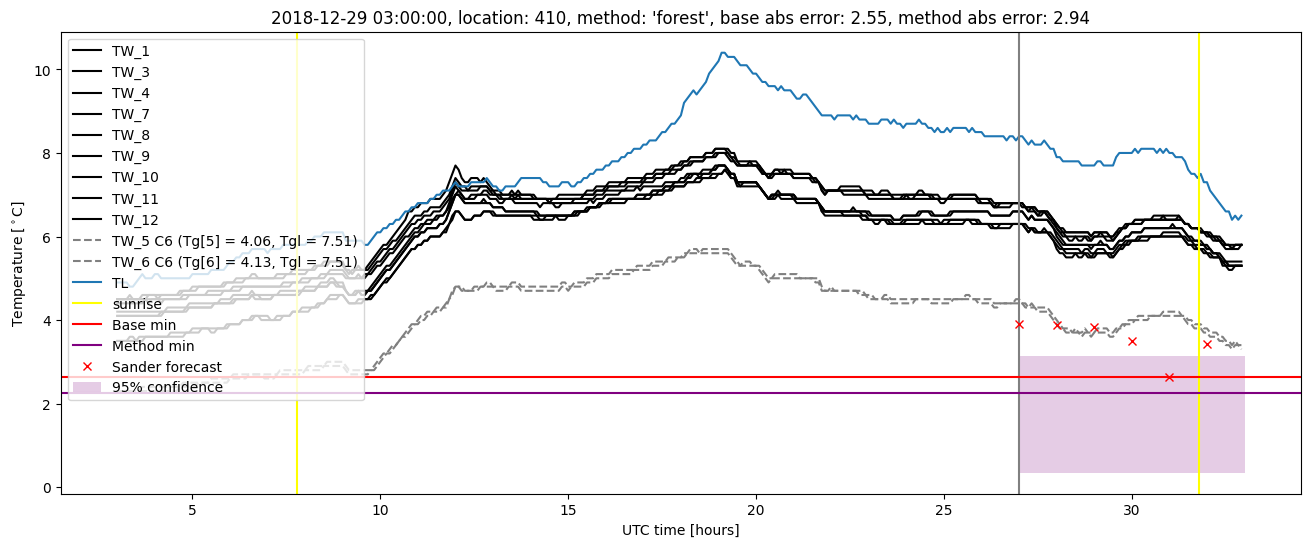
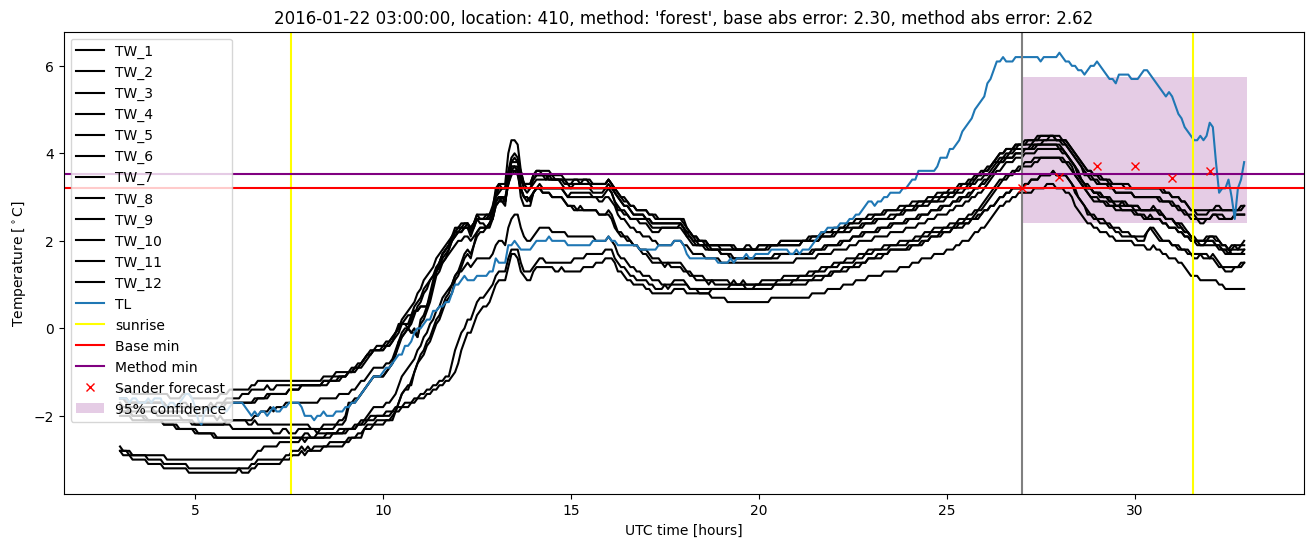
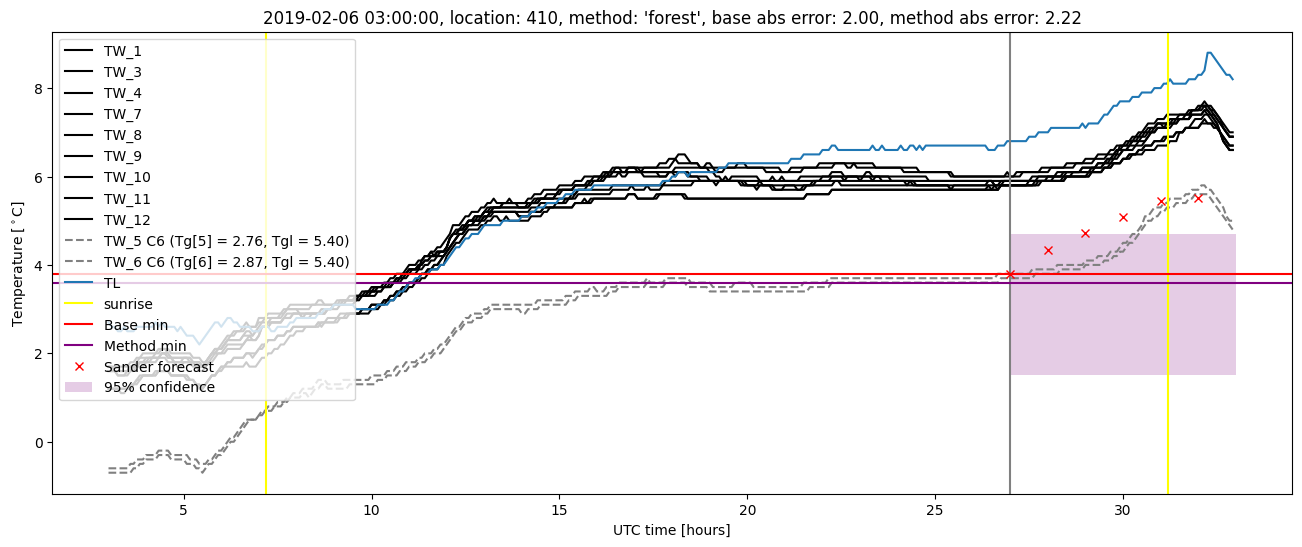
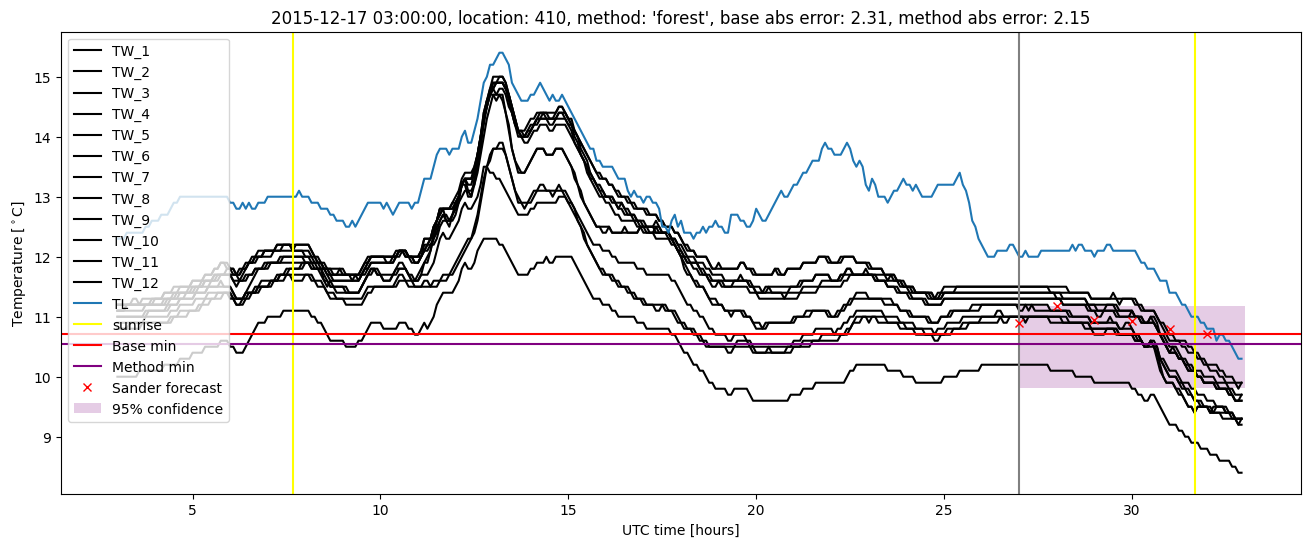
Random forest results
| names |
period |
power |
significance |
meanSquareError |
absError |
maxError |
CRPS |
IGN |
| baseline |
winter 2016 |
1.000 |
0.103 |
0.340 |
0.414 |
2.313 |
NaN |
NaN |
| forest |
winter 2016 |
0.994 |
0.103 |
0.309 |
0.390 |
2.617 |
0.484 |
2.562 |
| baseline |
winter 2017 |
0.955 |
0.024 |
0.293 |
0.428 |
1.937 |
NaN |
NaN |
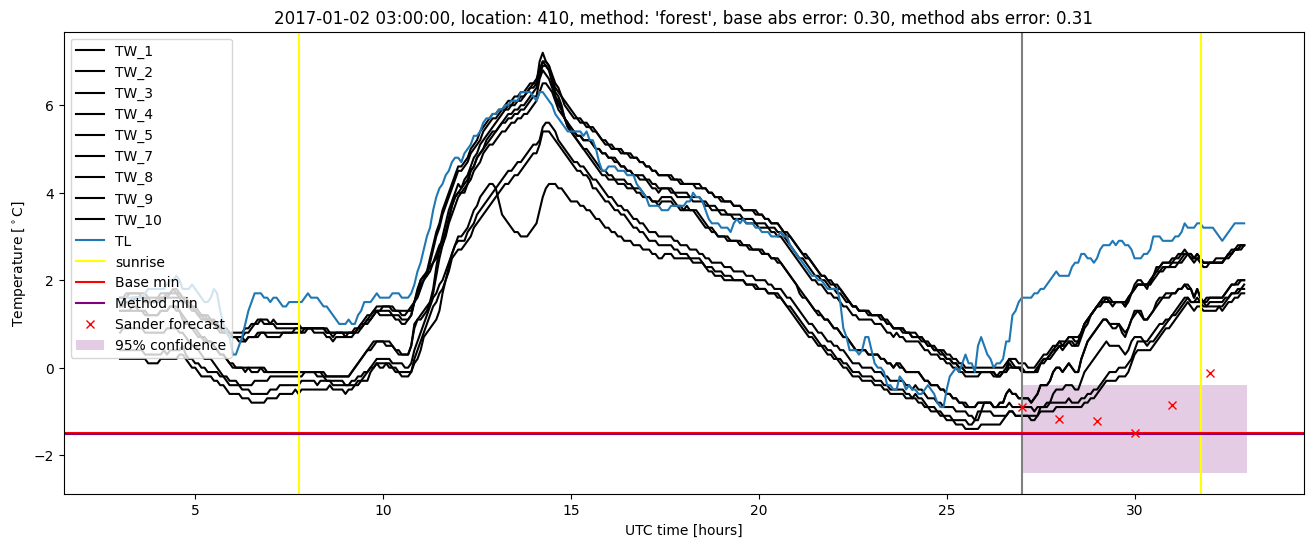
| forest |
winter 2017 |
0.937 |
0.024 |
0.216 |
0.364 |
1.160 |
0.467 |
2.391 |
| baseline |
winter 2018 |
1.000 |
0.098 |
0.297 |
0.407 |
1.601 |
NaN |
NaN |
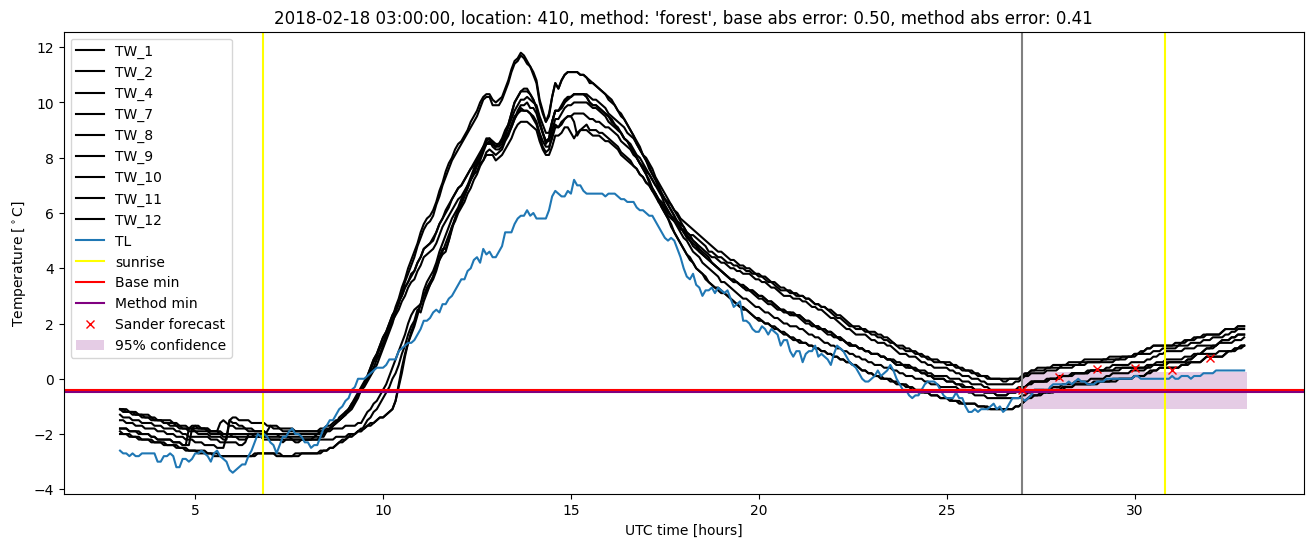
| forest |
winter 2018 |
0.992 |
0.073 |
0.266 |
0.389 |
1.665 |
0.474 |
2.137 |
| baseline |
winter 2019 |
1.000 |
0.107 |
0.620 |
0.533 |
2.699 |
NaN |
NaN |
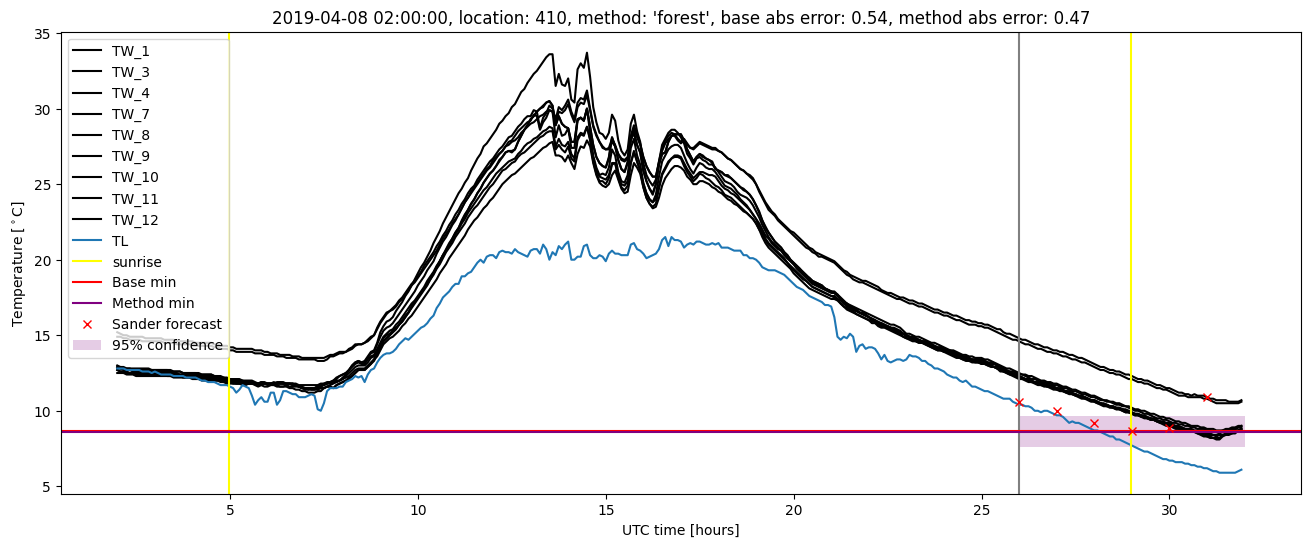
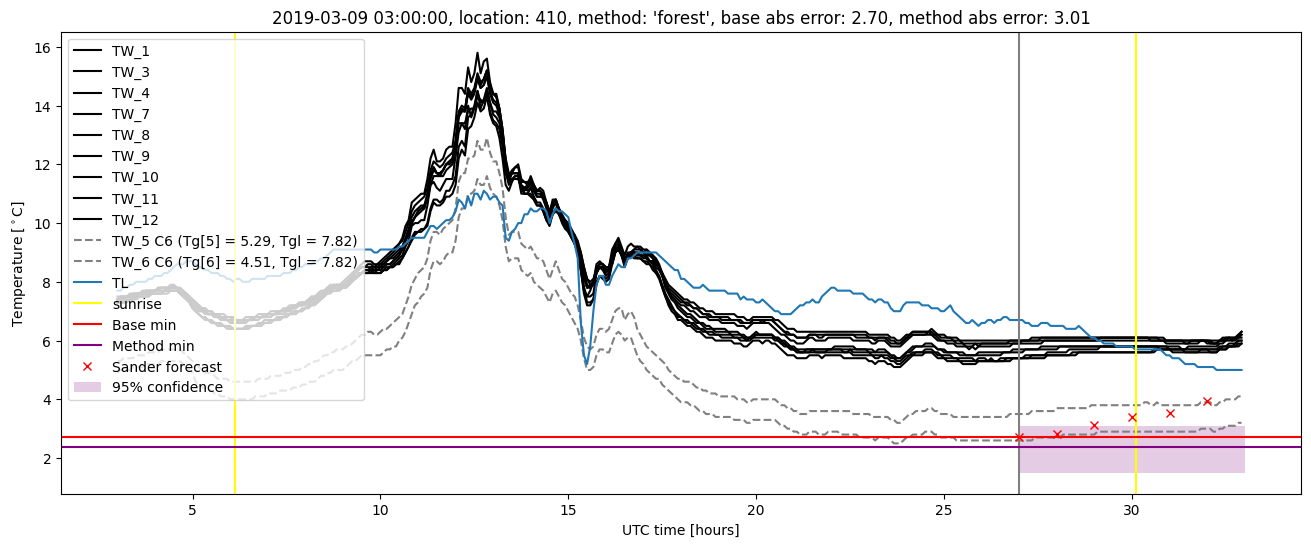
| forest |
winter 2019 |
1.000 |
0.179 |
0.626 |
0.535 |
3.015 |
0.495 |
3.294 |
| baseline |
all |
0.990 |
0.079 |
0.381 |
0.442 |
2.699 |
NaN |
NaN |
| forest |
all |
0.983 |
0.086 |
0.348 |
0.416 |
3.015 |
0.480 |
2.579 |
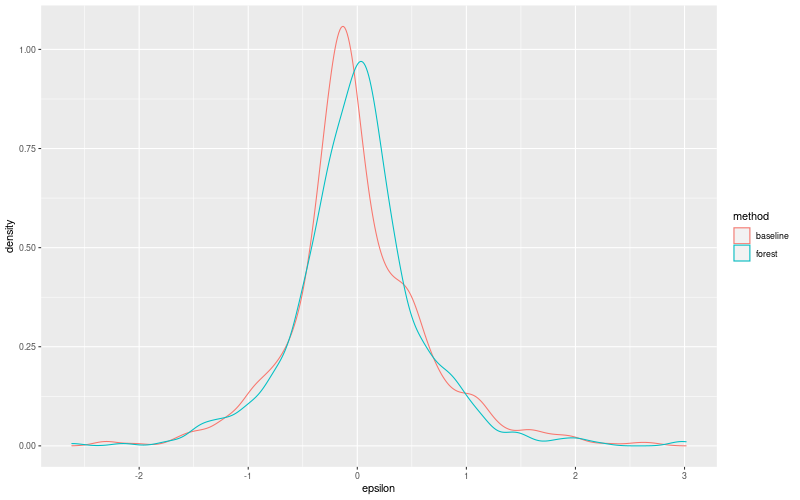
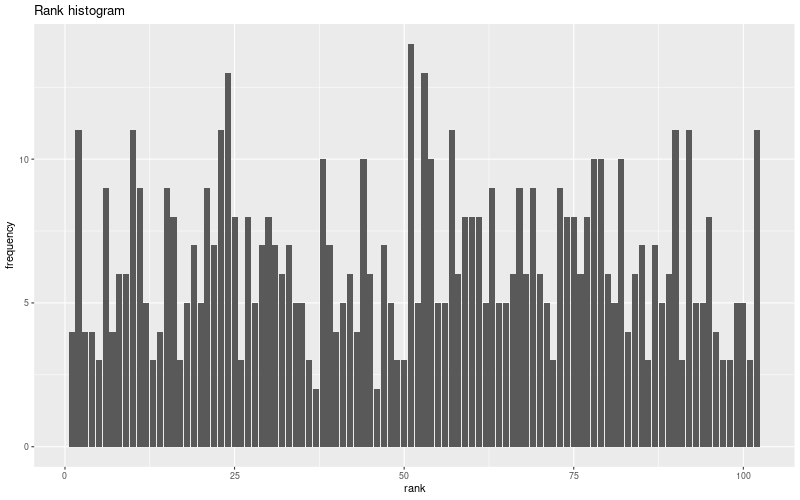
Random forest plots
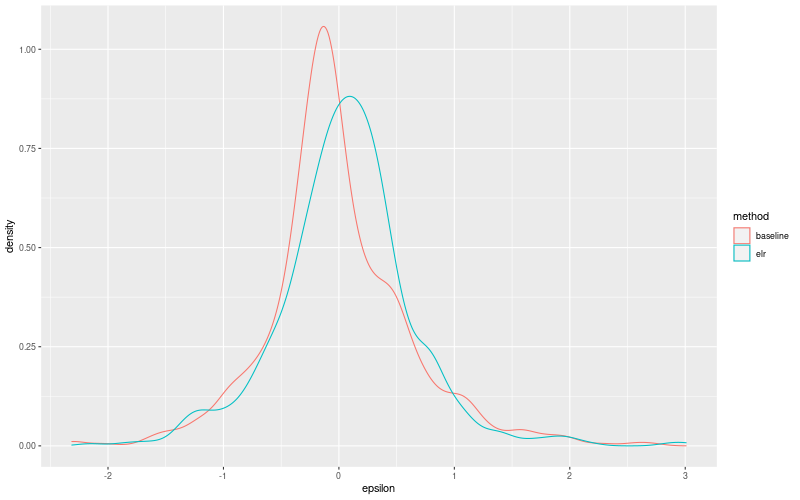
Extended logistic regression results
| names |
period |
power |
significance |
meanSquareError |
absError |
maxError |
CRPS |
IGN |
| baseline |
winter 2016 |
1.000 |
0.103 |
0.340 |
0.414 |
2.313 |
NaN |
NaN |
| elr |
winter 2016 |
0.994 |
0.069 |
0.278 |
0.391 |
2.159 |
0.596 |
4.154 |
| baseline |
winter 2017 |
0.955 |
0.024 |
0.293 |
0.428 |
1.937 |
NaN |
NaN |
| elr |
winter 2017 |
0.946 |
0.024 |
0.216 |
0.363 |
1.399 |
0.535 |
2.946 |
| baseline |
winter 2018 |
1.000 |
0.098 |
0.297 |
0.407 |
1.601 |
NaN |
NaN |
| elr |
winter 2018 |
1.000 |
0.073 |
0.262 |
0.397 |
1.741 |
0.550 |
3.228 |
| baseline |
winter 2019 |
1.000 |
0.107 |
0.620 |
0.533 |
2.699 |
NaN |
NaN |
| elr |
winter 2019 |
1.000 |
0.214 |
0.654 |
0.562 |
3.008 |
0.551 |
5.968 |
| baseline |
all |
0.990 |
0.079 |
0.381 |
0.442 |
2.699 |
NaN |
NaN |
| elr |
all |
0.987 |
0.086 |
0.344 |
0.425 |
3.008 |
0.560 |
4.046 |
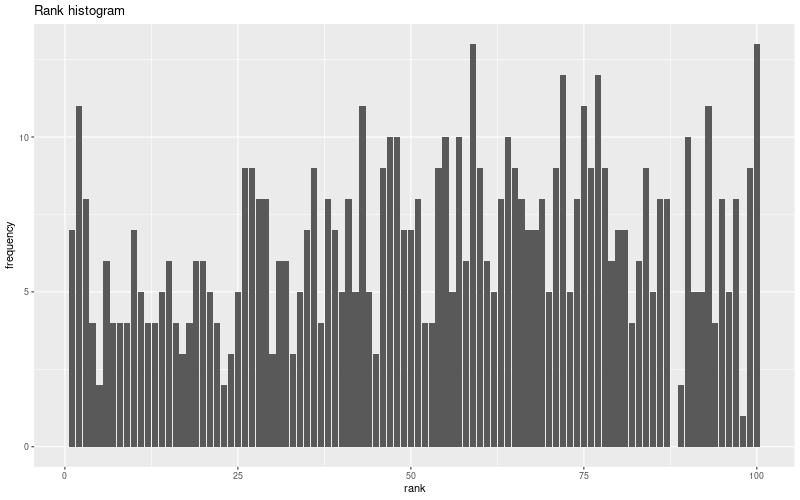
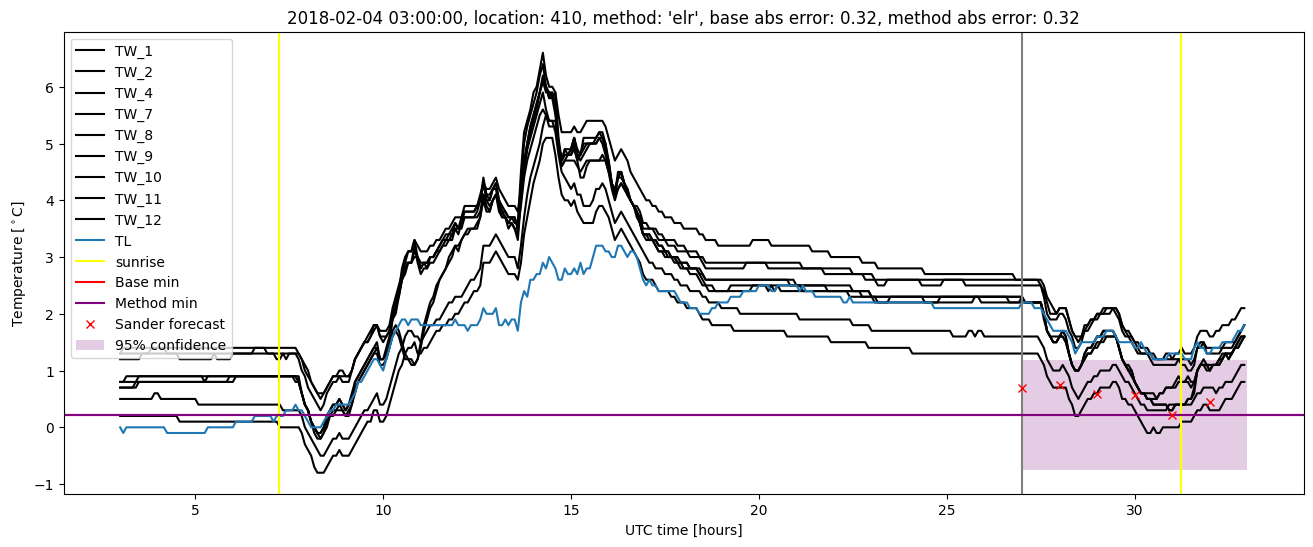
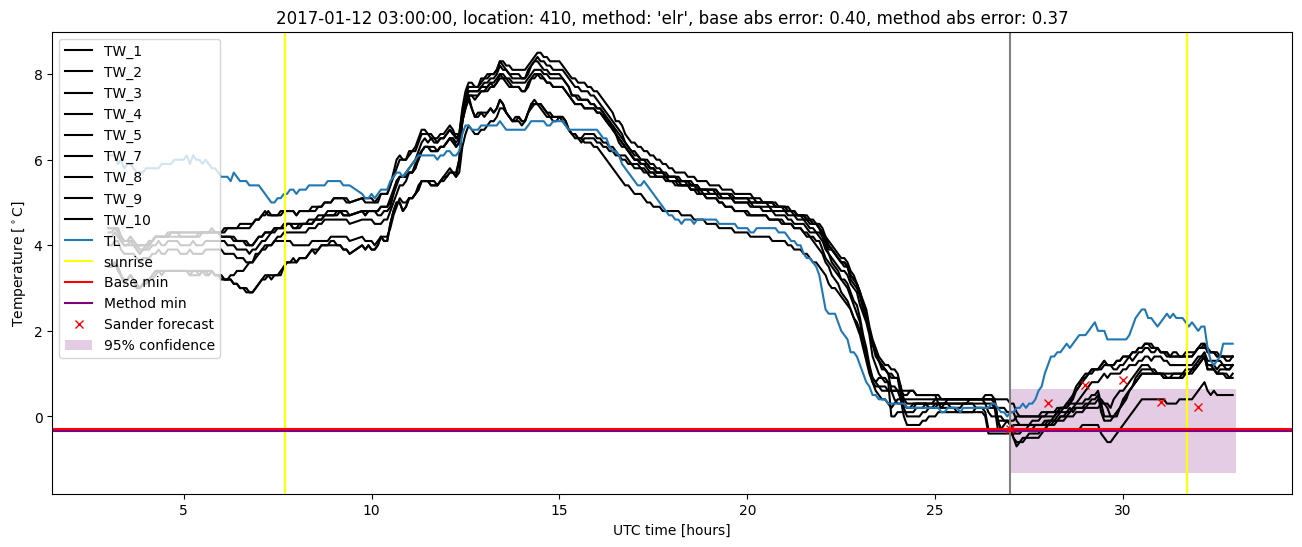
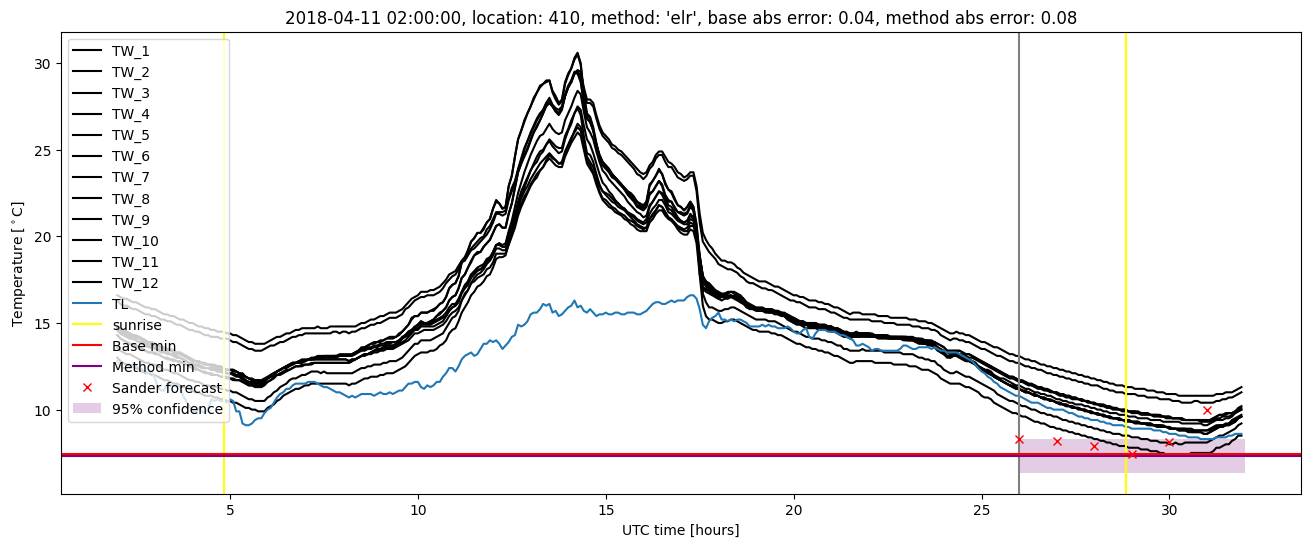
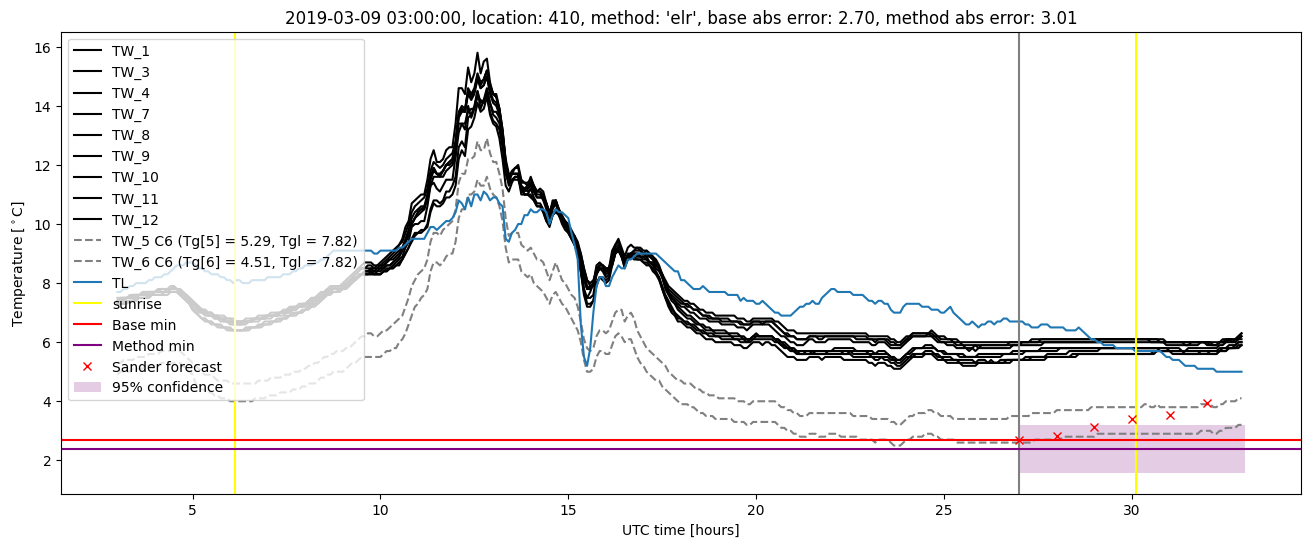
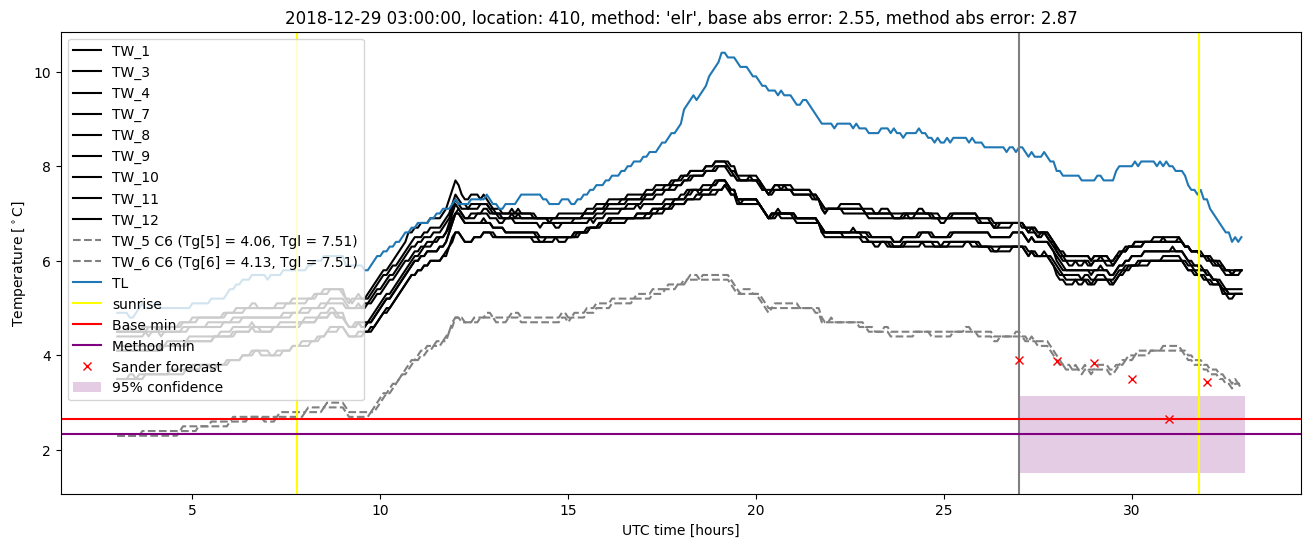
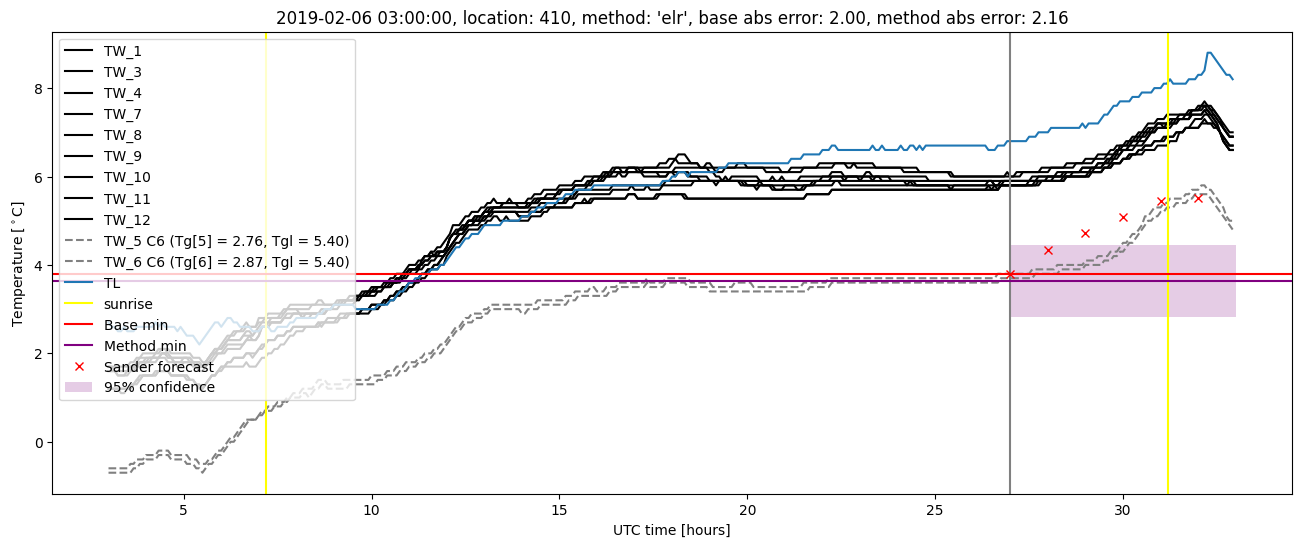
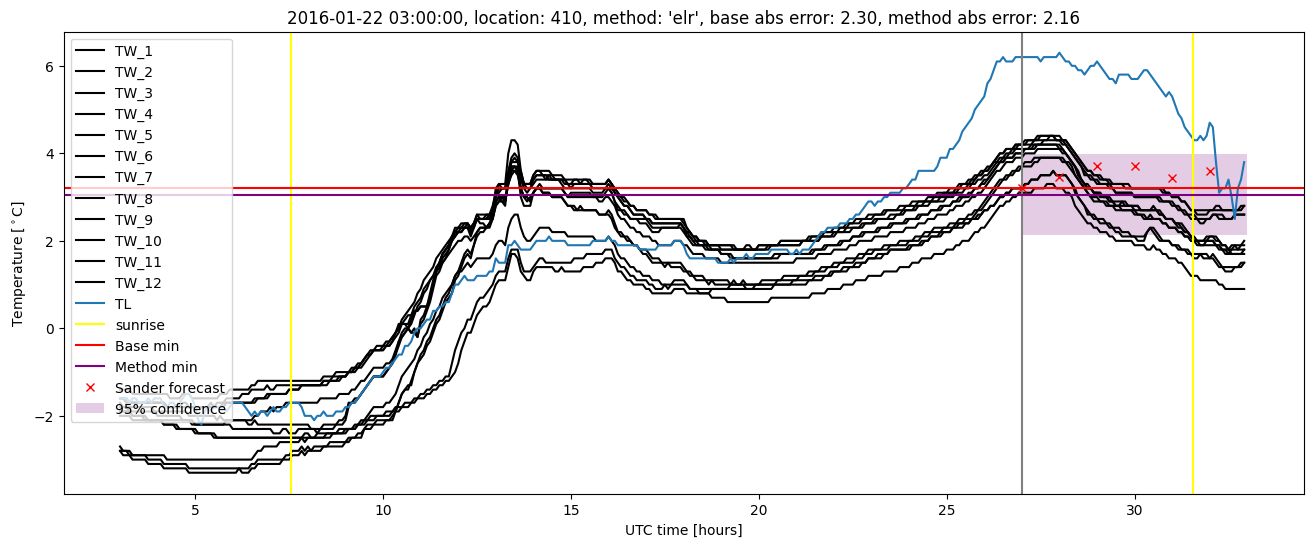
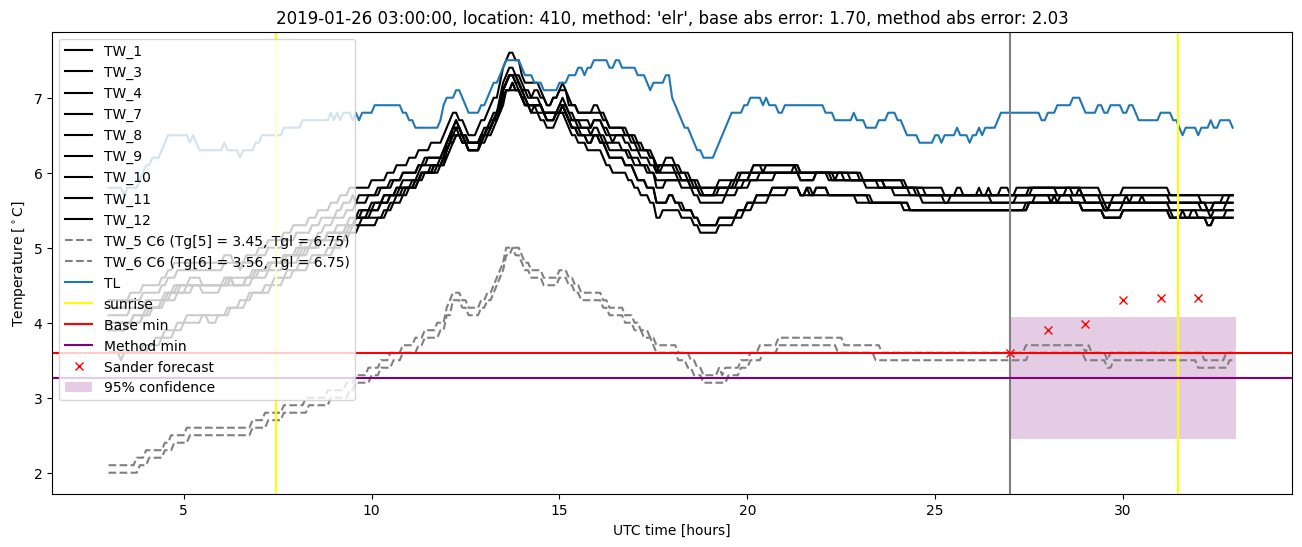
Extended logistic regression plots