GMS location: 382
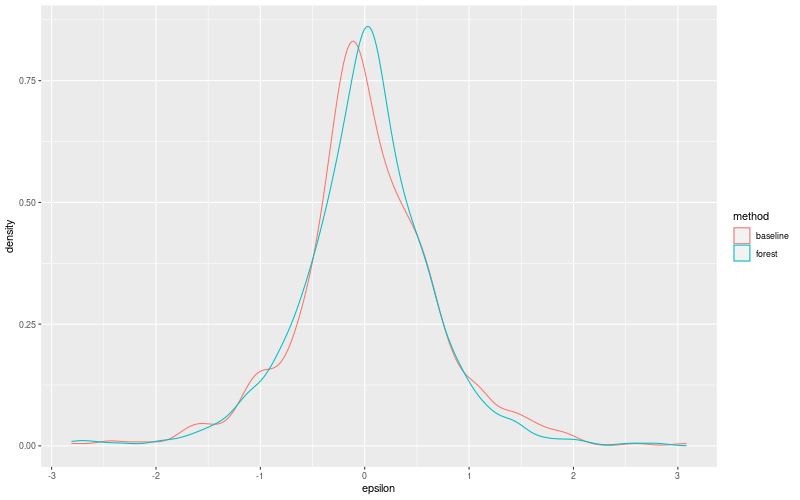
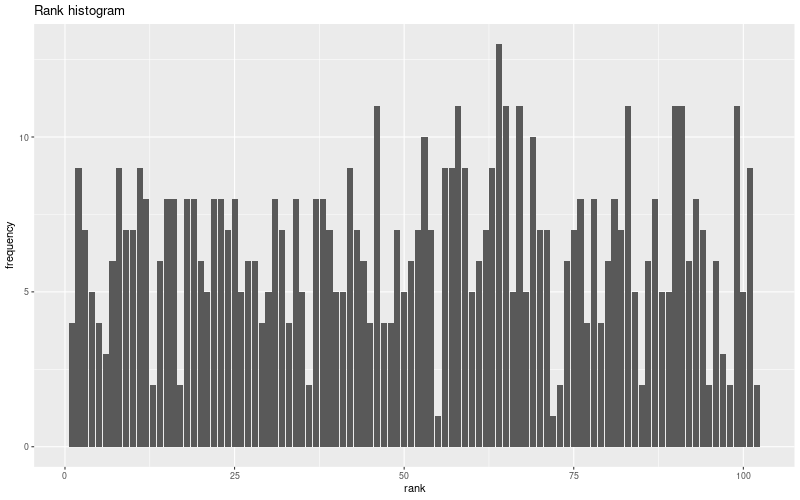
Random forest results
| names |
period |
power |
significance |
meanSquareError |
absError |
maxError |
CRPS |
IGN |
| baseline |
winter 2016 |
0.966 |
0.130 |
0.368 |
0.459 |
1.734 |
NaN |
NaN |
| forest |
winter 2016 |
0.973 |
0.217 |
0.335 |
0.439 |
1.576 |
0.456 |
1.983 |
| baseline |
winter 2017 |
0.973 |
0.071 |
0.463 |
0.504 |
3.080 |
NaN |
NaN |
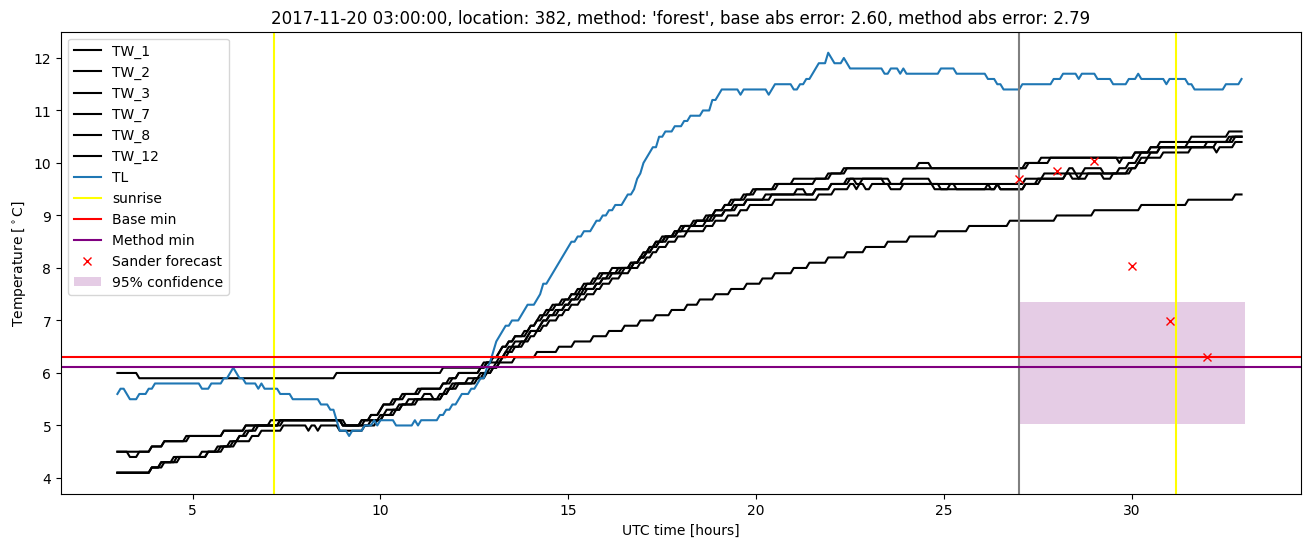
| forest |
winter 2017 |
0.964 |
0.048 |
0.386 |
0.467 |
2.530 |
0.472 |
2.188 |
| baseline |
winter 2018 |
1.000 |
0.128 |
0.490 |
0.507 |
2.599 |
NaN |
NaN |
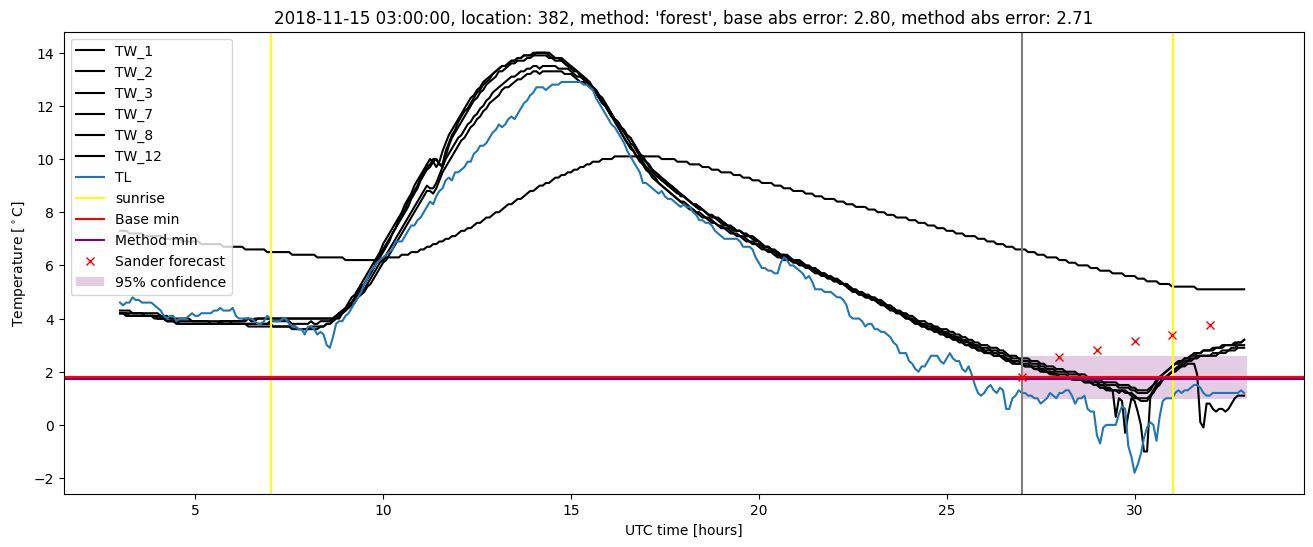
| forest |
winter 2018 |
0.993 |
0.051 |
0.470 |
0.484 |
2.793 |
0.456 |
1.822 |
| baseline |
winter 2019 |
1.000 |
0.091 |
0.515 |
0.497 |
2.805 |
NaN |
NaN |
| forest |
winter 2019 |
1.000 |
0.091 |
0.433 |
0.450 |
2.806 |
0.443 |
1.835 |
| baseline |
all |
0.985 |
0.103 |
0.459 |
0.492 |
3.080 |
NaN |
NaN |
| forest |
all |
0.983 |
0.087 |
0.407 |
0.460 |
2.806 |
0.457 |
1.950 |
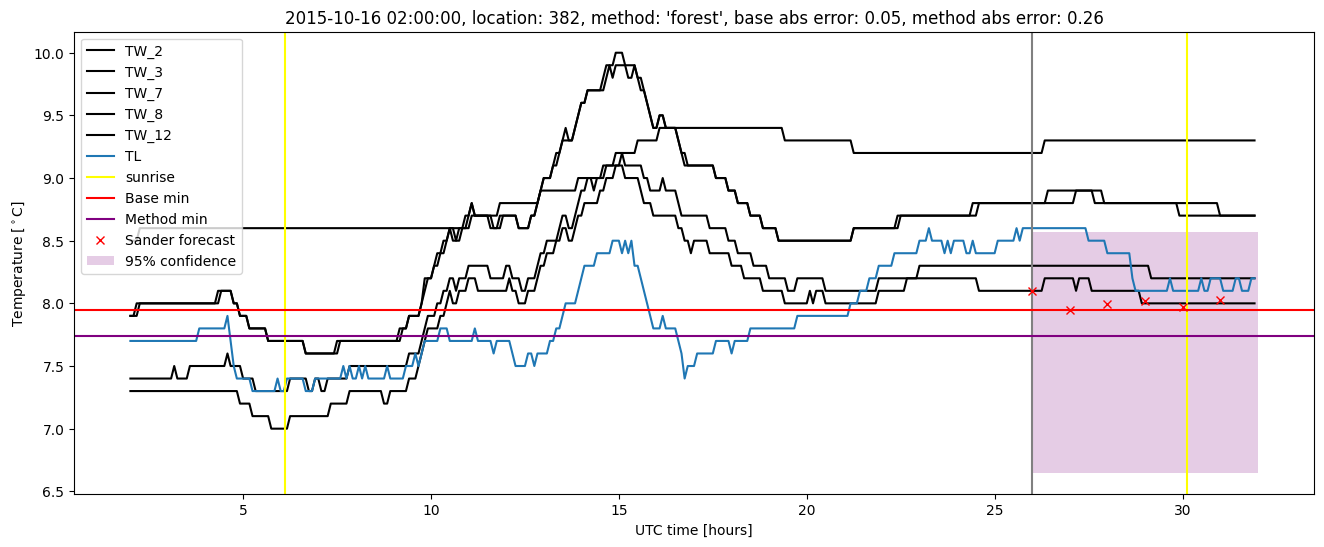
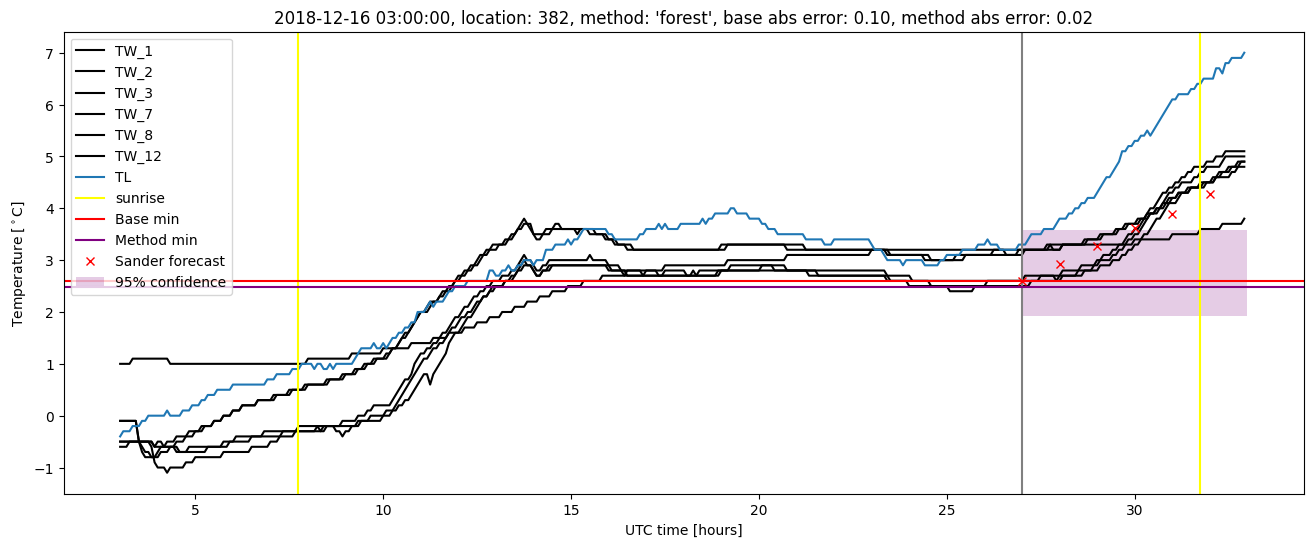
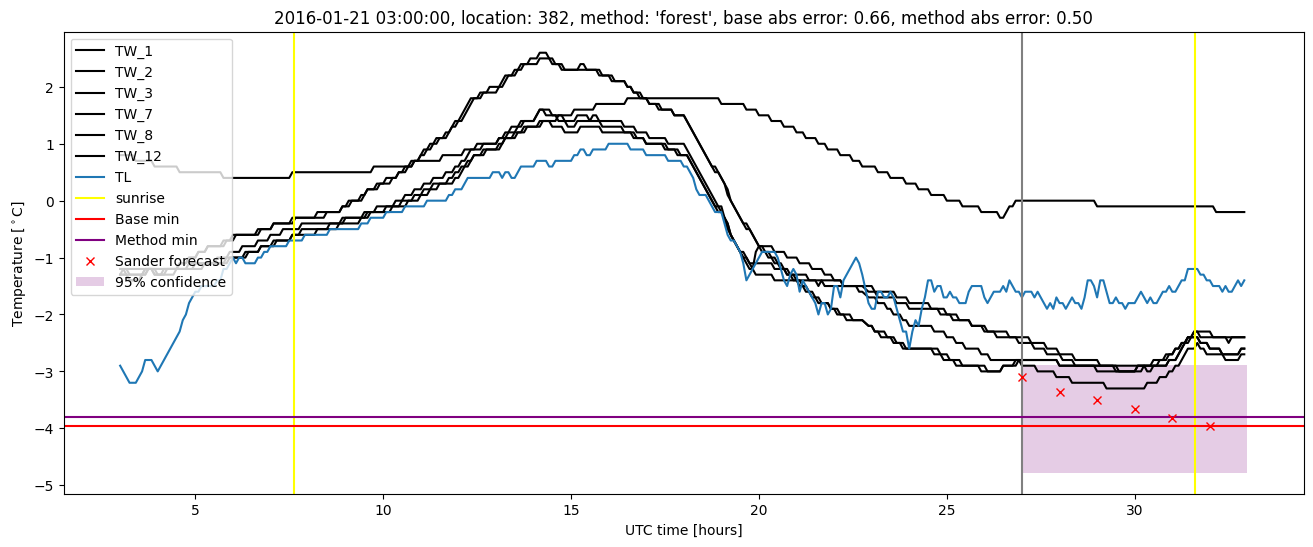
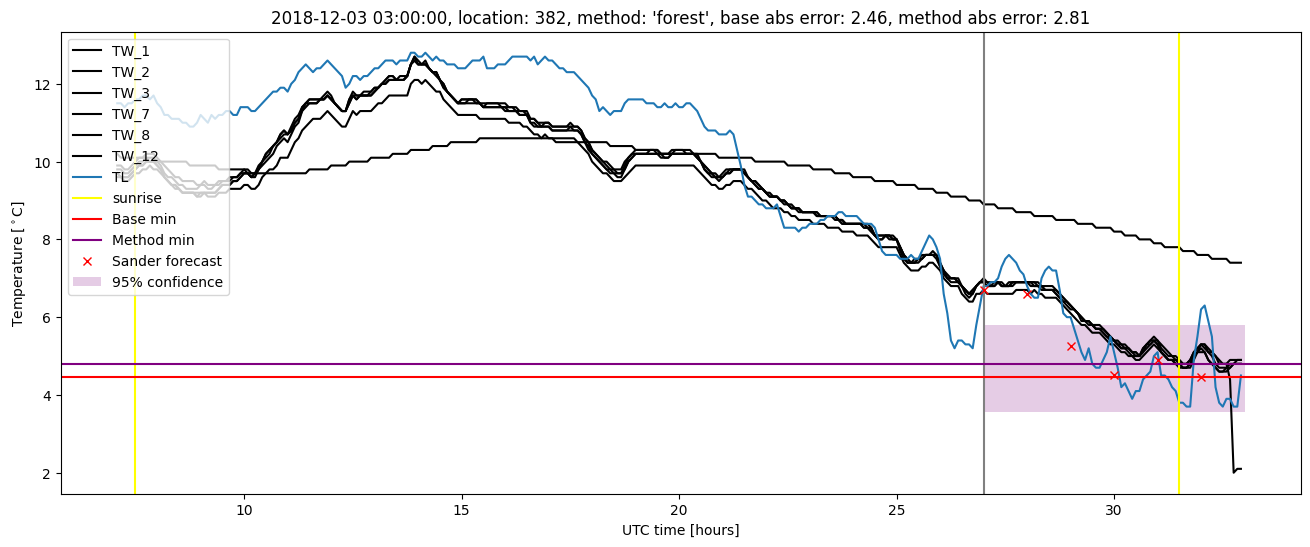
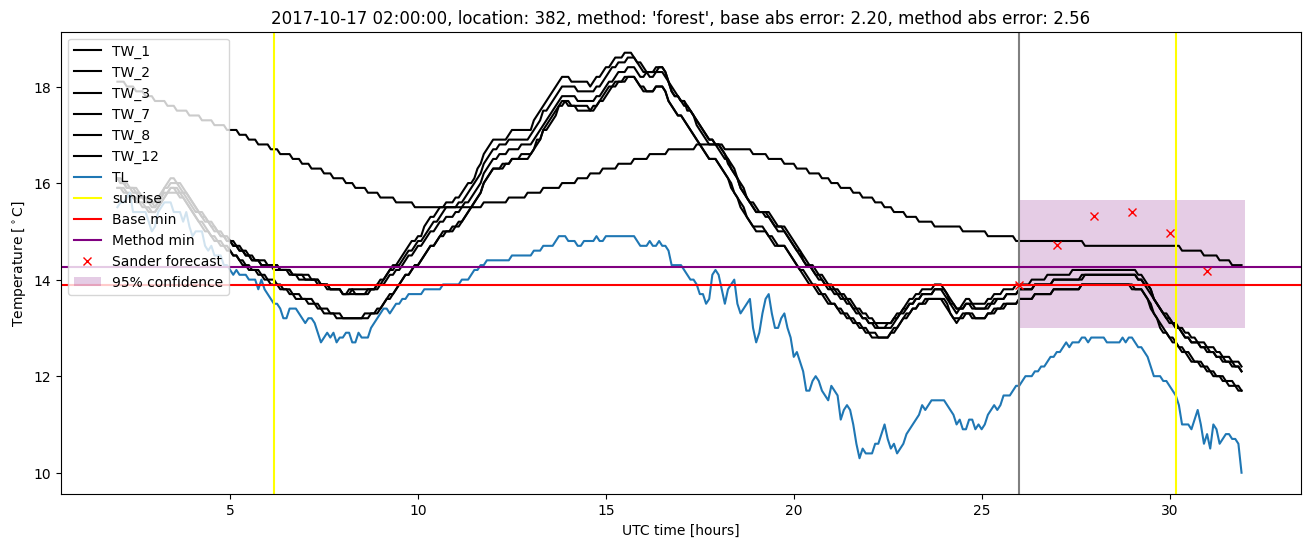
Random forest plots

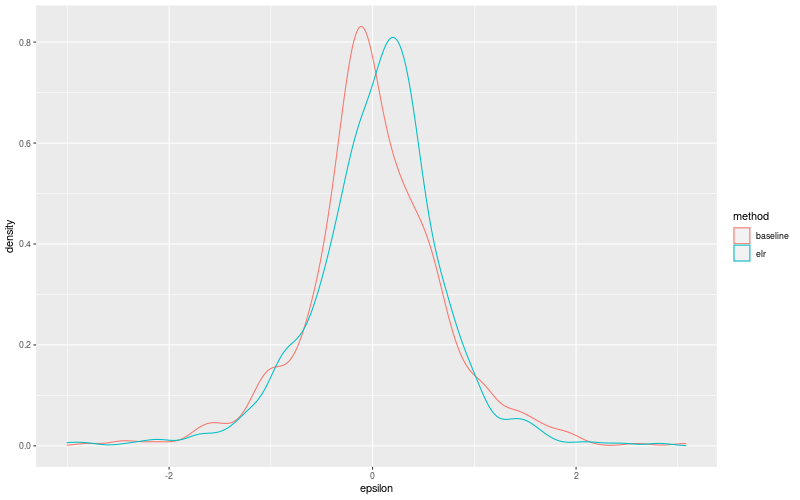
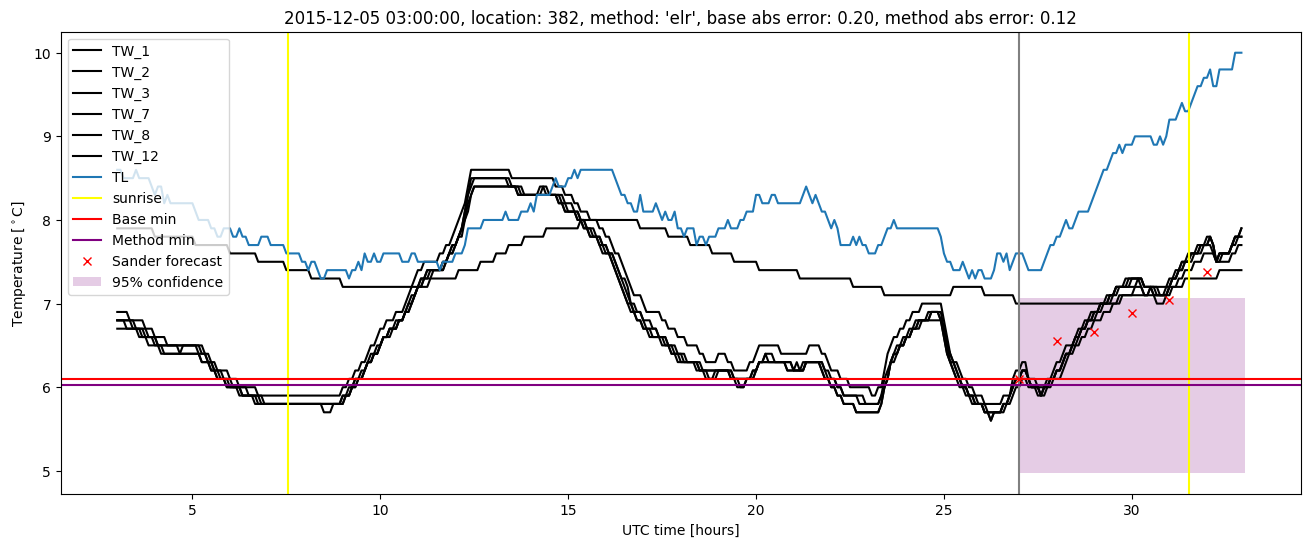
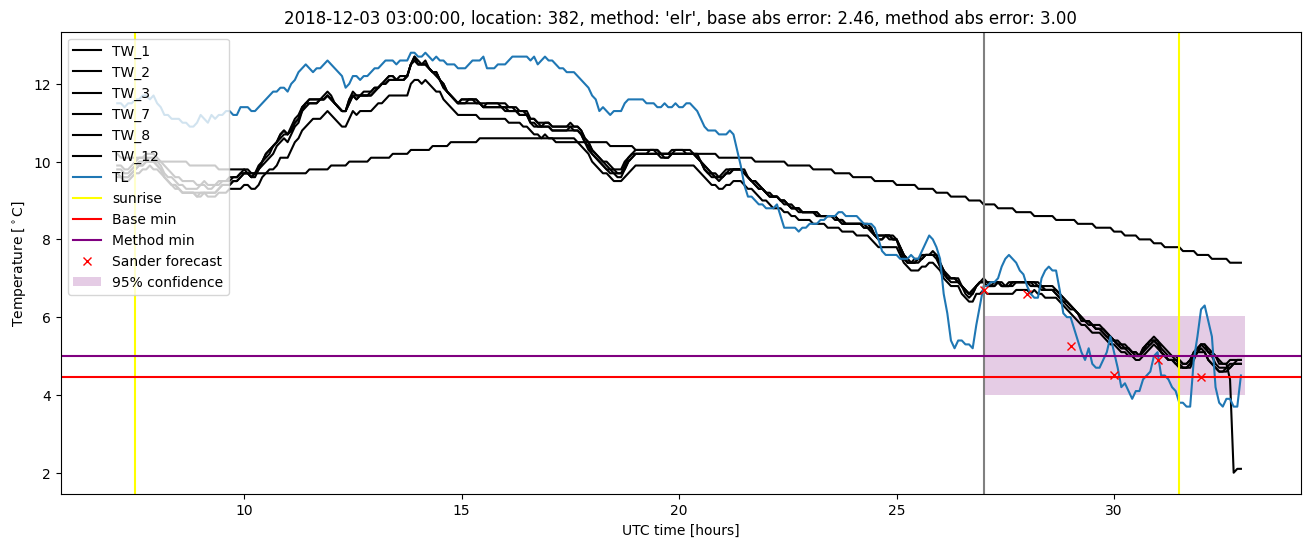
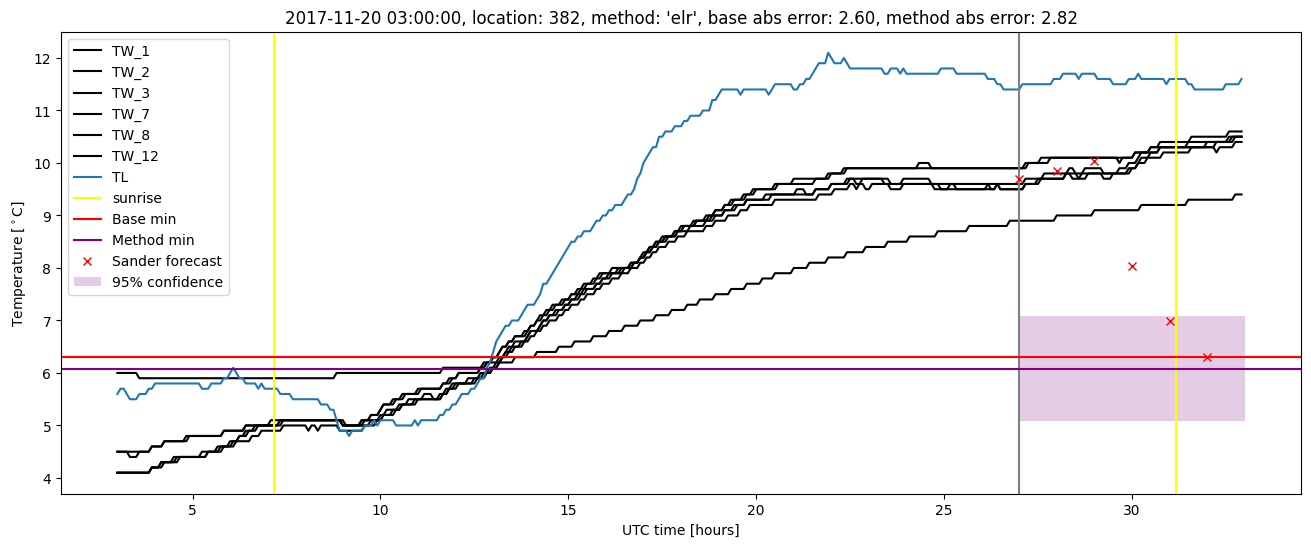
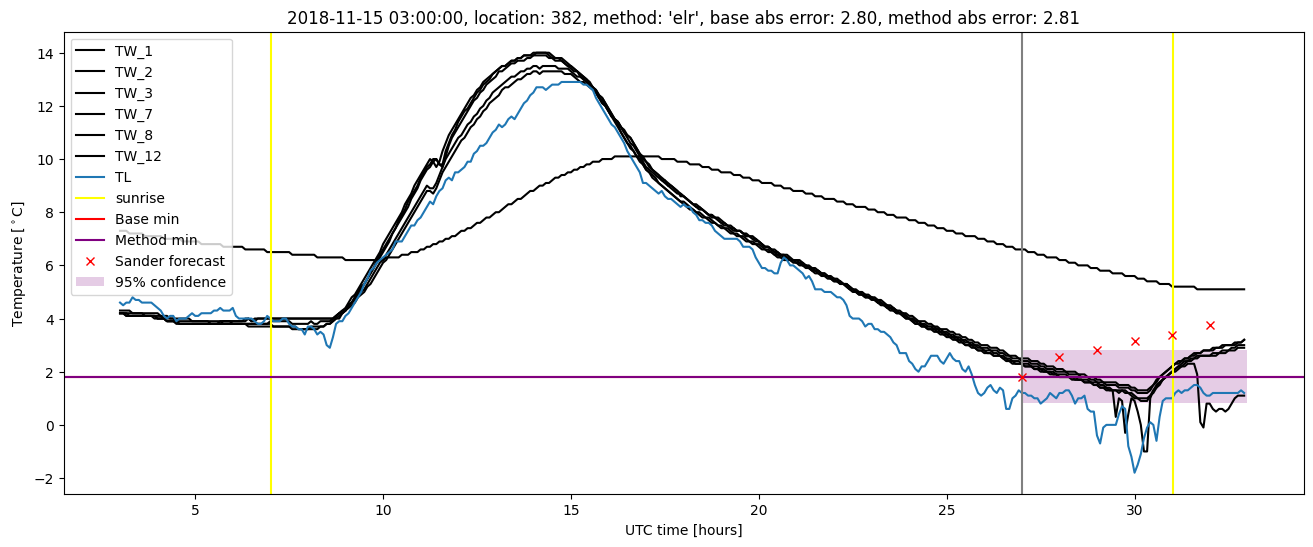
Extended logistic regression results
| names |
period |
power |
significance |
meanSquareError |
absError |
maxError |
CRPS |
IGN |
| baseline |
winter 2016 |
0.966 |
0.130 |
0.368 |
0.459 |
1.734 |
NaN |
NaN |
| elr |
winter 2016 |
0.973 |
0.217 |
0.337 |
0.456 |
1.706 |
0.513 |
2.303 |
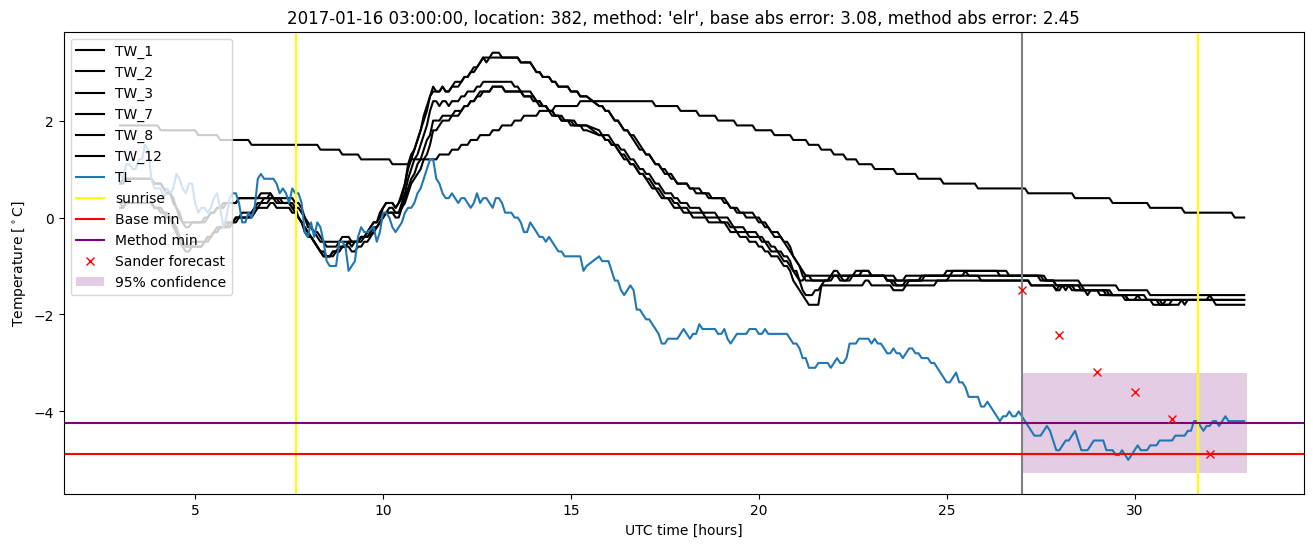
| baseline |
winter 2017 |
0.973 |
0.071 |
0.463 |
0.504 |
3.080 |
NaN |
NaN |
| elr |
winter 2017 |
0.973 |
0.024 |
0.402 |
0.486 |
2.445 |
0.561 |
2.812 |
| baseline |
winter 2018 |
1.000 |
0.128 |
0.490 |
0.507 |
2.599 |
NaN |
NaN |
| elr |
winter 2018 |
0.993 |
0.051 |
0.453 |
0.490 |
2.819 |
0.517 |
2.611 |
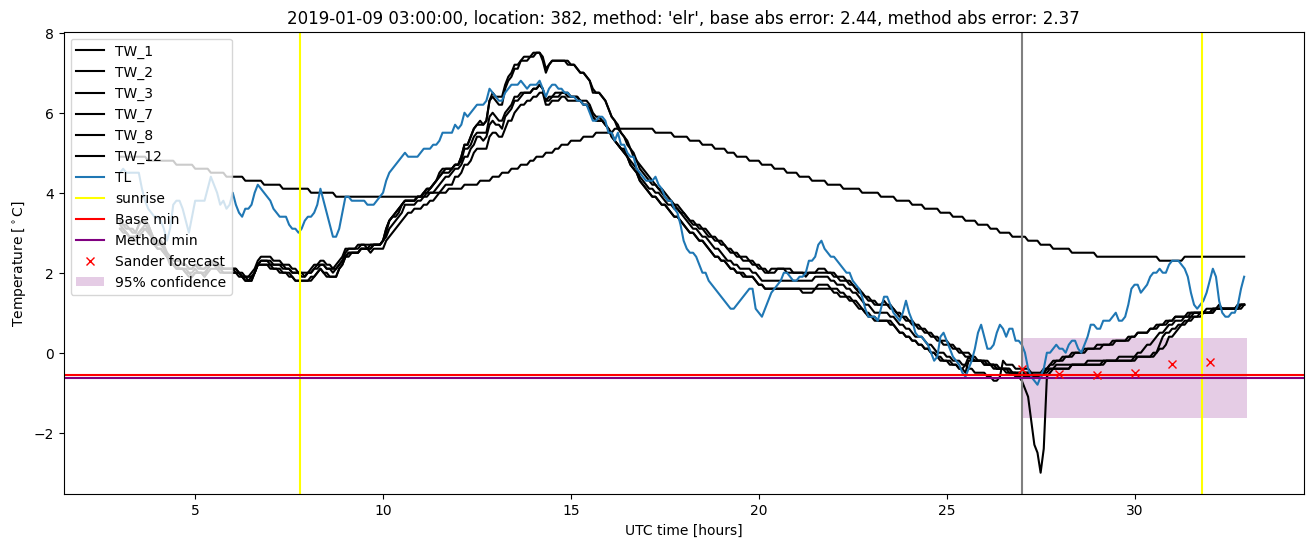
| baseline |
winter 2019 |
1.000 |
0.091 |
0.515 |
0.497 |
2.805 |
NaN |
NaN |
| elr |
winter 2019 |
1.000 |
0.091 |
0.443 |
0.457 |
3.003 |
0.488 |
2.297 |
| baseline |
all |
0.985 |
0.103 |
0.459 |
0.492 |
3.080 |
NaN |
NaN |
| elr |
all |
0.985 |
0.079 |
0.409 |
0.472 |
3.003 |
0.519 |
2.501 |
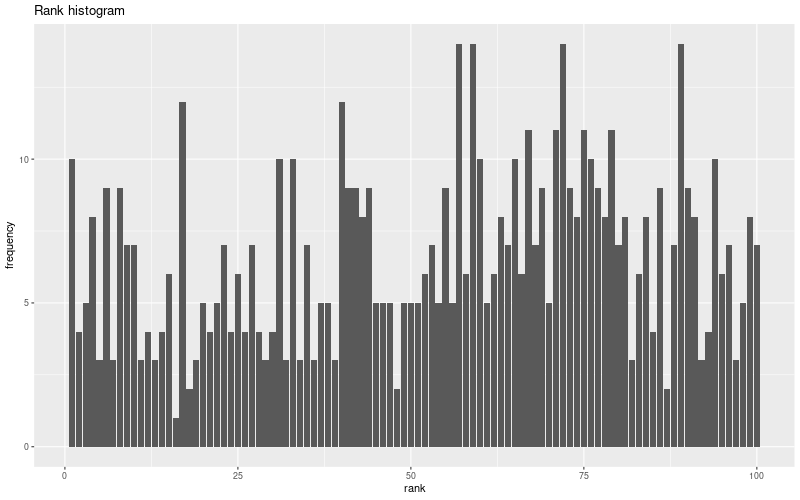
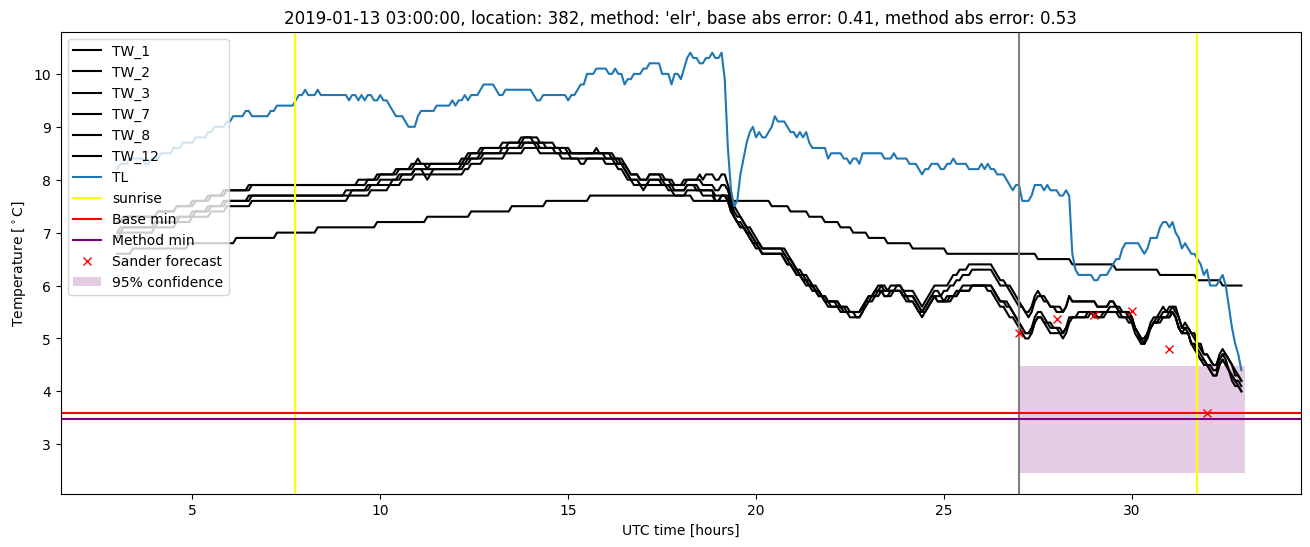
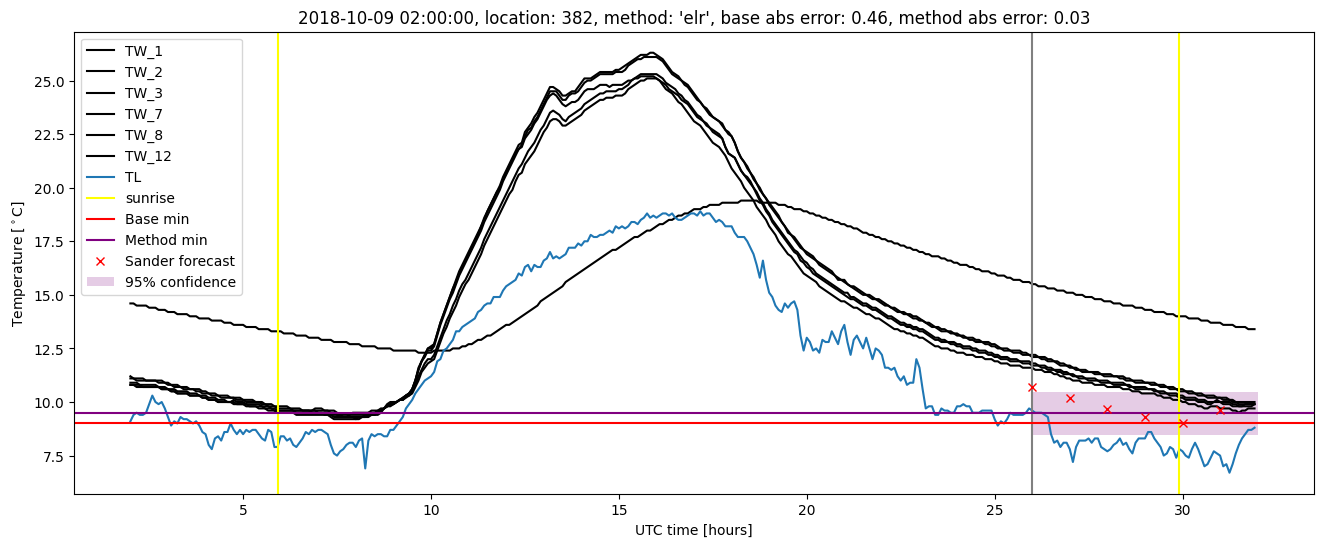
Extended logistic regression plots