GMS location: 381
Random forest results
| names |
period |
power |
significance |
meanSquareError |
absError |
maxError |
CRPS |
IGN |
| baseline |
winter 2016 |
0.986 |
0.000e+00 |
0.347 |
0.442 |
1.712 |
NaN |
NaN |
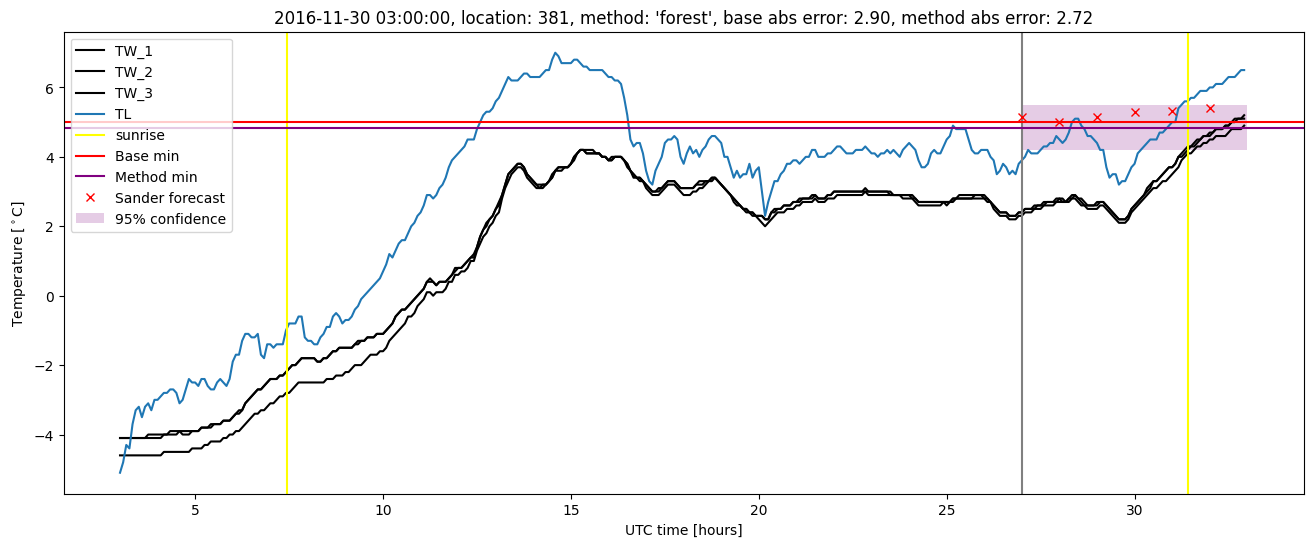
| forest |
winter 2016 |
1.000 |
0.100 |
0.292 |
0.423 |
1.408 |
0.417 |
1.998 |
| baseline |
winter 2017 |
0.966 |
0.118 |
0.633 |
0.558 |
2.985 |
NaN |
NaN |
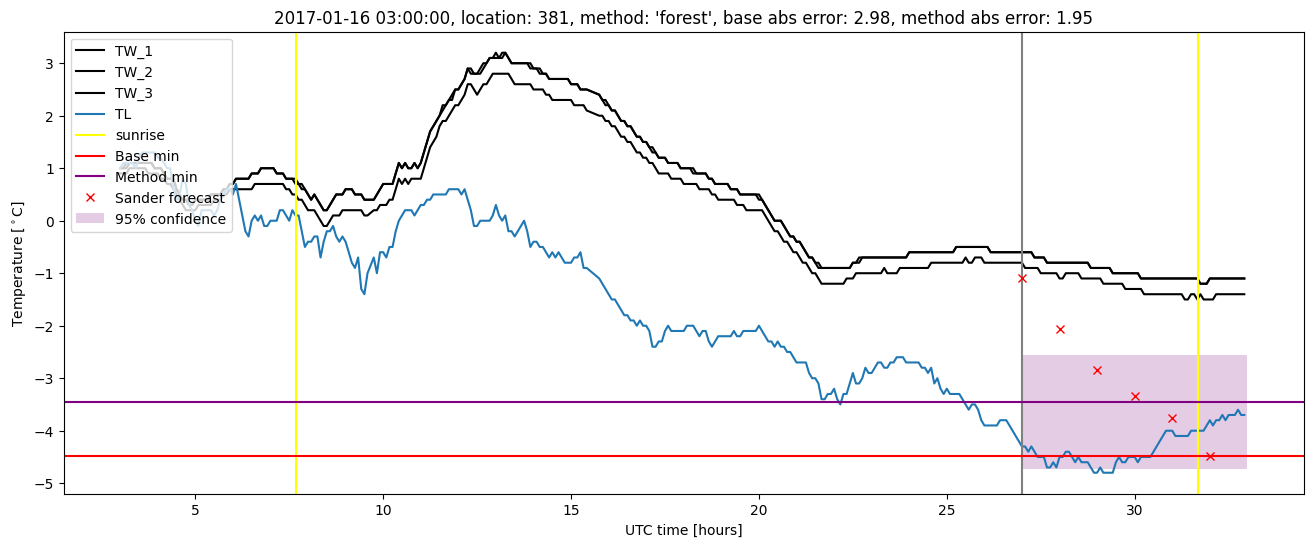
| forest |
winter 2017 |
0.975 |
0.147 |
0.520 |
0.501 |
2.885 |
0.434 |
3.184 |
| baseline |
winter 2018 |
0.986 |
0.125 |
0.359 |
0.460 |
1.961 |
NaN |
NaN |
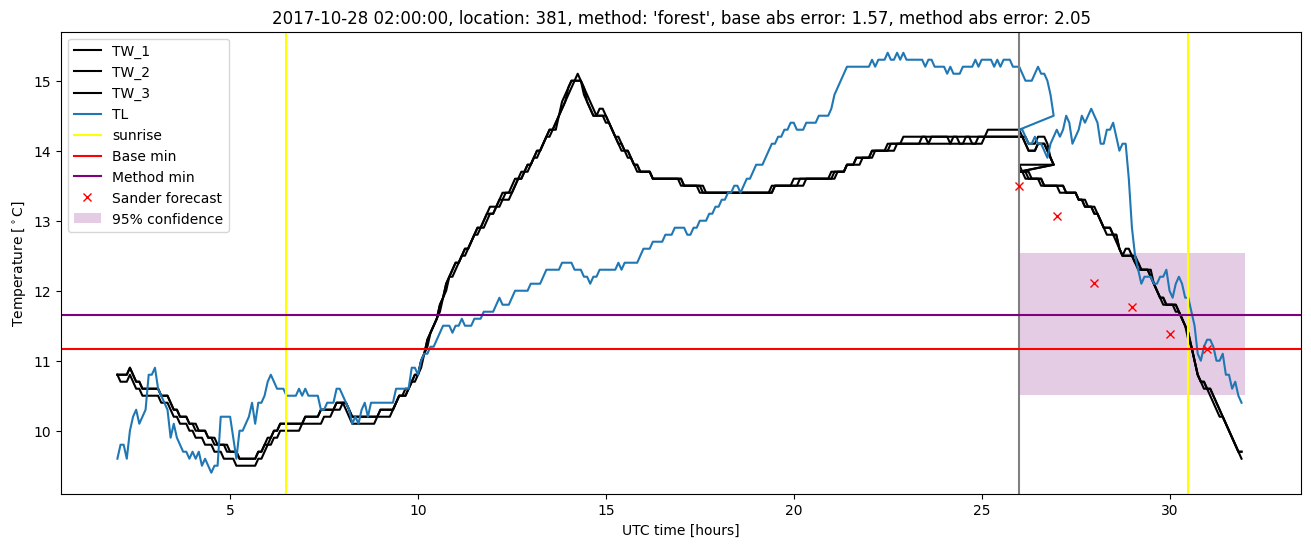
| forest |
winter 2018 |
0.993 |
0.125 |
0.337 |
0.440 |
2.048 |
0.415 |
1.511 |
| baseline |
winter 2019 |
0.984 |
0.000e+00 |
0.355 |
0.441 |
2.195 |
NaN |
NaN |
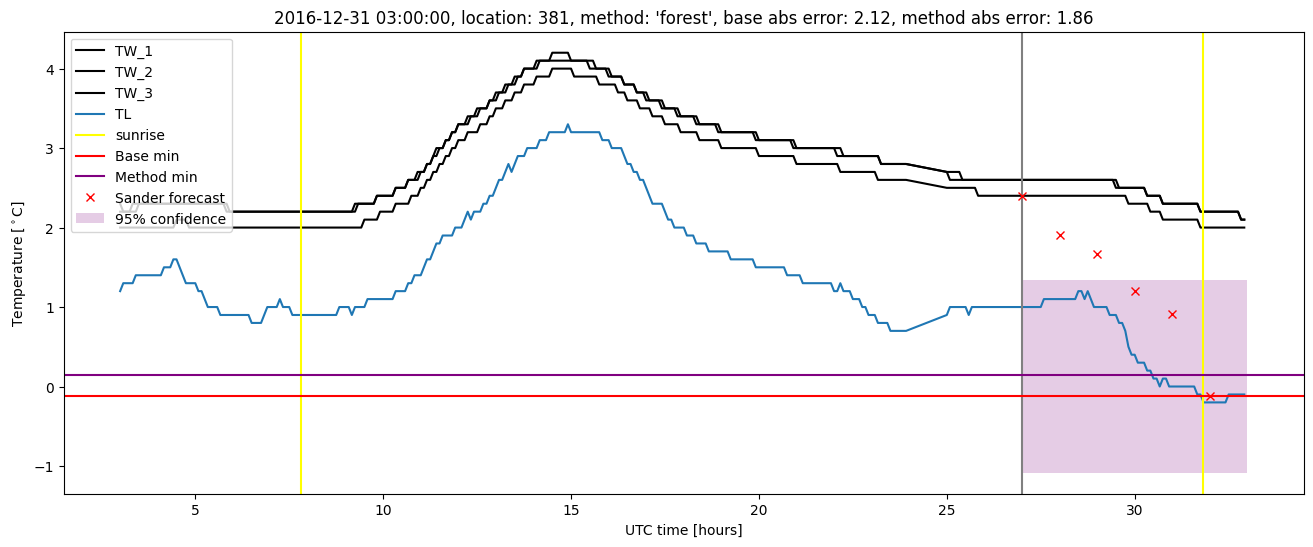
| forest |
winter 2019 |
0.984 |
0.000e+00 |
0.256 |
0.376 |
1.815 |
0.414 |
1.500 |
| baseline |
all |
0.981 |
0.076 |
0.422 |
0.475 |
2.985 |
NaN |
NaN |
| forest |
all |
0.989 |
0.109 |
0.351 |
0.436 |
2.885 |
0.420 |
2.047 |
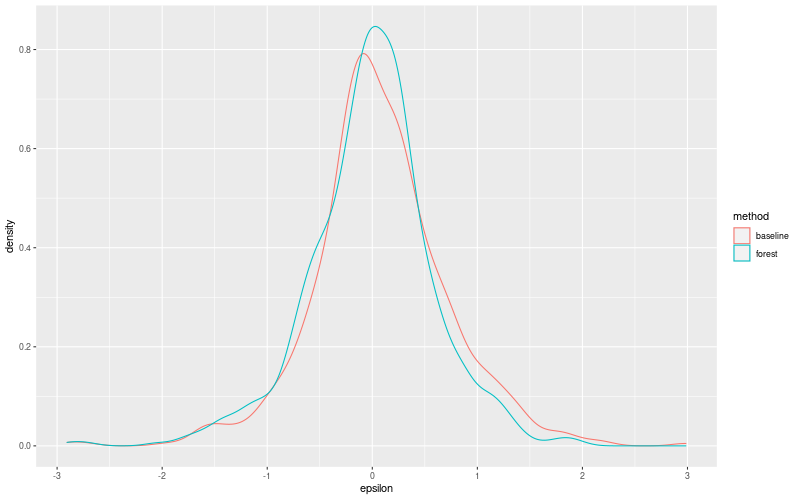
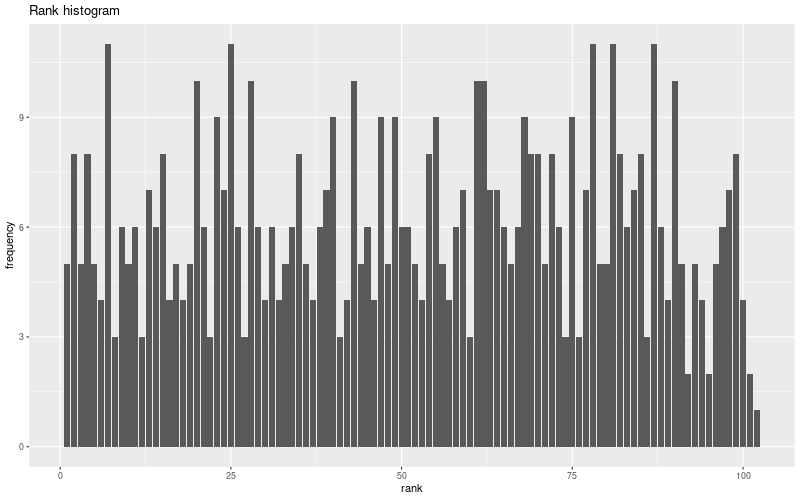
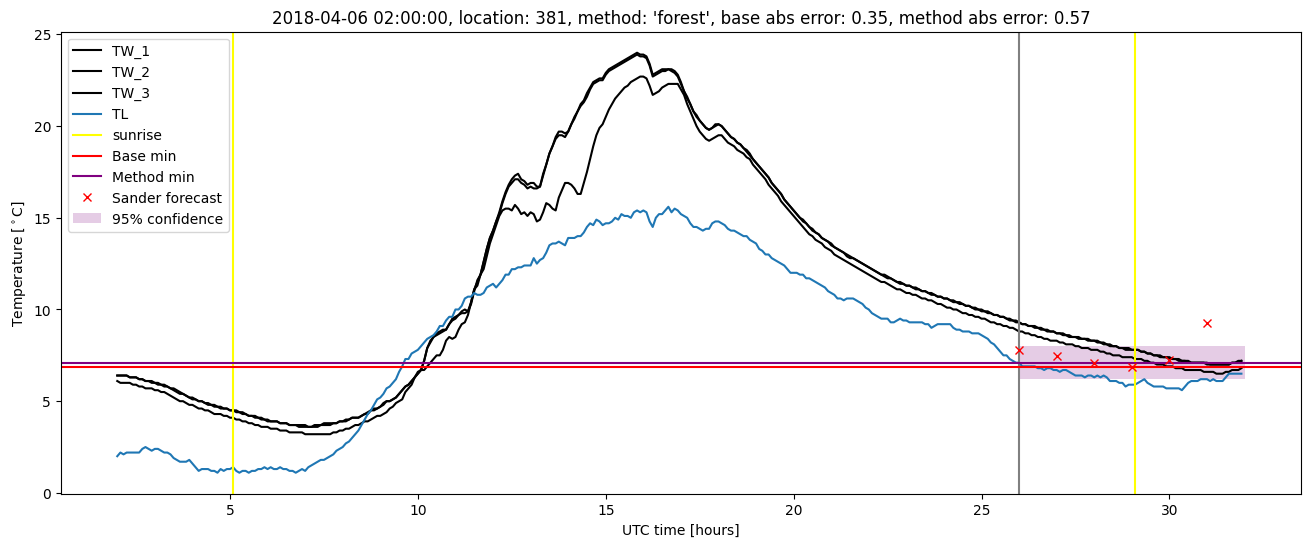
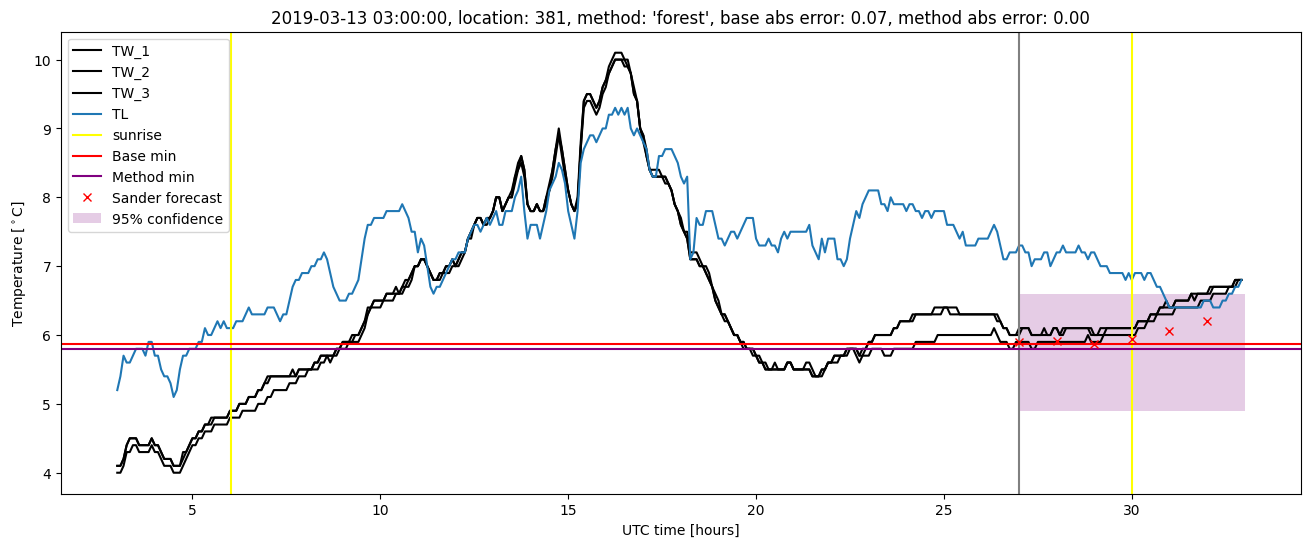
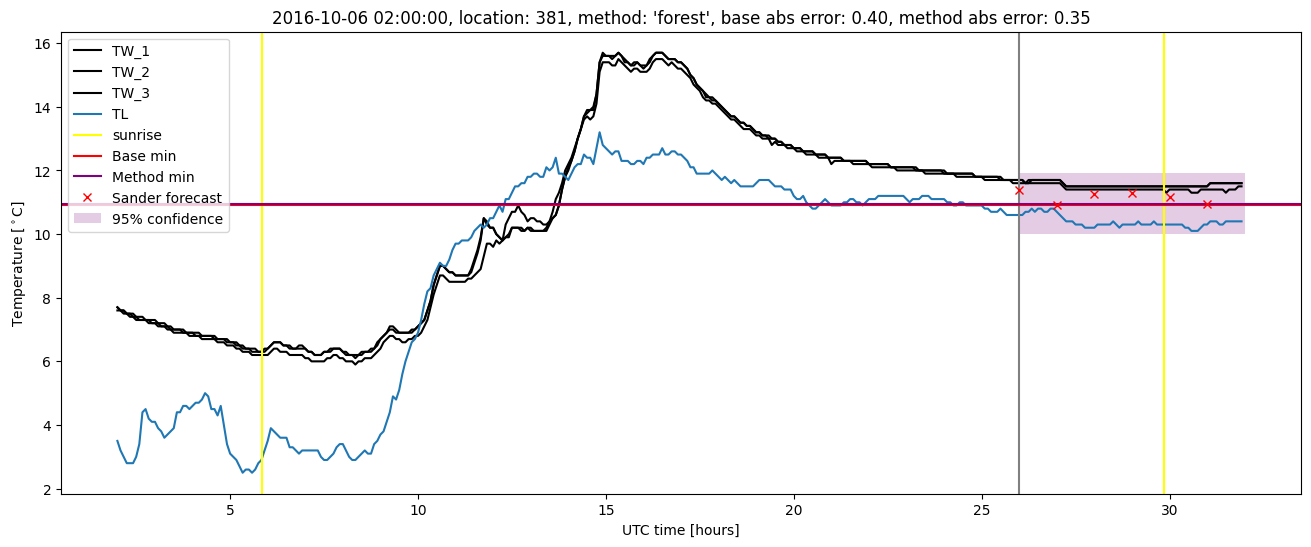
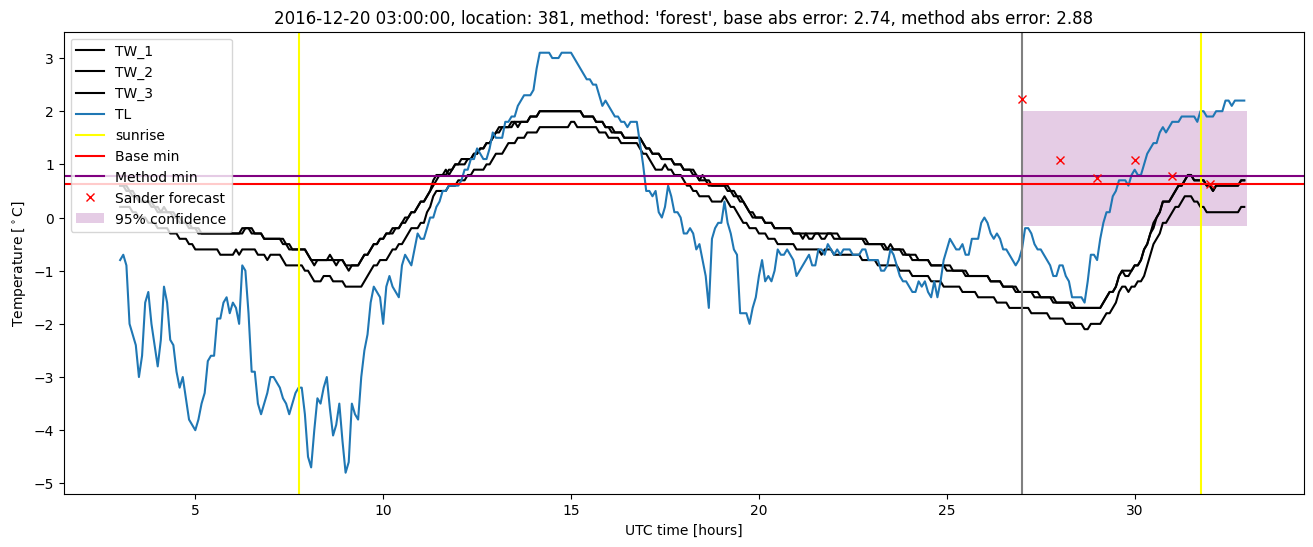
Random forest plots
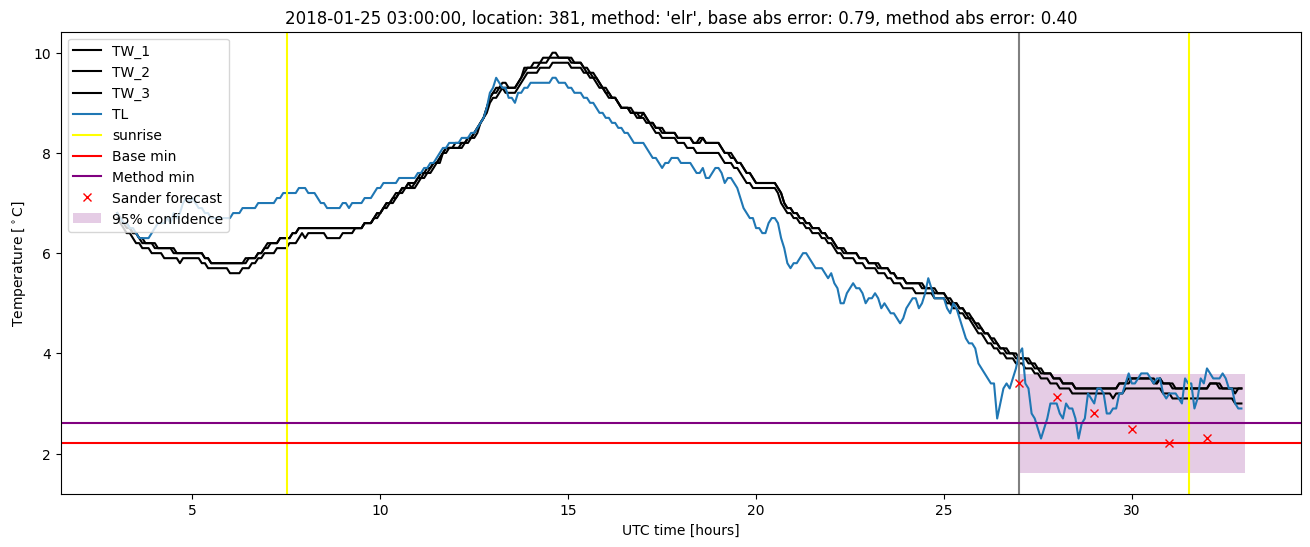
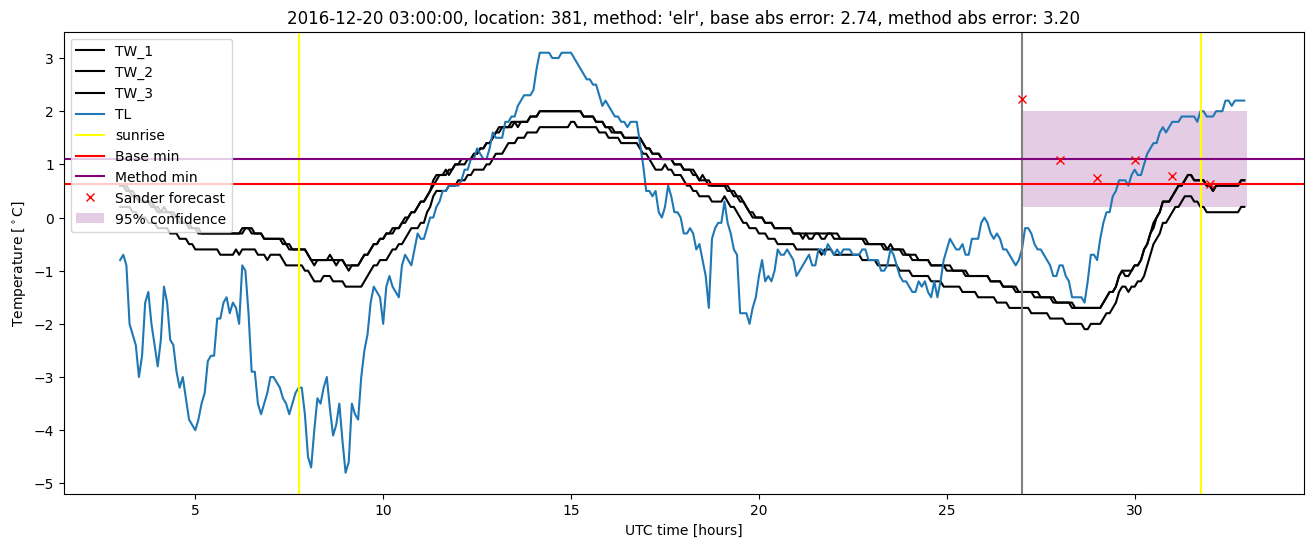
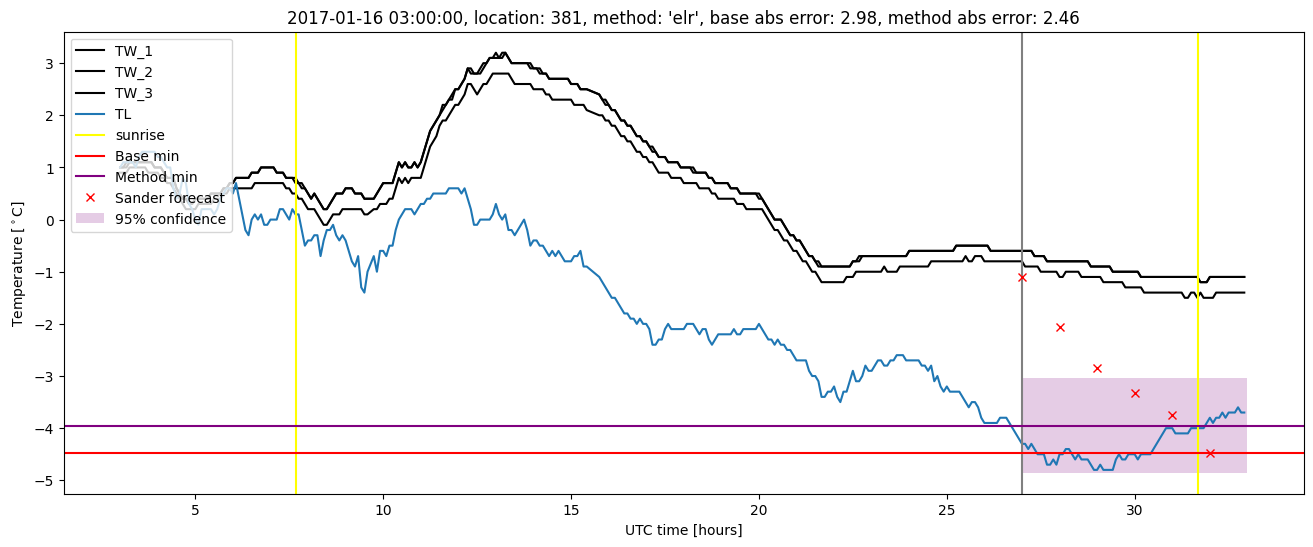
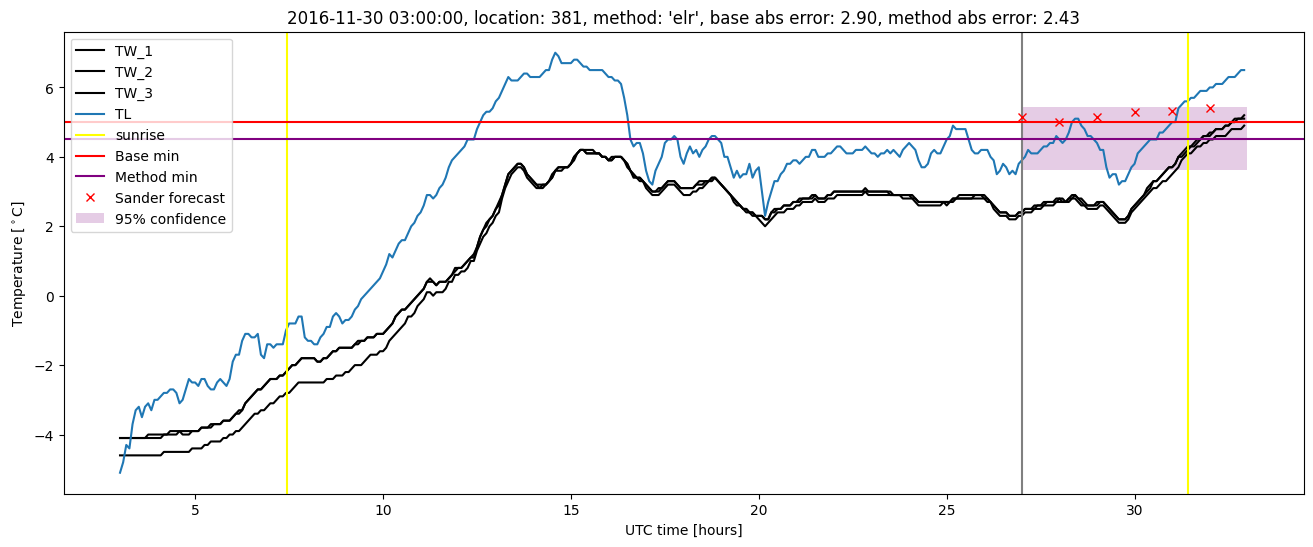
Extended logistic regression results
| names |
period |
power |
significance |
meanSquareError |
absError |
maxError |
CRPS |
IGN |
| baseline |
winter 2016 |
0.986 |
0.000e+00 |
0.347 |
0.442 |
1.712 |
NaN |
NaN |
| elr |
winter 2016 |
0.993 |
0.100 |
0.323 |
0.454 |
1.502 |
0.441 |
2.076 |
| baseline |
winter 2017 |
0.966 |
0.118 |
0.633 |
0.558 |
2.985 |
NaN |
NaN |
| elr |
winter 2017 |
0.966 |
0.147 |
0.571 |
0.531 |
3.199 |
0.442 |
2.630 |
| baseline |
winter 2018 |
0.986 |
0.125 |
0.359 |
0.460 |
1.961 |
NaN |
NaN |
| elr |
winter 2018 |
0.993 |
0.125 |
0.374 |
0.477 |
2.102 |
0.466 |
2.252 |
| baseline |
winter 2019 |
0.984 |
0.000e+00 |
0.355 |
0.441 |
2.195 |
NaN |
NaN |
| elr |
winter 2019 |
0.984 |
0.000e+00 |
0.317 |
0.425 |
1.967 |
0.461 |
2.083 |
| baseline |
all |
0.981 |
0.076 |
0.422 |
0.475 |
2.985 |
NaN |
NaN |
| elr |
all |
0.985 |
0.109 |
0.396 |
0.472 |
3.199 |
0.452 |
2.260 |
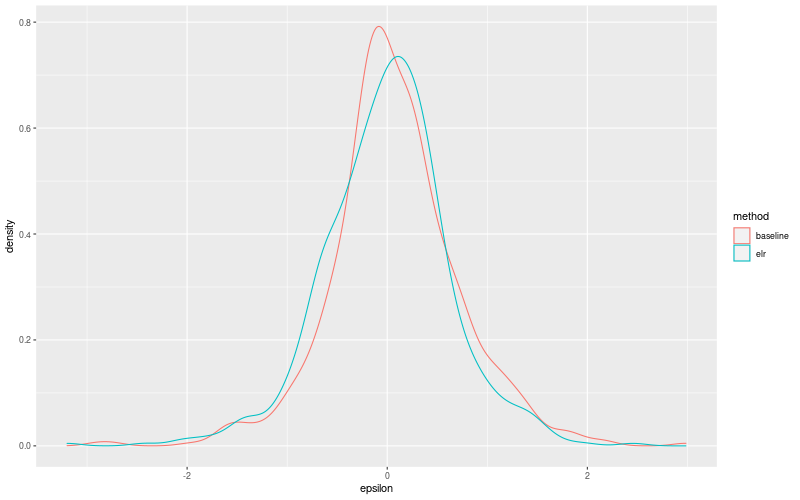
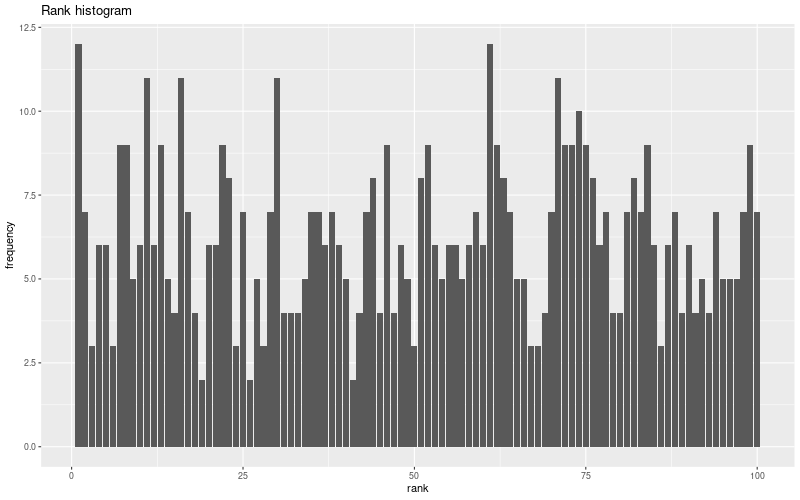
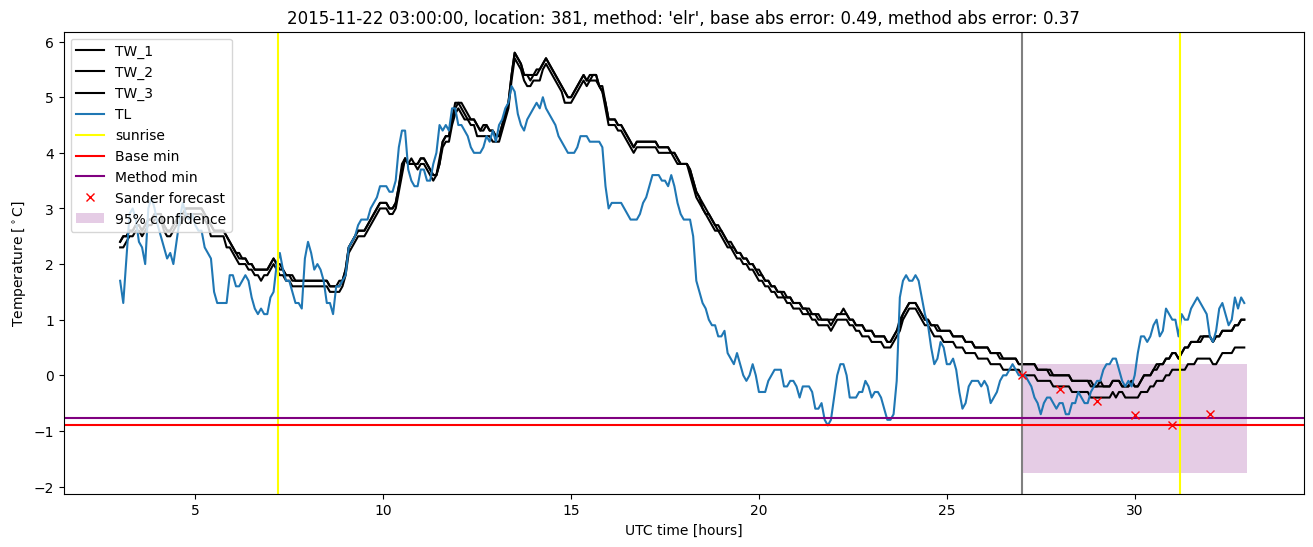
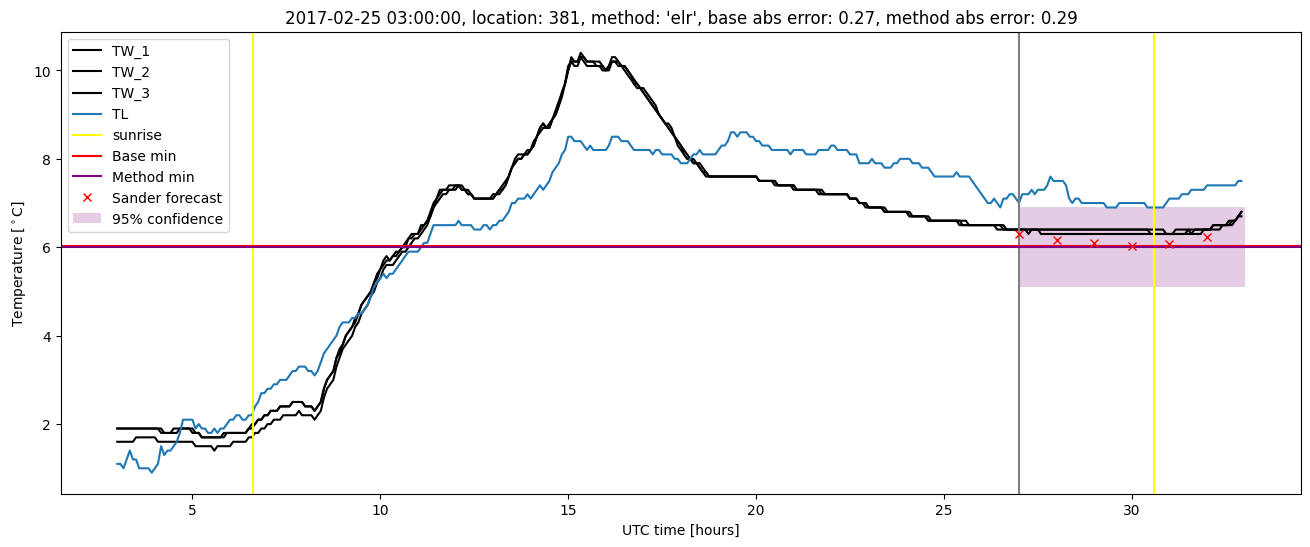
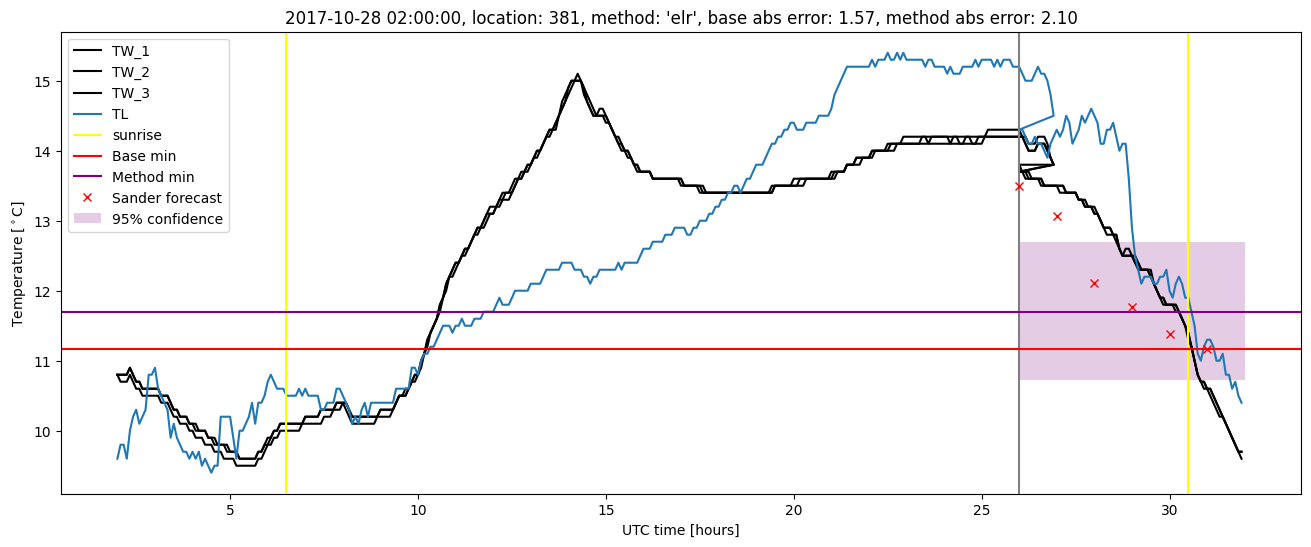
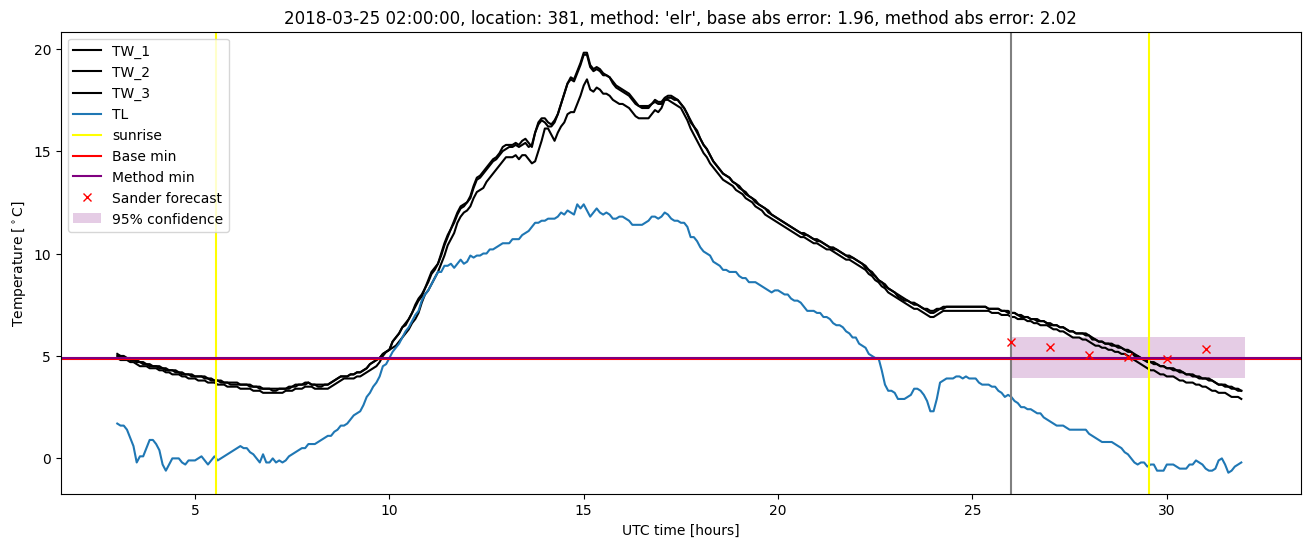
Extended logistic regression plots