GMS location: 380
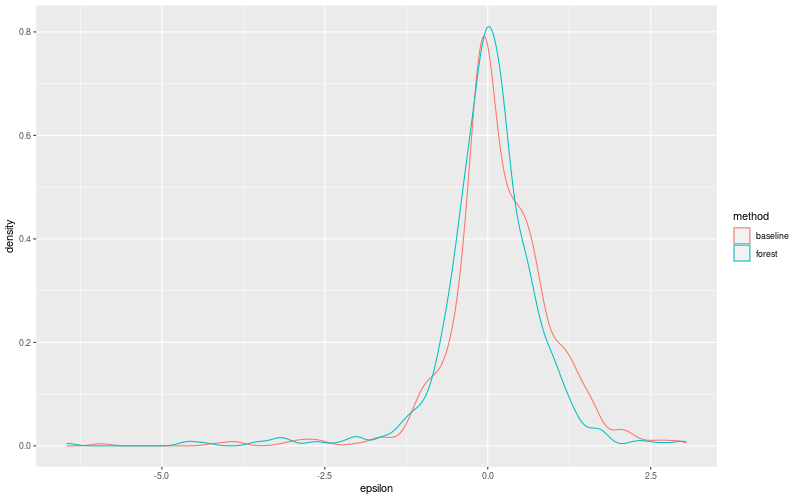
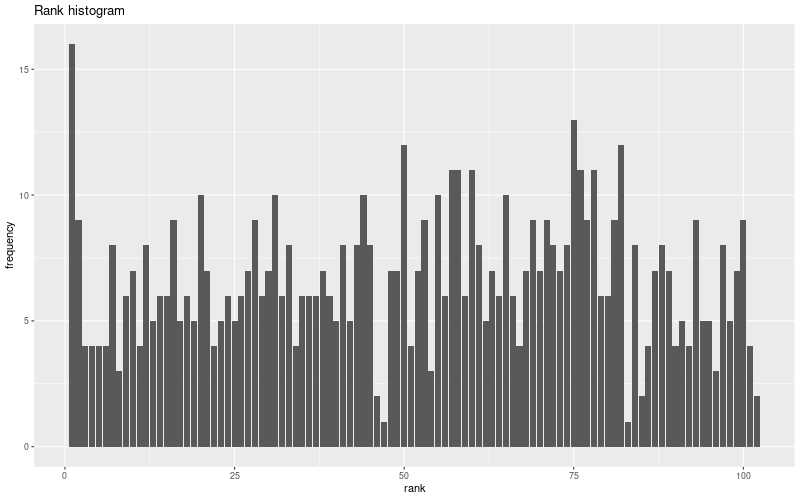
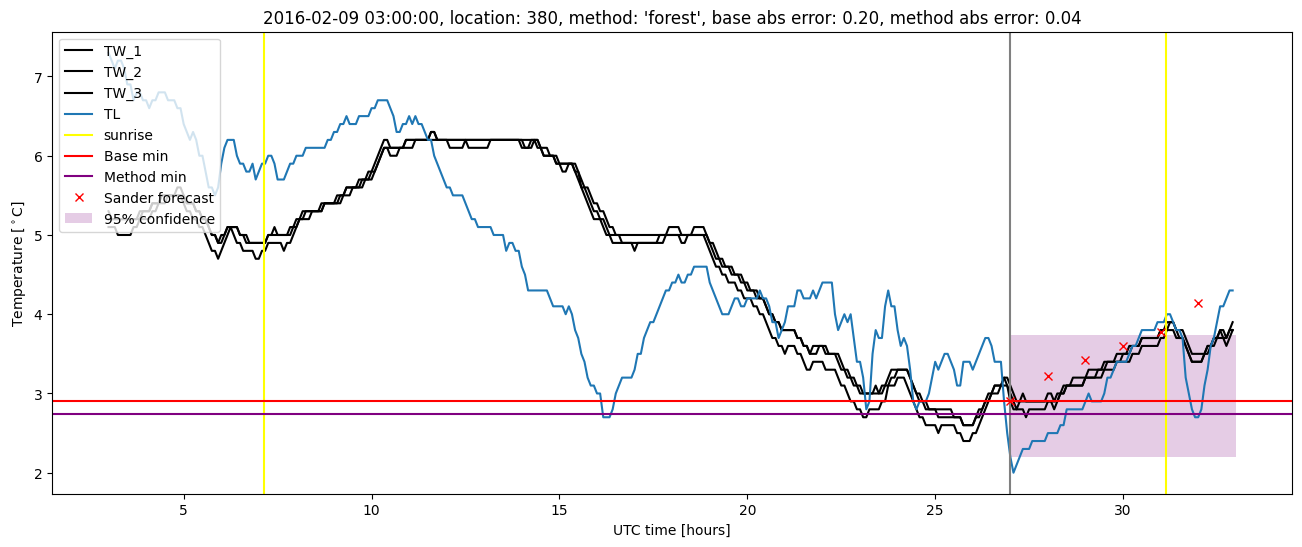
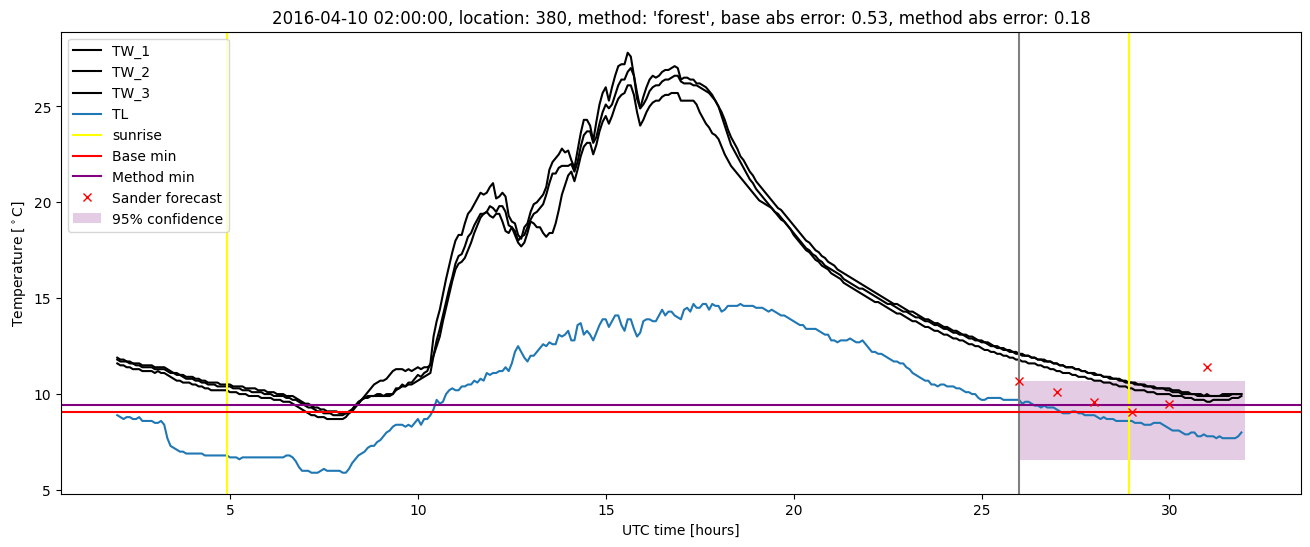
Random forest results
| names |
period |
power |
significance |
meanSquareError |
absError |
maxError |
CRPS |
IGN |
| baseline |
winter 2016 |
0.995 |
0.000e+00 |
0.528 |
0.558 |
2.087 |
NaN |
NaN |
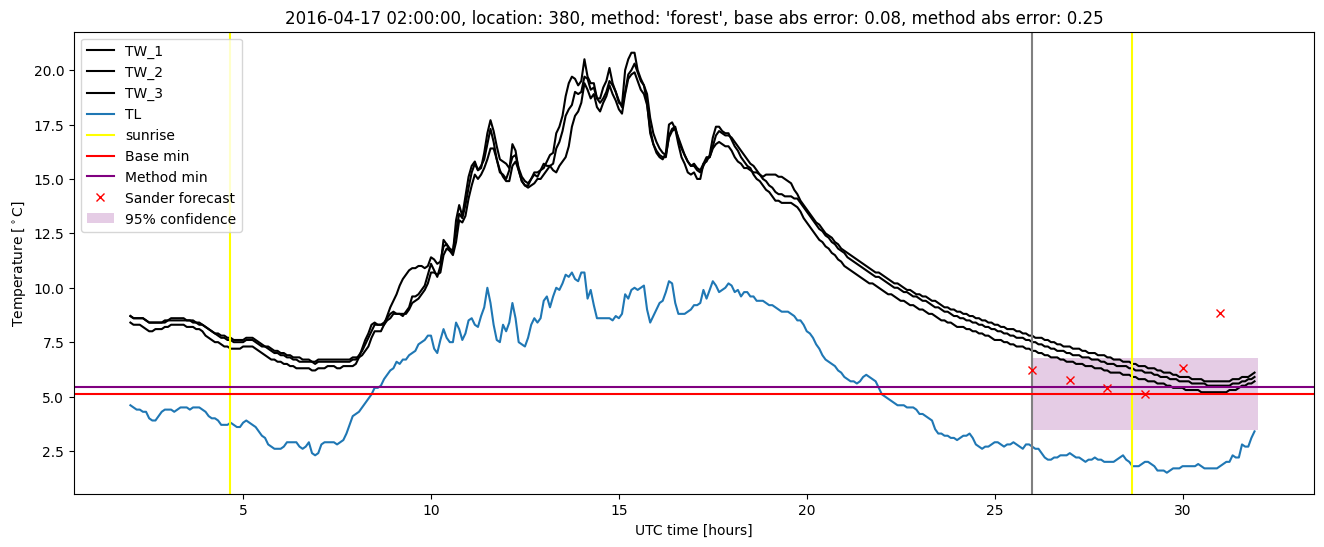
| forest |
winter 2016 |
0.995 |
0.000e+00 |
0.372 |
0.470 |
2.338 |
0.439 |
1.776 |
| baseline |
winter 2017 |
0.938 |
0.000e+00 |
0.583 |
0.550 |
2.940 |
NaN |
NaN |
| forest |
winter 2017 |
0.977 |
0.000e+00 |
0.295 |
0.396 |
2.212 |
0.422 |
1.795 |
| baseline |
winter 2018 |
0.986 |
0.000e+00 |
0.370 |
0.434 |
2.927 |
NaN |
NaN |
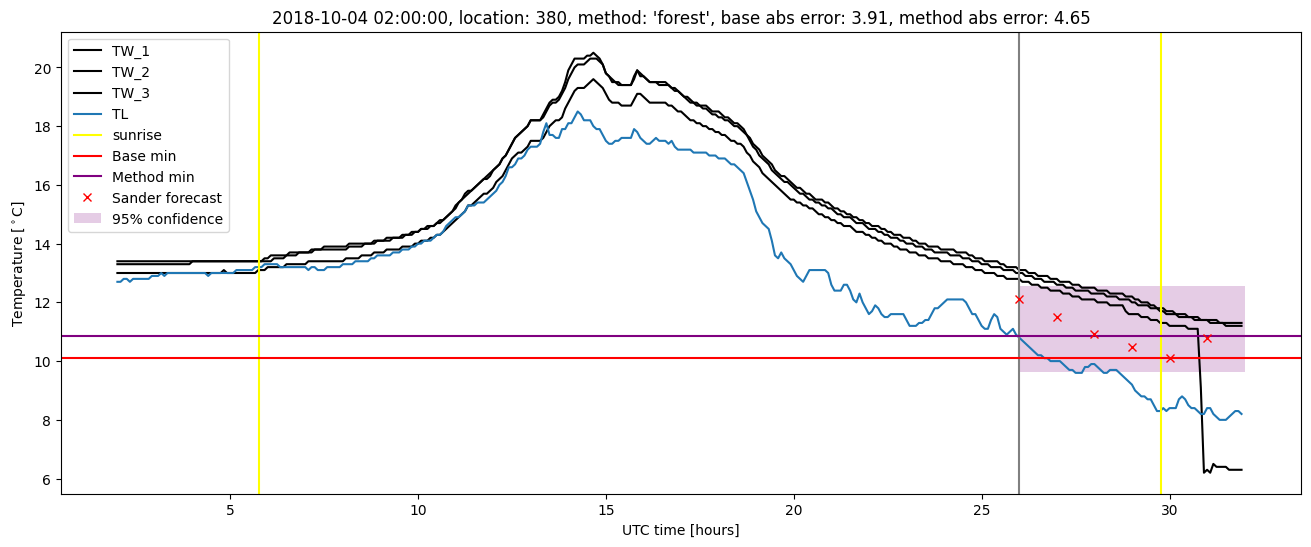
| forest |
winter 2018 |
1.000 |
0.125 |
0.456 |
0.455 |
3.040 |
0.486 |
1.599 |
| baseline |
winter 2019 |
0.986 |
0.154 |
1.418 |
0.749 |
5.930 |
NaN |
NaN |
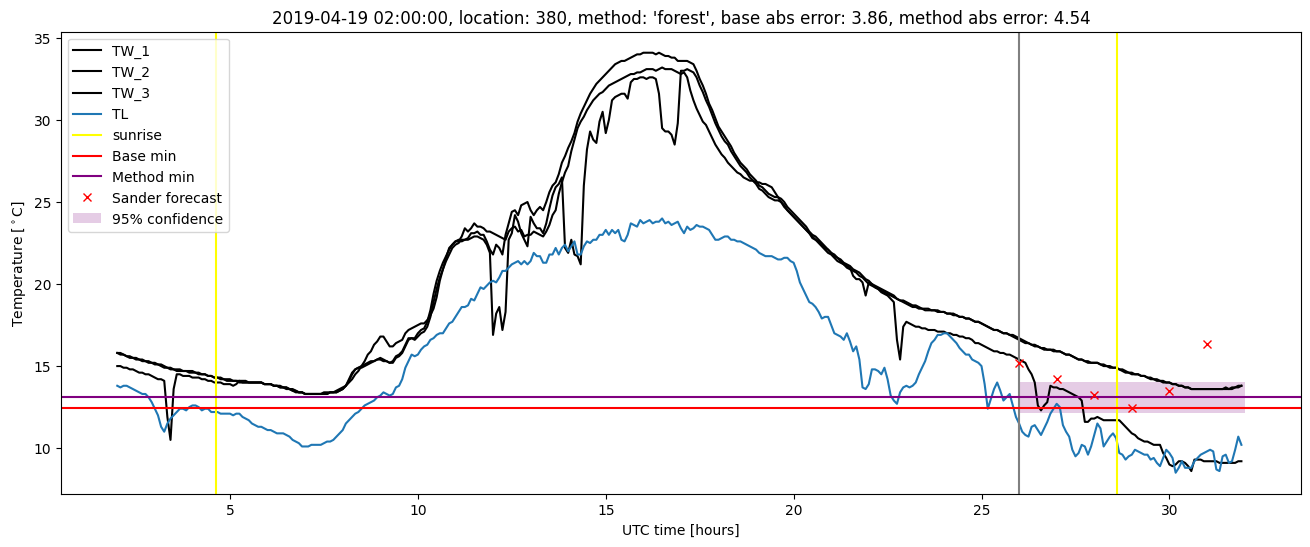
| forest |
winter 2019 |
0.986 |
0.154 |
1.628 |
0.767 |
6.455 |
0.404 |
2.346 |
| baseline |
all |
0.979 |
0.027 |
0.710 |
0.571 |
5.930 |
NaN |
NaN |
| forest |
all |
0.990 |
0.067 |
0.668 |
0.519 |
6.455 |
0.439 |
1.870 |
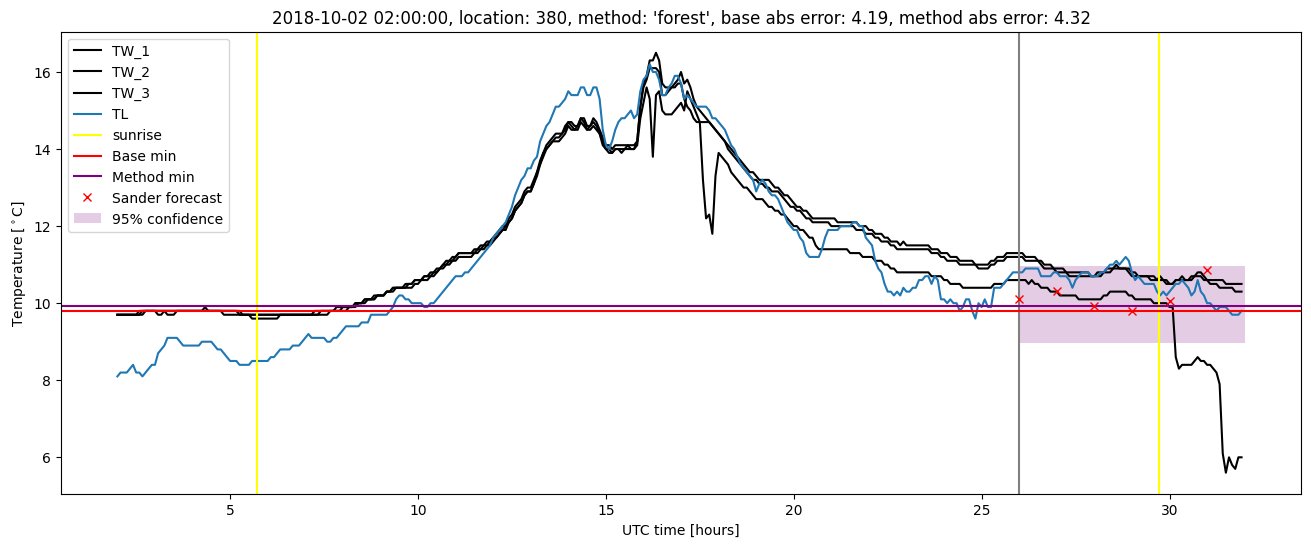
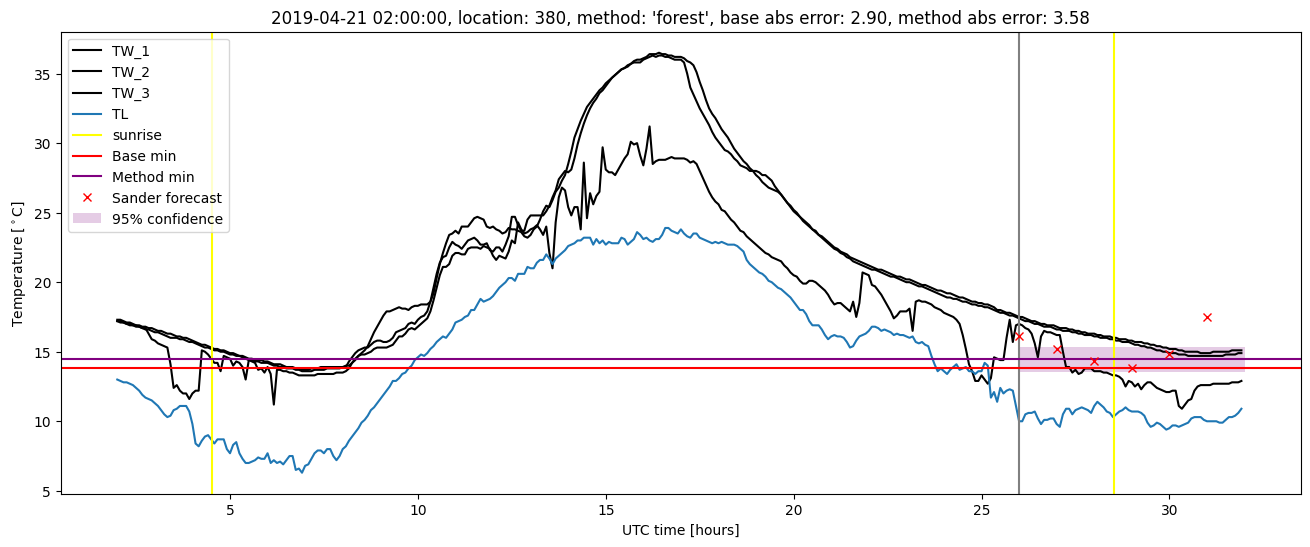
Random forest plots

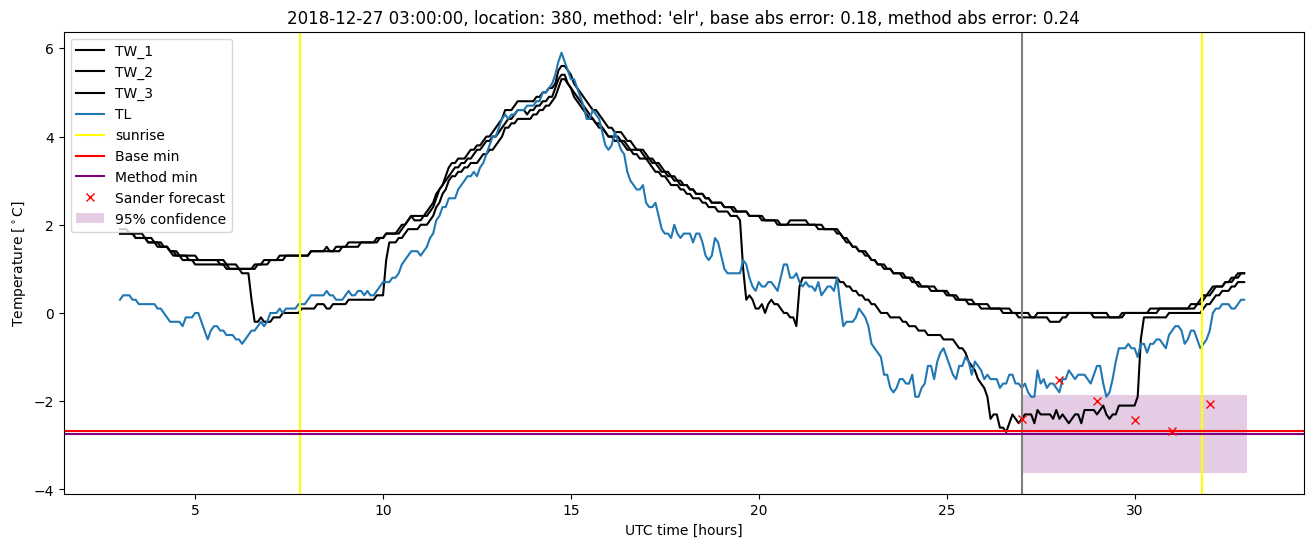
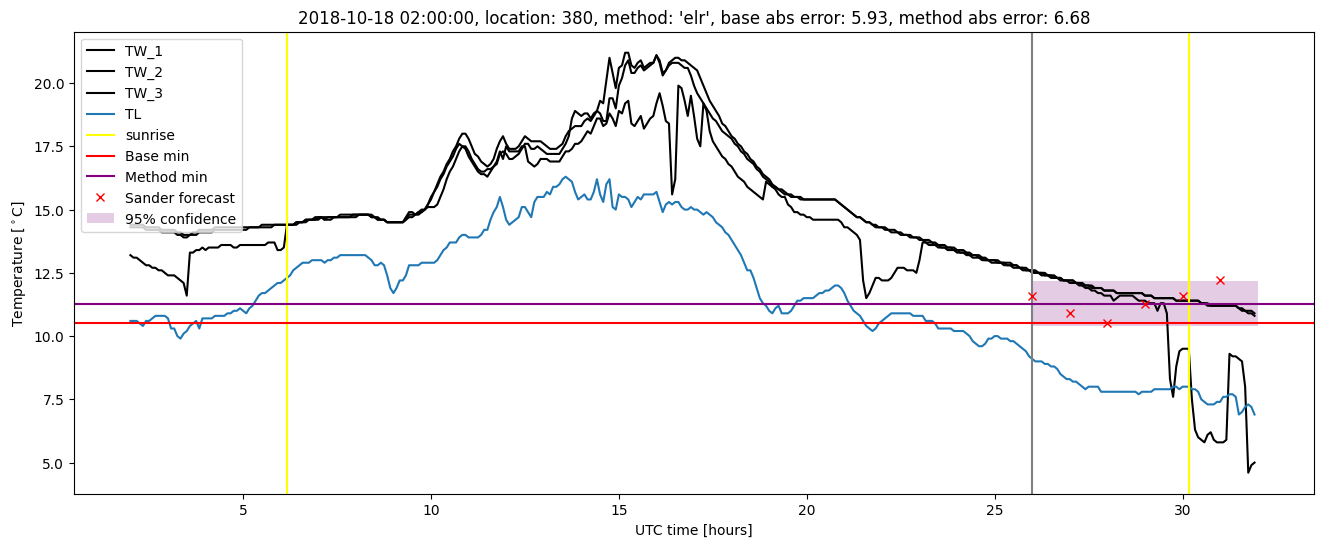
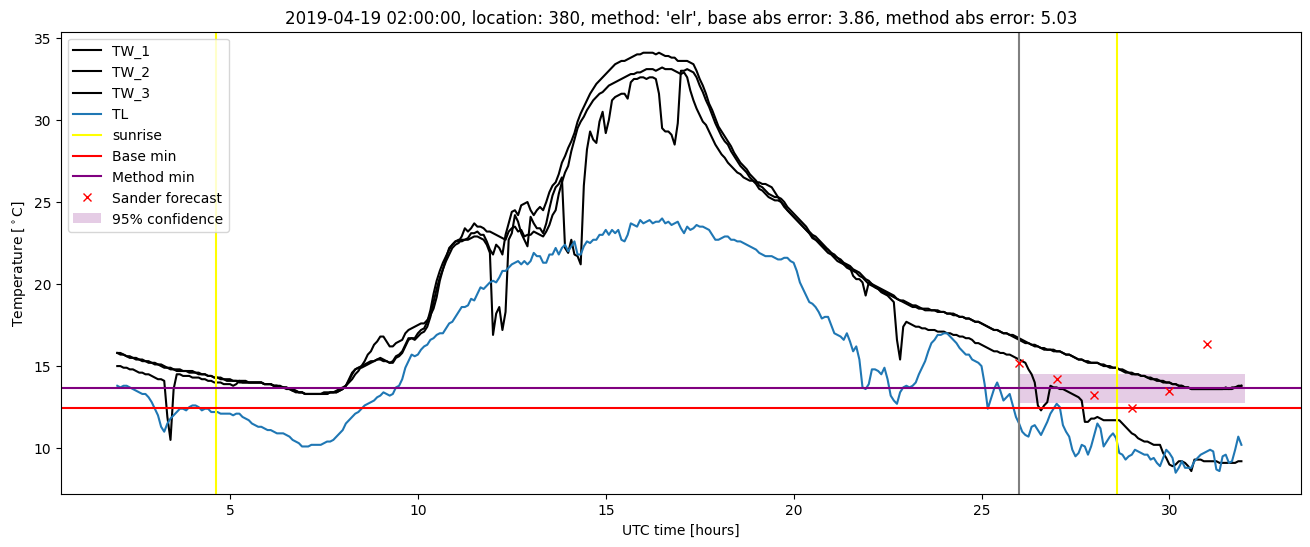
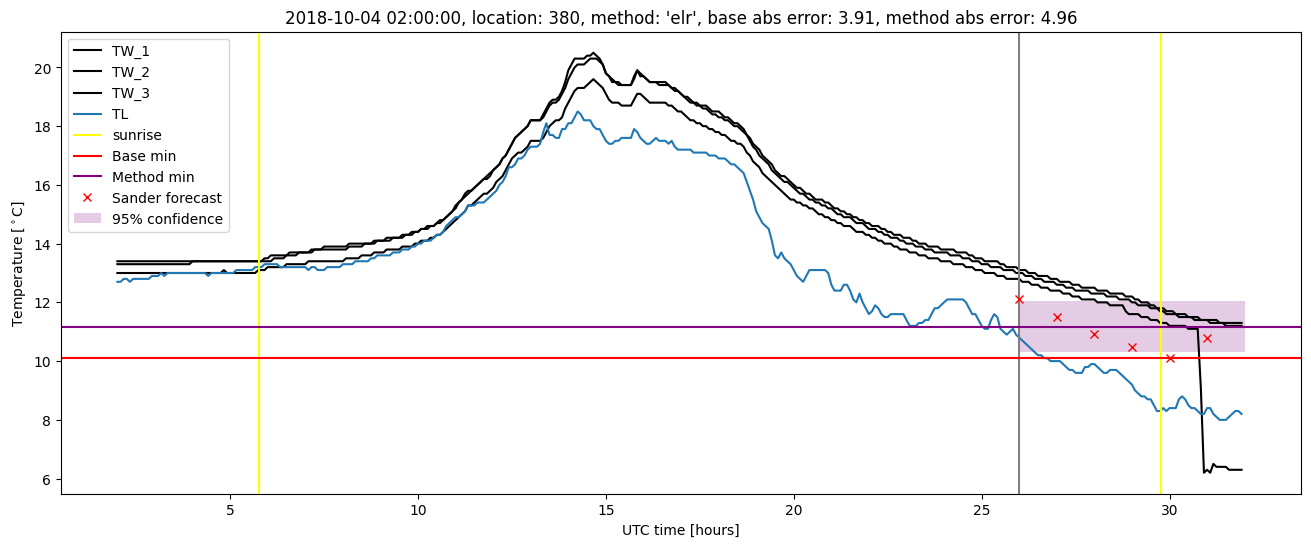
Extended logistic regression results
| names |
period |
power |
significance |
meanSquareError |
absError |
maxError |
CRPS |
IGN |
| baseline |
winter 2016 |
0.995 |
0.000e+00 |
0.528 |
0.558 |
2.087 |
NaN |
NaN |
| elr |
winter 2016 |
0.995 |
0.000e+00 |
0.431 |
0.524 |
1.861 |
0.488 |
1.397 |
| baseline |
winter 2017 |
0.938 |
0.000e+00 |
0.583 |
0.550 |
2.940 |
NaN |
NaN |
| elr |
winter 2017 |
0.985 |
0.000e+00 |
0.348 |
0.418 |
2.259 |
0.391 |
1.048 |
| baseline |
winter 2018 |
0.986 |
0.000e+00 |
0.370 |
0.434 |
2.927 |
NaN |
NaN |
| elr |
winter 2018 |
1.000 |
0.125 |
0.311 |
0.440 |
2.308 |
0.447 |
1.239 |
| baseline |
winter 2019 |
0.986 |
0.154 |
1.418 |
0.749 |
5.930 |
NaN |
NaN |
| elr |
winter 2019 |
1.000 |
0.231 |
1.858 |
0.811 |
6.683 |
0.506 |
3.747 |
| baseline |
all |
0.979 |
0.027 |
0.710 |
0.571 |
5.930 |
NaN |
NaN |
| elr |
all |
0.995 |
0.080 |
0.716 |
0.547 |
6.683 |
0.461 |
1.829 |
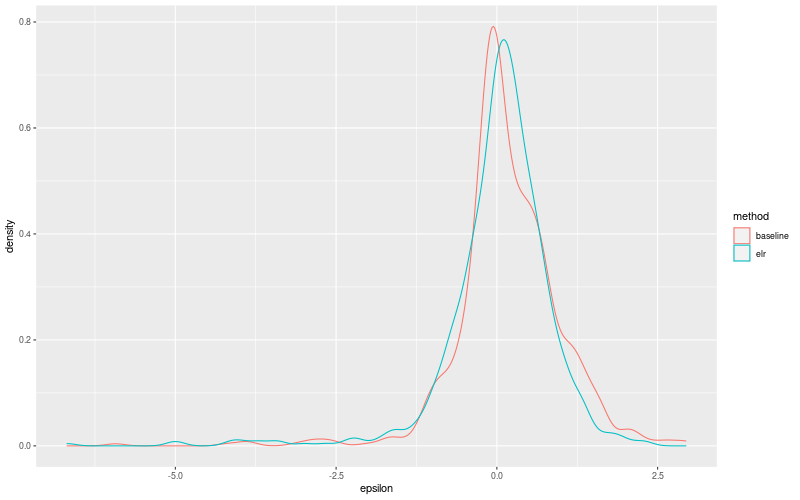
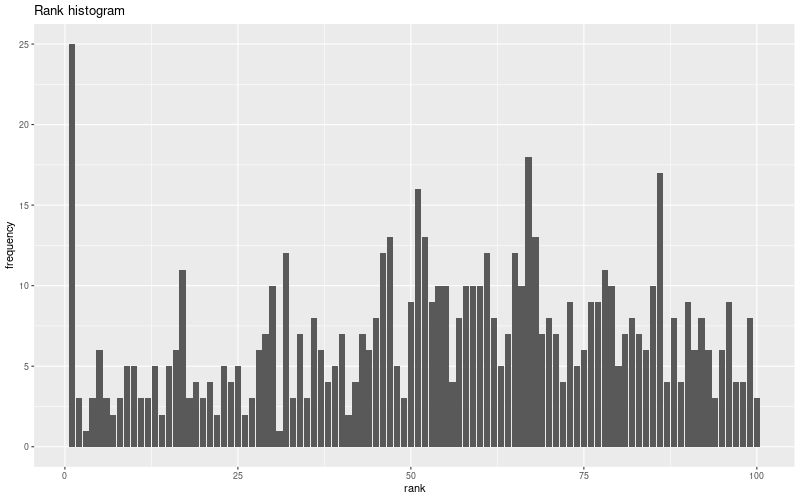
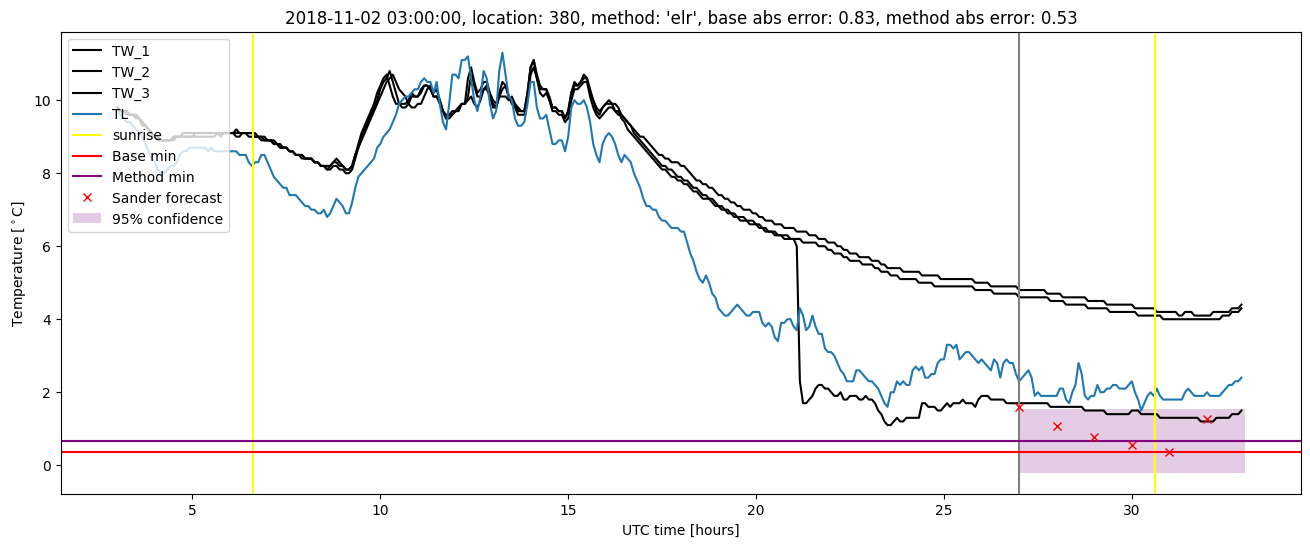
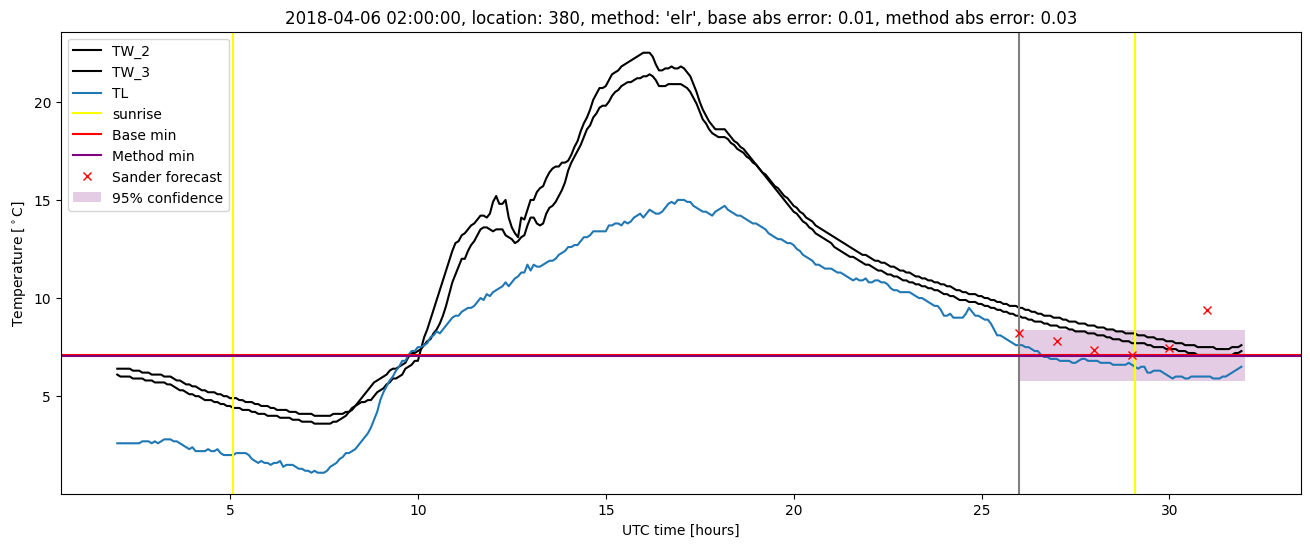
Extended logistic regression plots