GMS location: 379
Random forest results
| names |
period |
power |
significance |
meanSquareError |
absError |
maxError |
CRPS |
IGN |
| baseline |
winter 2016 |
0.983 |
0.240 |
0.484 |
0.536 |
2.273 |
NaN |
NaN |
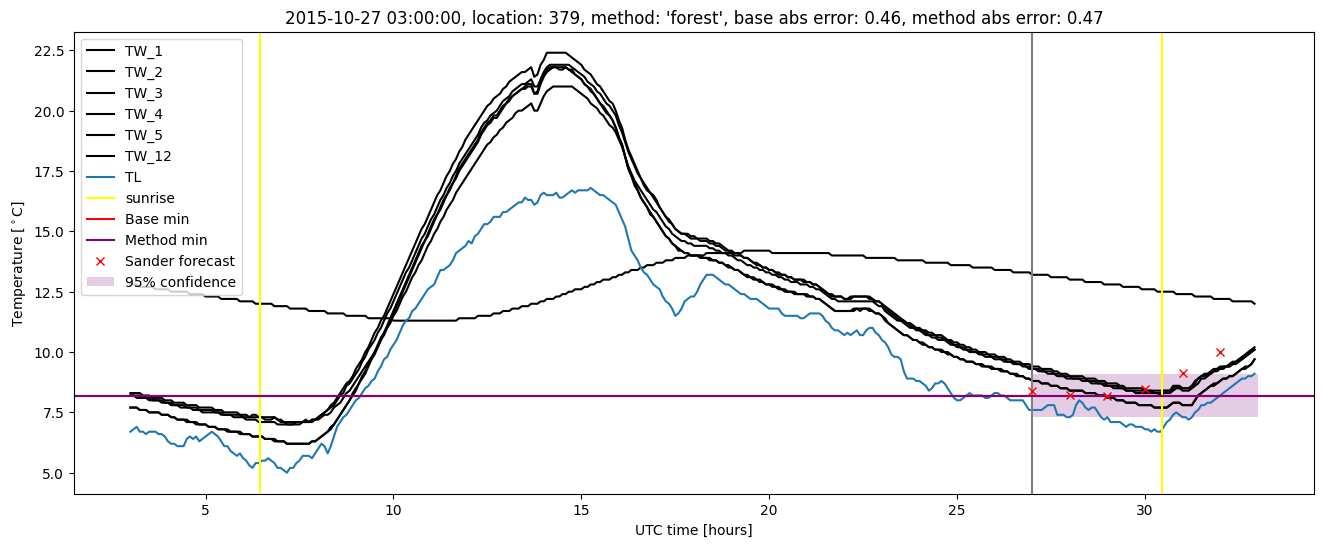
| forest |
winter 2016 |
0.989 |
0.280 |
0.467 |
0.527 |
2.111 |
0.460 |
1.991 |
| baseline |
winter 2017 |
0.982 |
0.022 |
0.590 |
0.537 |
4.599 |
NaN |
NaN |
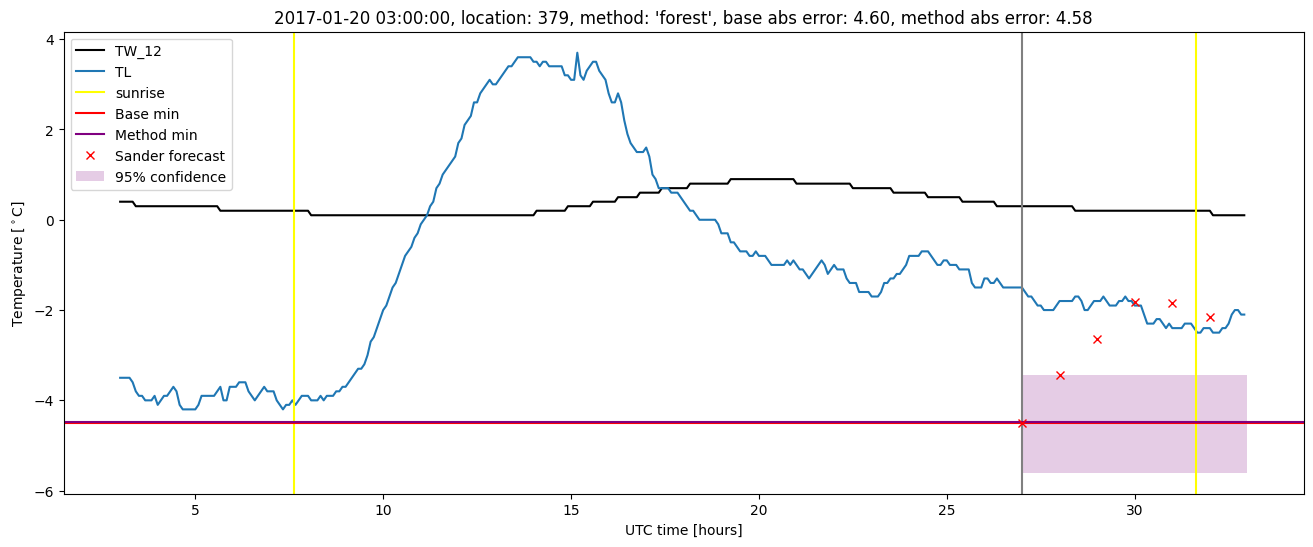
| forest |
winter 2017 |
0.972 |
0.022 |
0.512 |
0.492 |
4.576 |
0.506 |
2.411 |
| baseline |
winter 2018 |
0.981 |
0.081 |
0.458 |
0.485 |
2.411 |
NaN |
NaN |
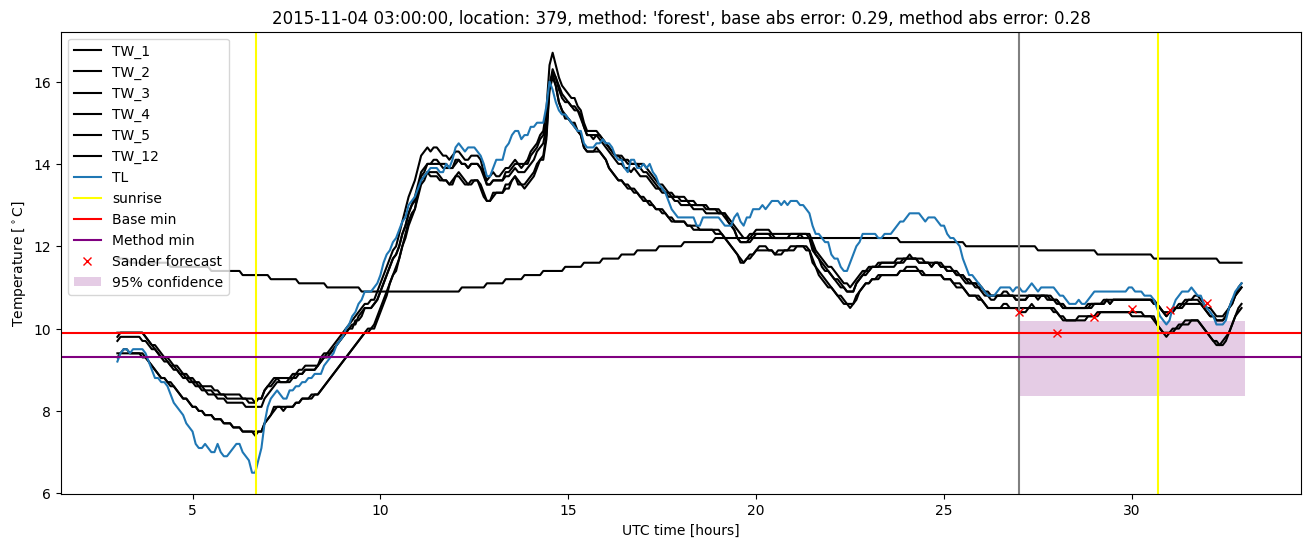
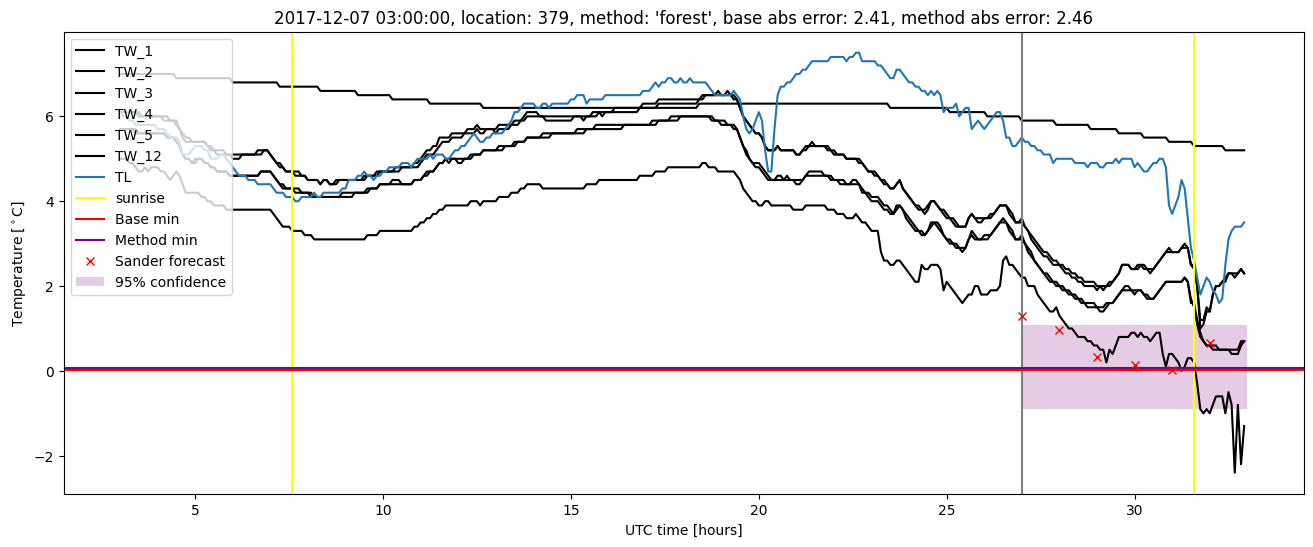
| forest |
winter 2018 |
0.991 |
0.108 |
0.417 |
0.470 |
2.463 |
0.480 |
1.743 |
| baseline |
winter 2019 |
0.978 |
0.125 |
0.637 |
0.515 |
5.484 |
NaN |
NaN |
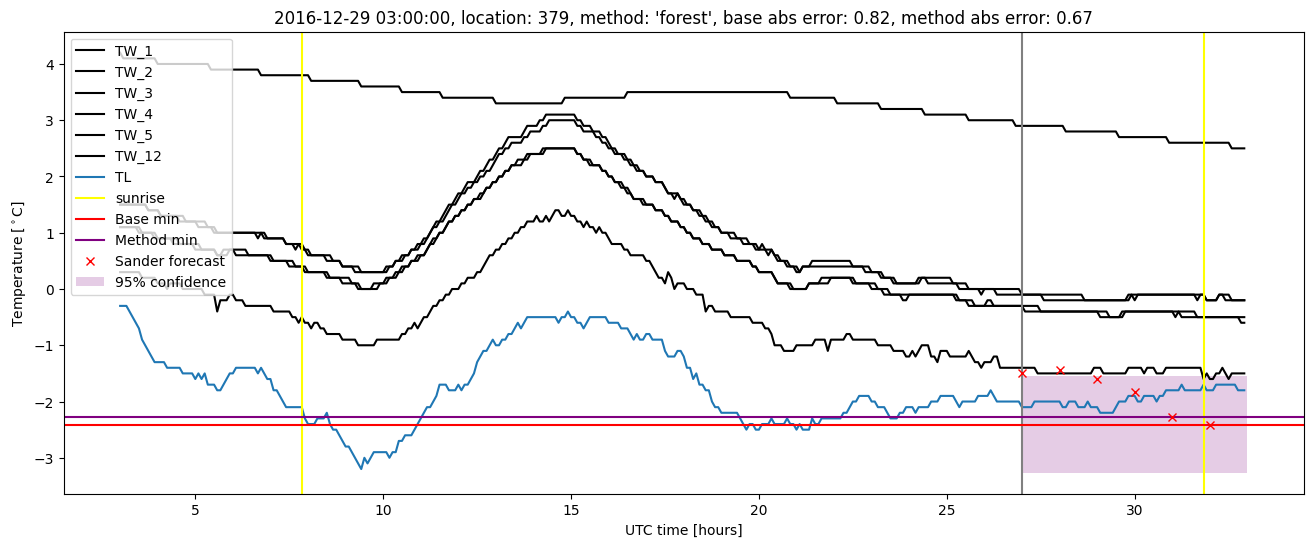
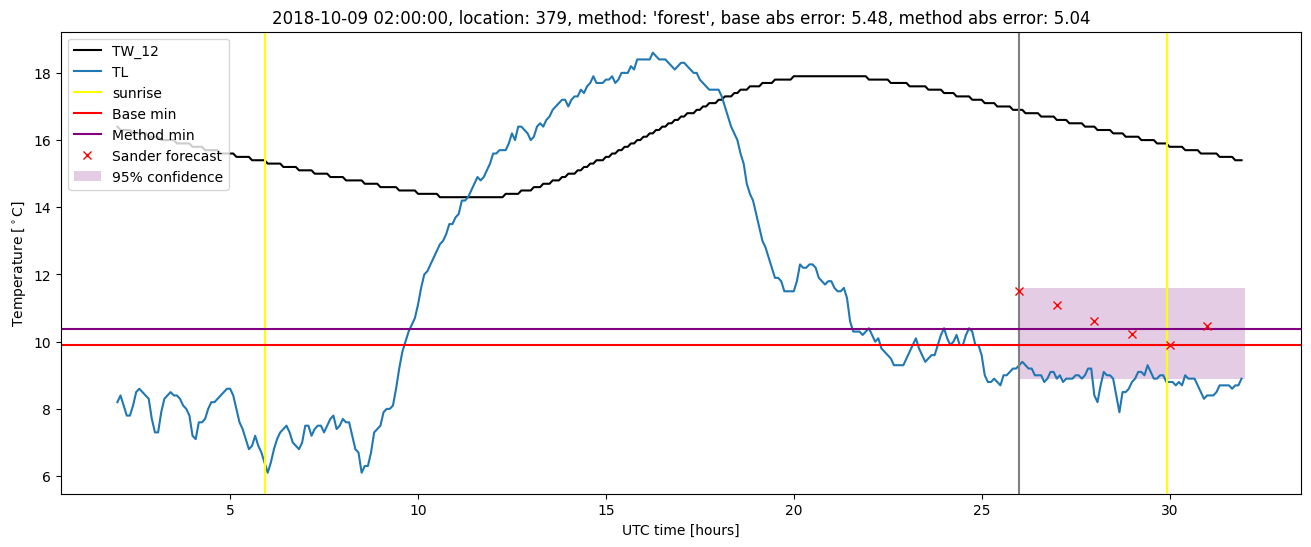
| forest |
winter 2019 |
0.978 |
0.125 |
0.552 |
0.489 |
5.037 |
0.476 |
1.809 |
| baseline |
all |
0.981 |
0.098 |
0.539 |
0.520 |
5.484 |
NaN |
NaN |
| forest |
all |
0.983 |
0.114 |
0.486 |
0.498 |
5.037 |
0.479 |
1.994 |
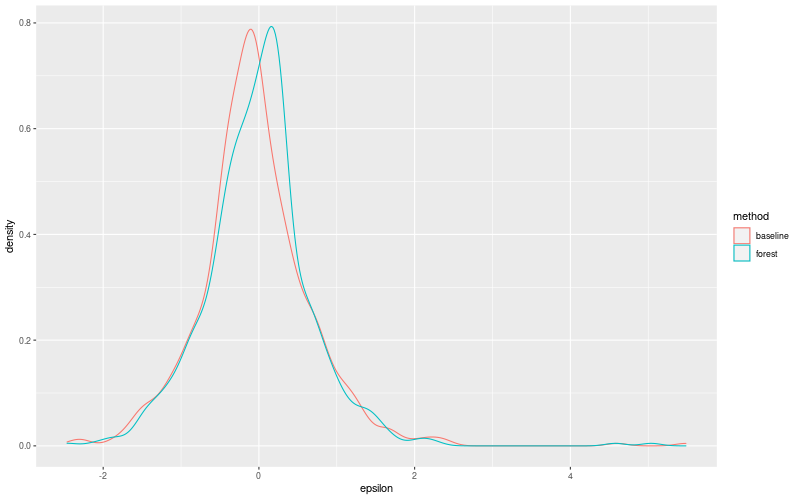
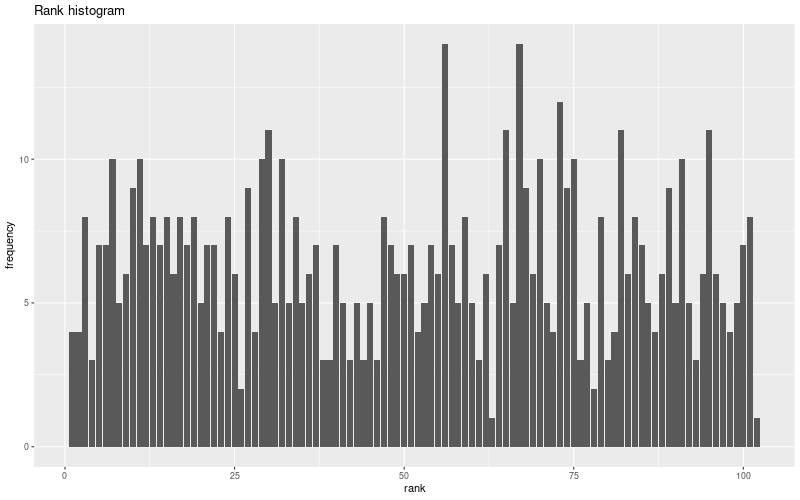
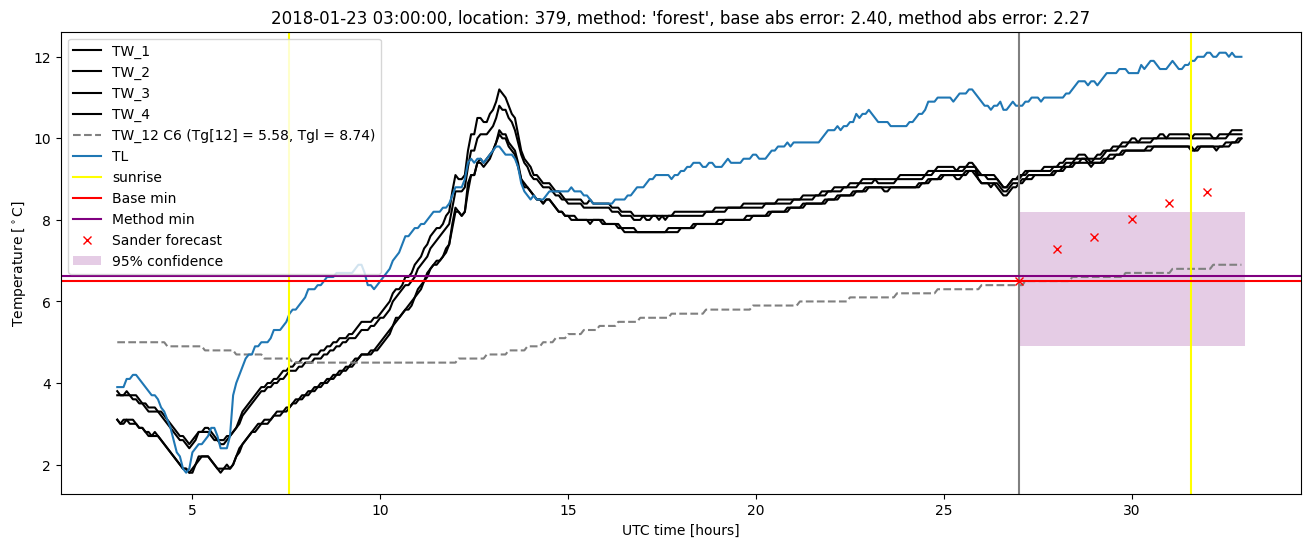
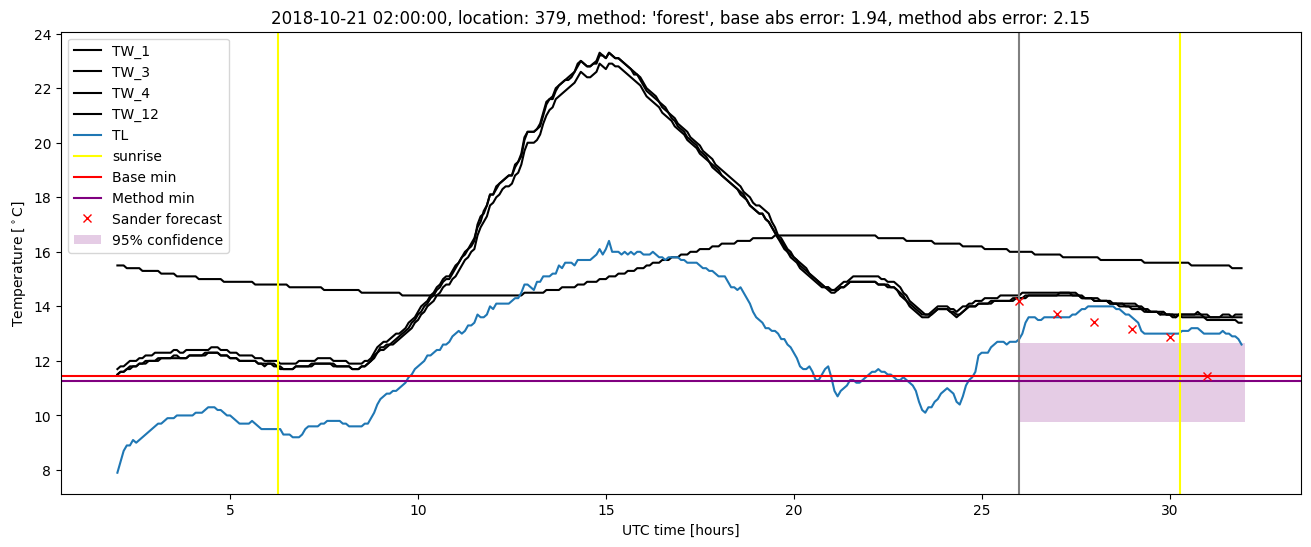
Random forest plots
Extended logistic regression results
| names |
period |
power |
significance |
meanSquareError |
absError |
maxError |
CRPS |
IGN |
| baseline |
winter 2016 |
0.983 |
0.240 |
0.484 |
0.536 |
2.273 |
NaN |
NaN |
| elr |
winter 2016 |
0.995 |
0.280 |
0.435 |
0.533 |
1.837 |
0.556 |
2.463 |
| baseline |
winter 2017 |
0.982 |
0.022 |
0.590 |
0.537 |
4.599 |
NaN |
NaN |
| elr |
winter 2017 |
0.972 |
0.022 |
0.548 |
0.521 |
4.587 |
0.616 |
3.034 |
| baseline |
winter 2018 |
0.981 |
0.081 |
0.458 |
0.485 |
2.411 |
NaN |
NaN |
| elr |
winter 2018 |
0.991 |
0.081 |
0.383 |
0.458 |
2.308 |
0.565 |
2.478 |
| baseline |
winter 2019 |
0.978 |
0.125 |
0.637 |
0.515 |
5.484 |
NaN |
NaN |
| elr |
winter 2019 |
0.985 |
0.125 |
0.525 |
0.475 |
5.190 |
0.529 |
2.515 |
| baseline |
all |
0.981 |
0.098 |
0.539 |
0.520 |
5.484 |
NaN |
NaN |
| elr |
all |
0.987 |
0.106 |
0.471 |
0.500 |
5.190 |
0.566 |
2.612 |
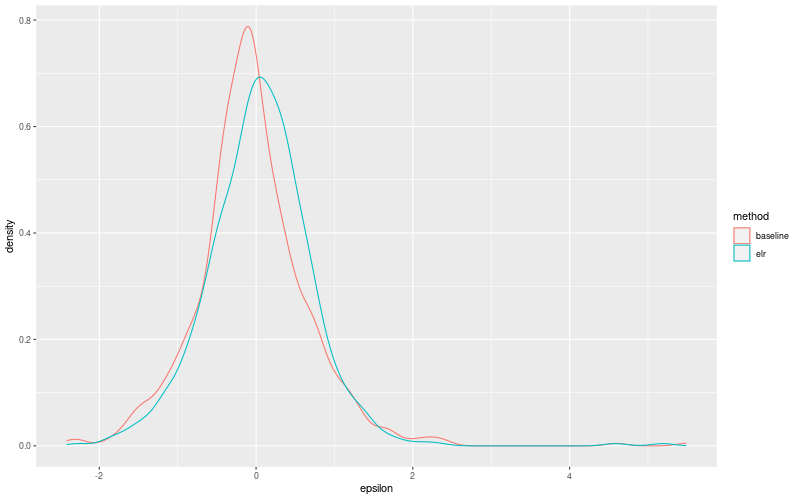
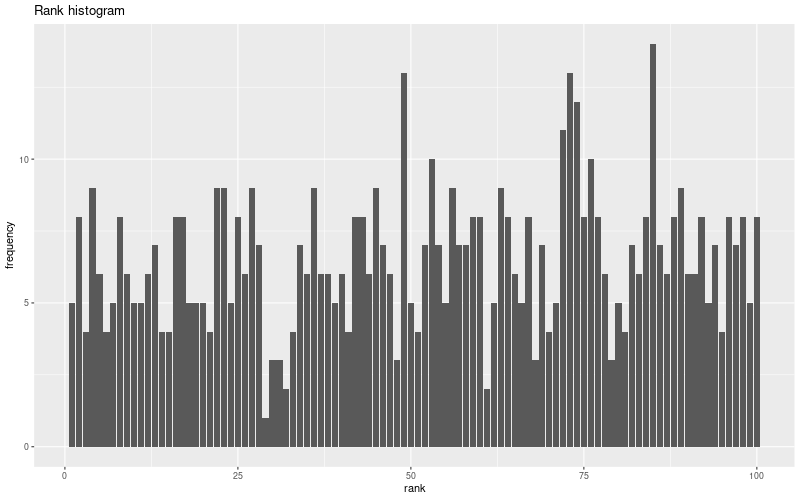
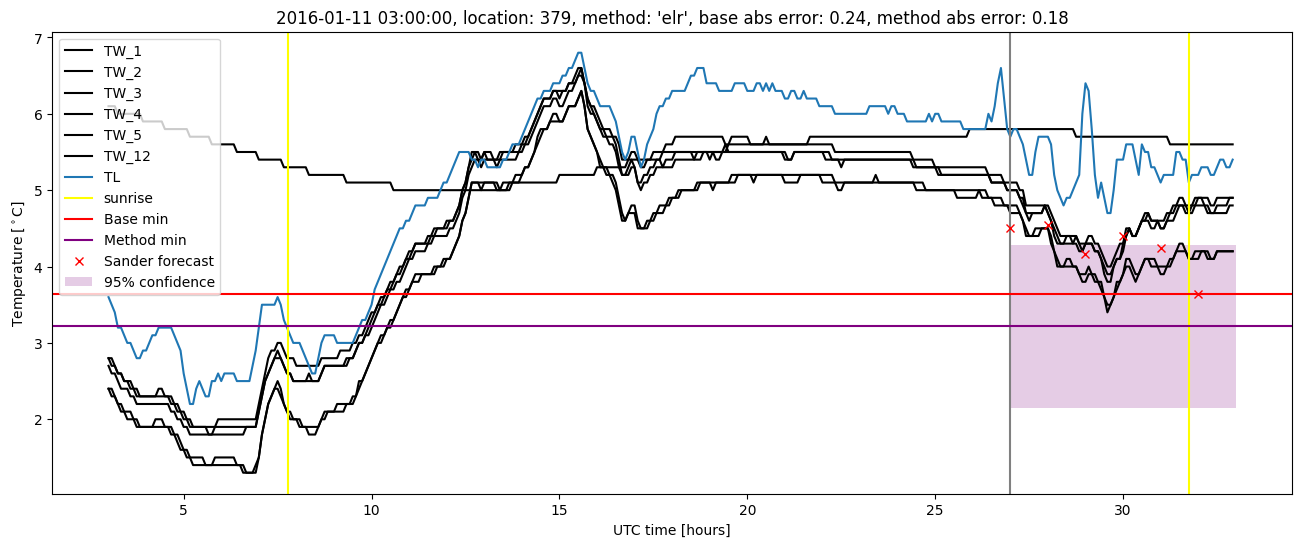
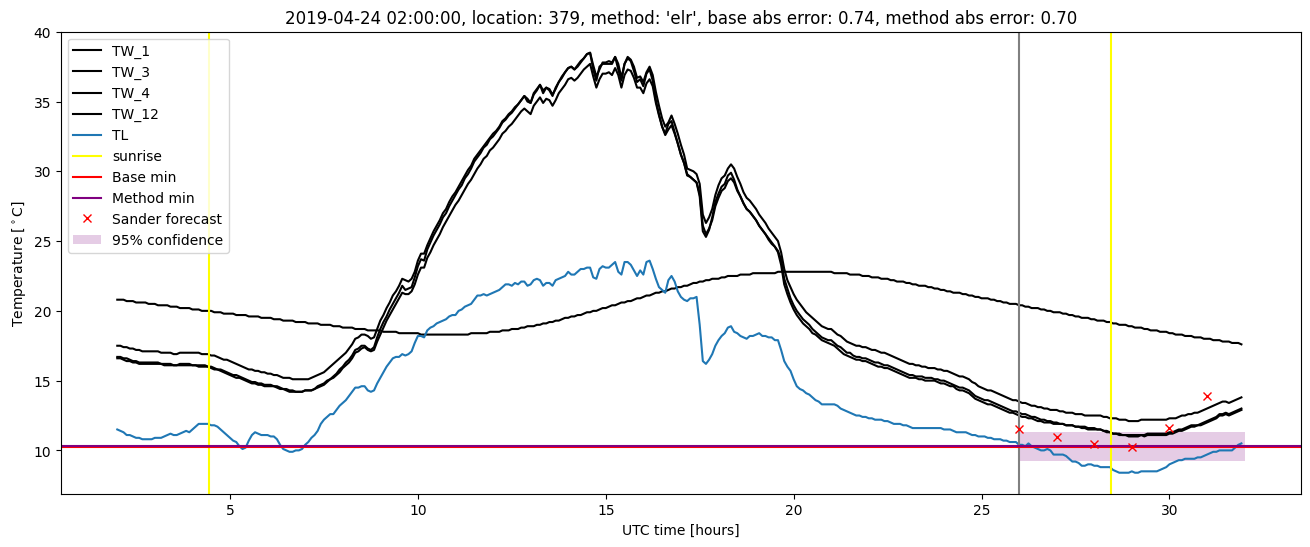
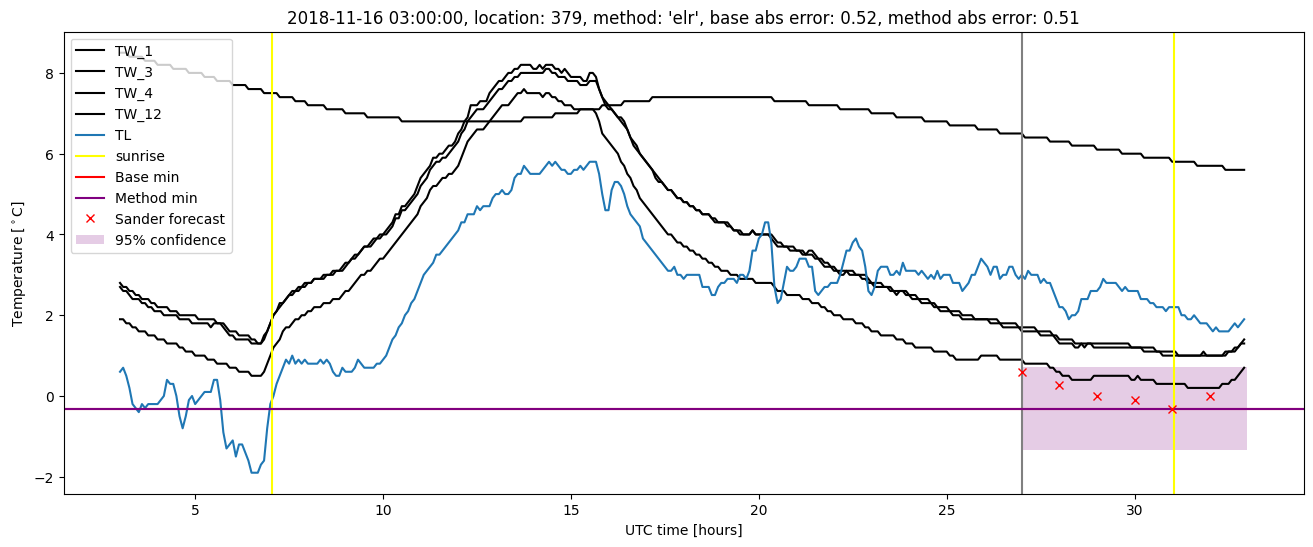
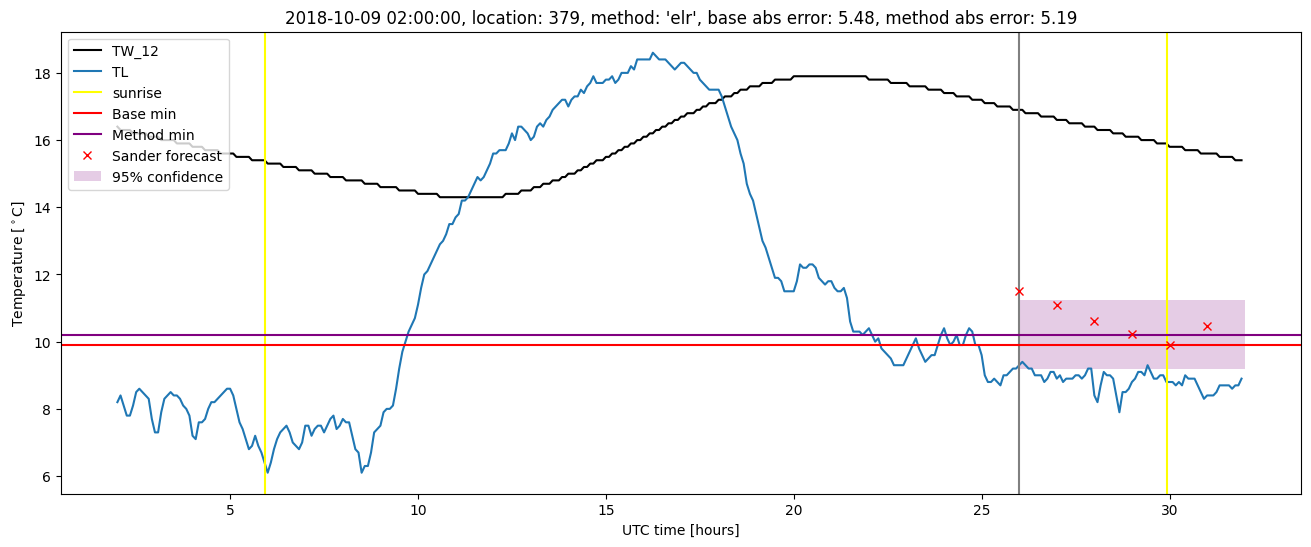
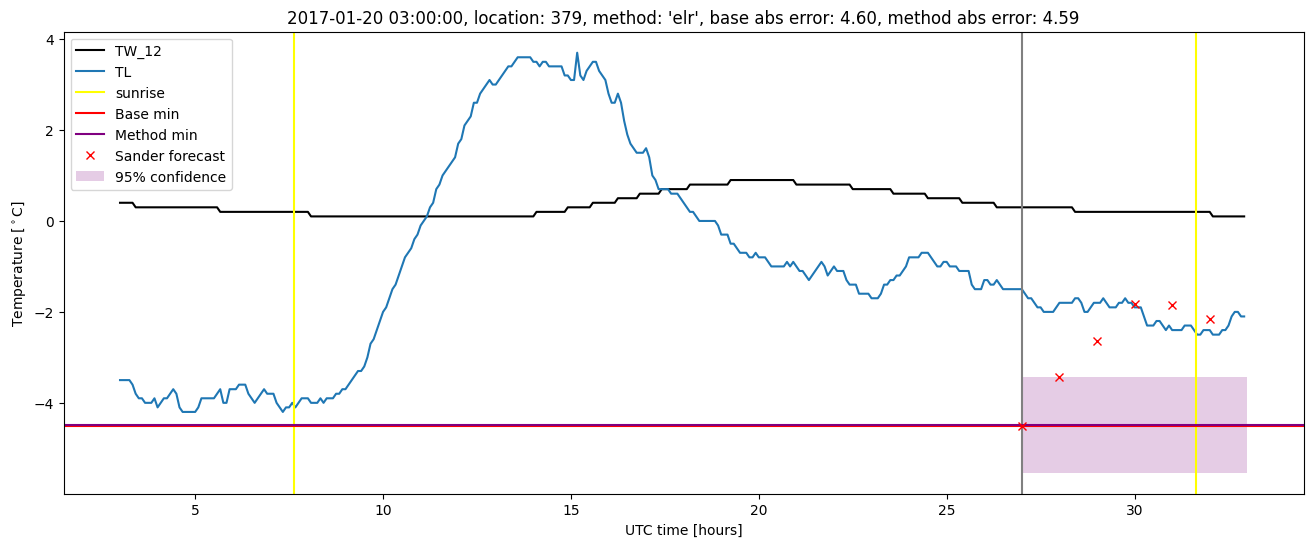
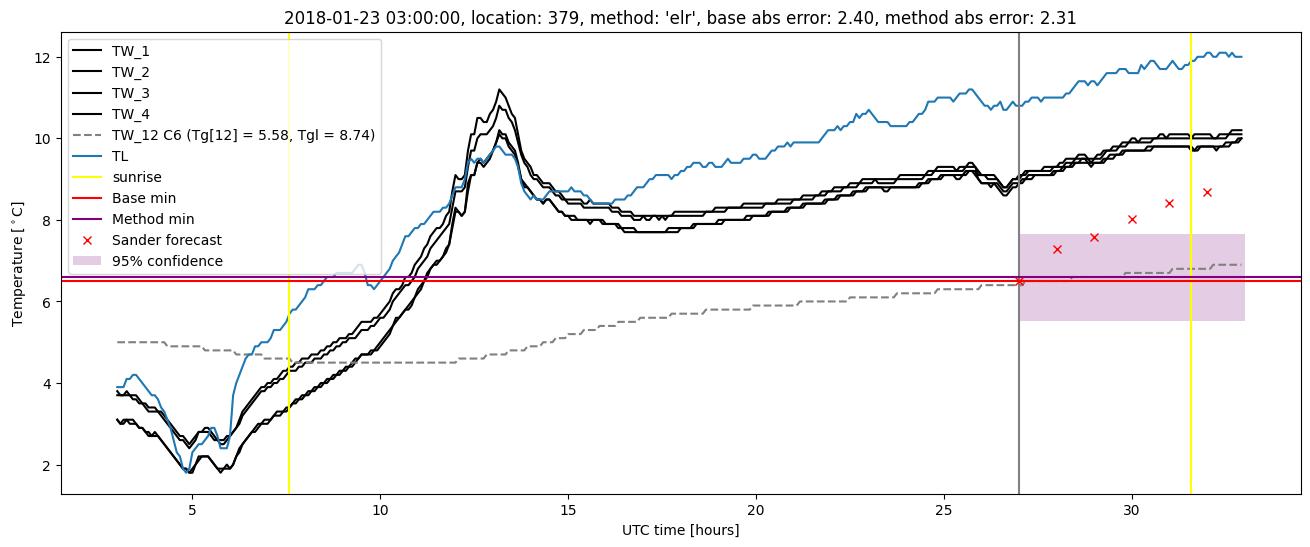
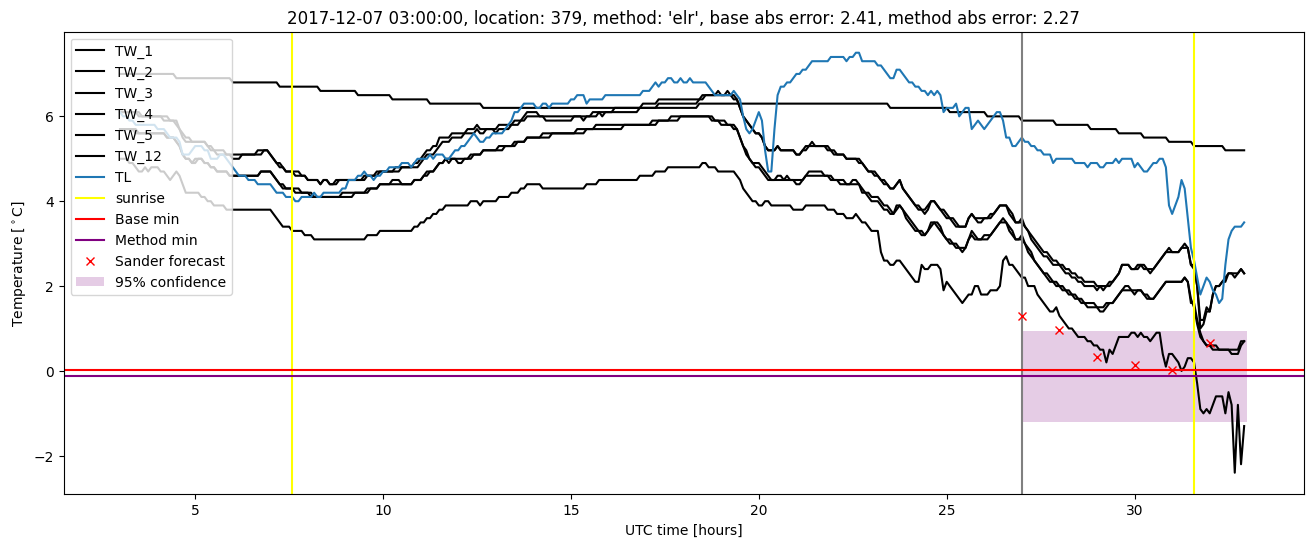
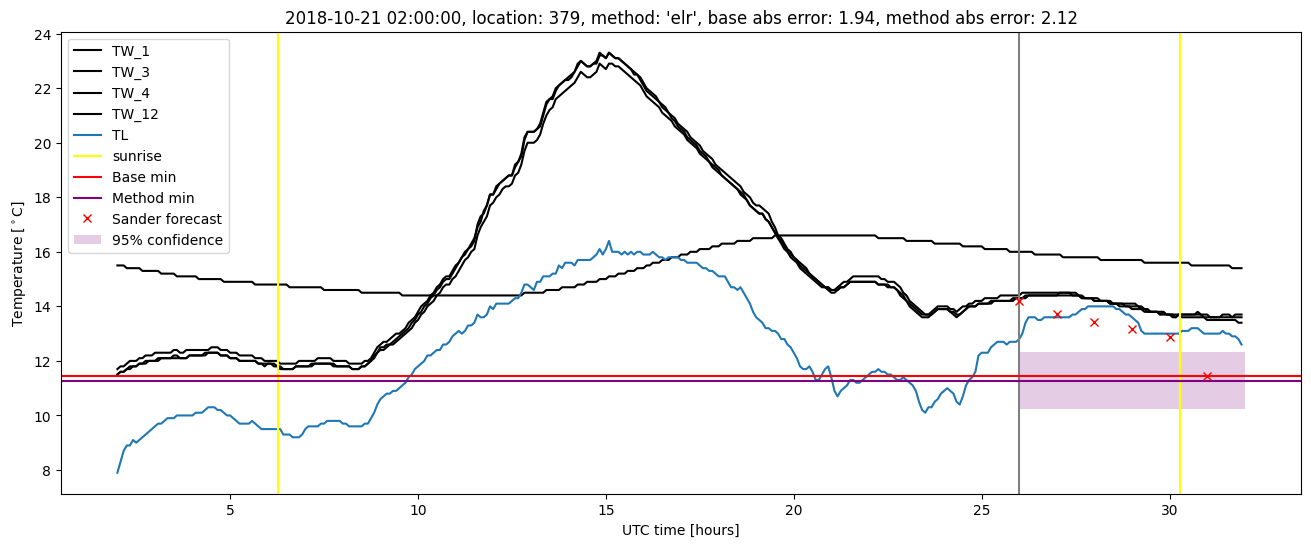
Extended logistic regression plots