GMS location: 378
Random forest results
| names |
period |
power |
significance |
meanSquareError |
absError |
maxError |
CRPS |
IGN |
| baseline |
winter 2016 |
0.984 |
0.105 |
0.421 |
0.485 |
2.401 |
NaN |
NaN |
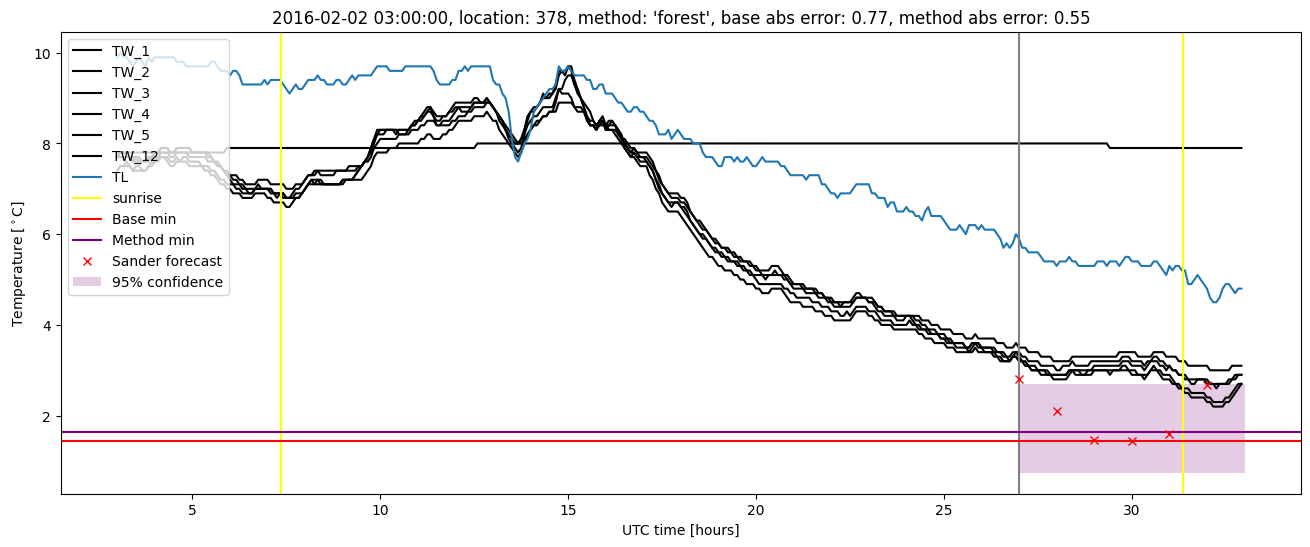
| forest |
winter 2016 |
0.995 |
0.158 |
0.358 |
0.451 |
2.439 |
0.449 |
1.820 |
| baseline |
winter 2017 |
0.965 |
0.077 |
0.515 |
0.537 |
2.176 |
NaN |
NaN |
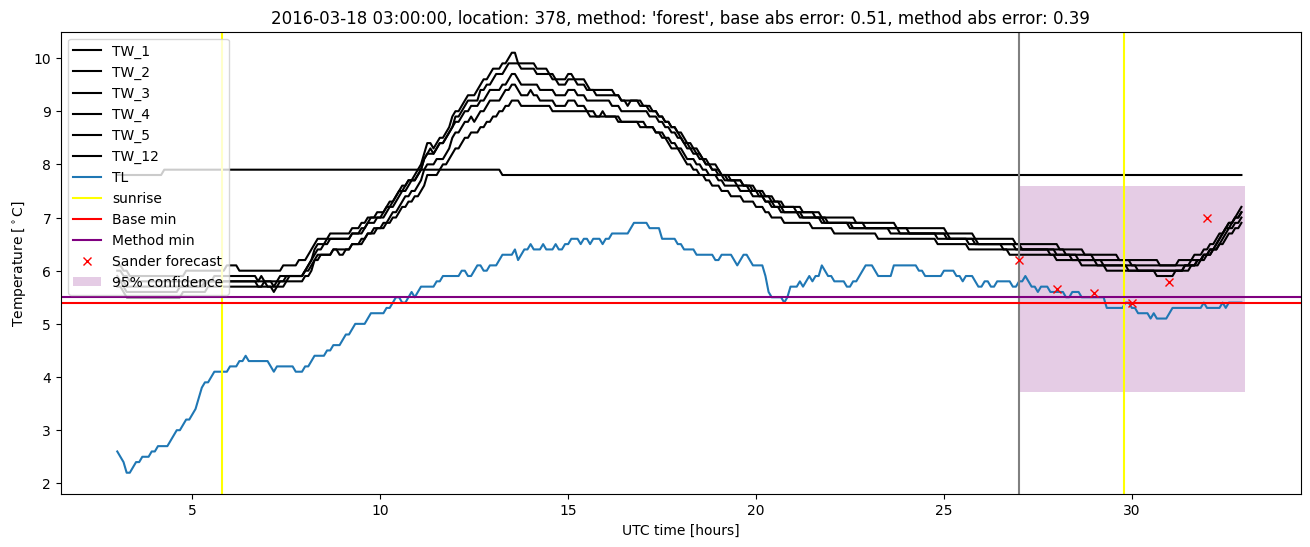
| forest |
winter 2017 |
0.965 |
0.051 |
0.368 |
0.460 |
1.768 |
0.474 |
2.552 |
| baseline |
winter 2018 |
1.000 |
0.083 |
0.395 |
0.475 |
2.297 |
NaN |
NaN |
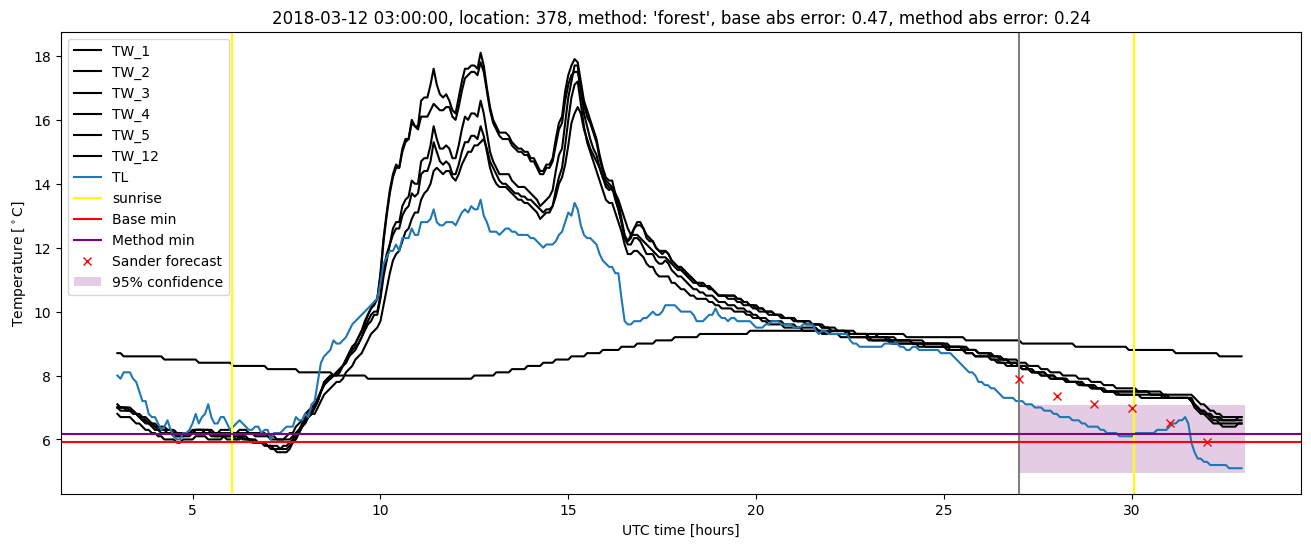
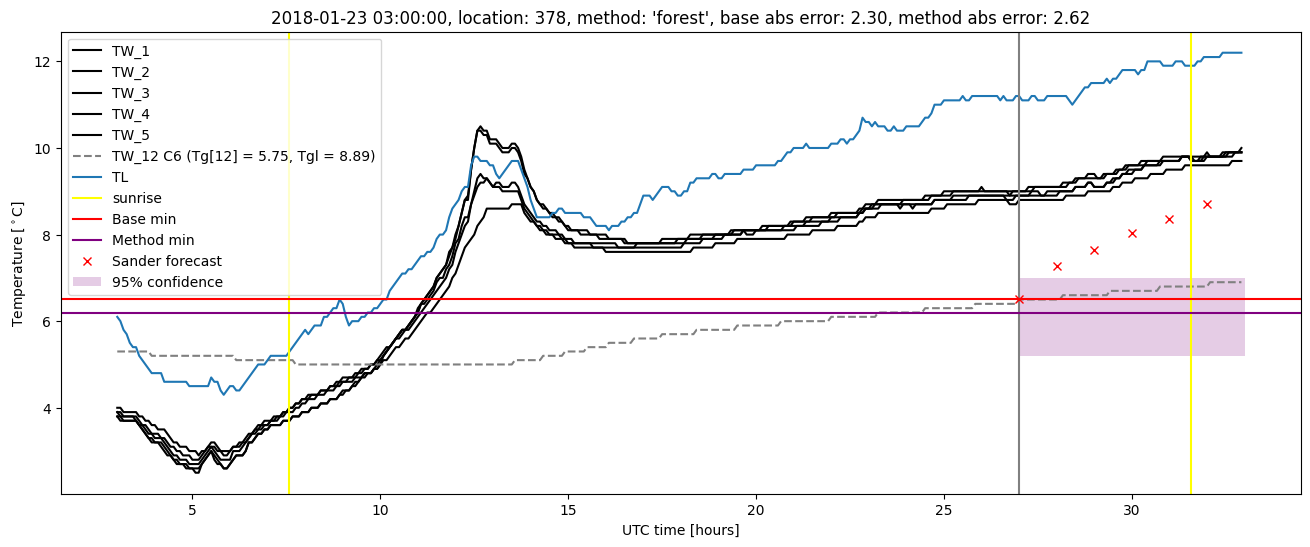
| forest |
winter 2018 |
0.993 |
0.056 |
0.319 |
0.407 |
2.619 |
0.459 |
1.756 |
| baseline |
winter 2019 |
1.000 |
0.059 |
0.556 |
0.506 |
3.619 |
NaN |
NaN |
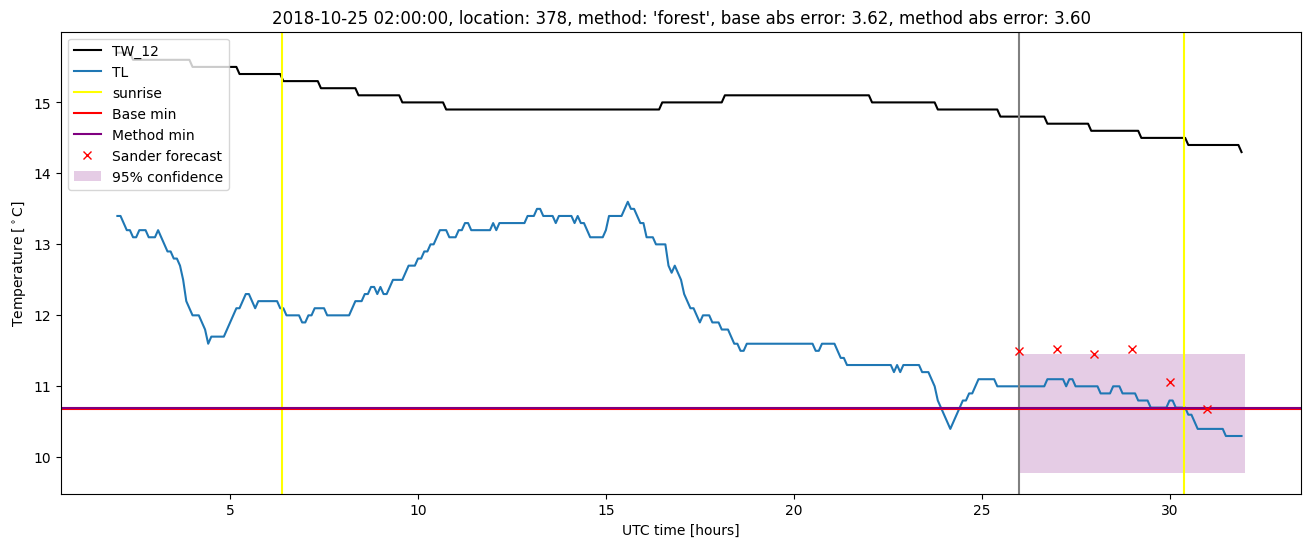
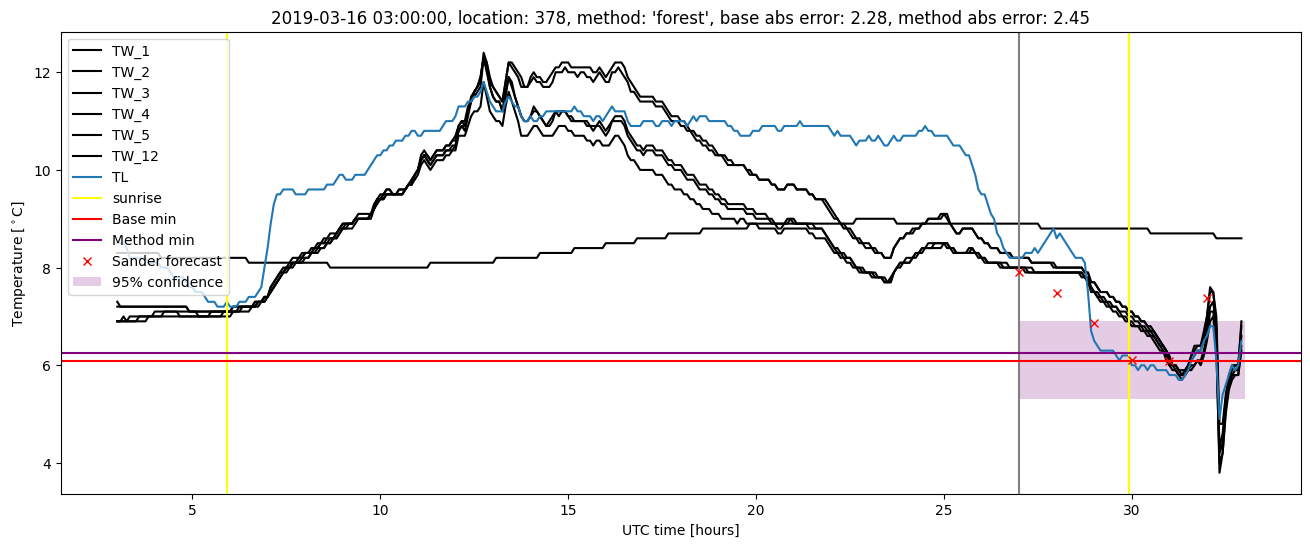
| forest |
winter 2019 |
1.000 |
0.000e+00 |
0.448 |
0.455 |
3.599 |
0.451 |
1.990 |
| baseline |
all |
0.988 |
0.081 |
0.467 |
0.499 |
3.619 |
NaN |
NaN |
| forest |
all |
0.990 |
0.063 |
0.372 |
0.443 |
3.599 |
0.457 |
2.004 |
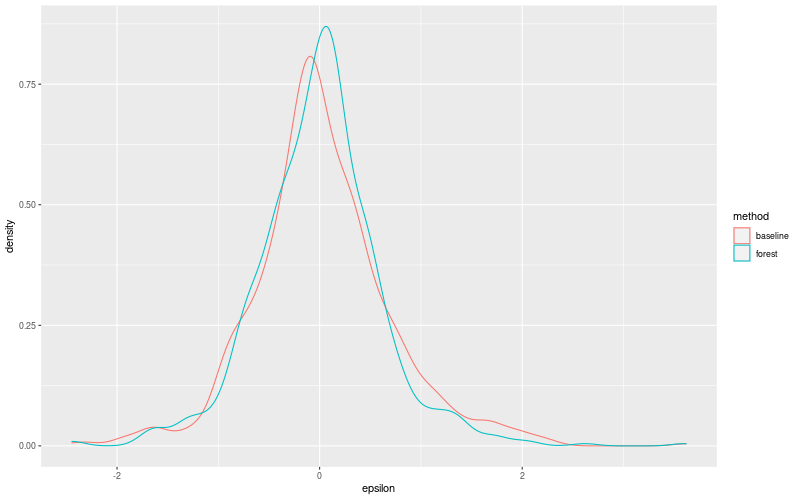
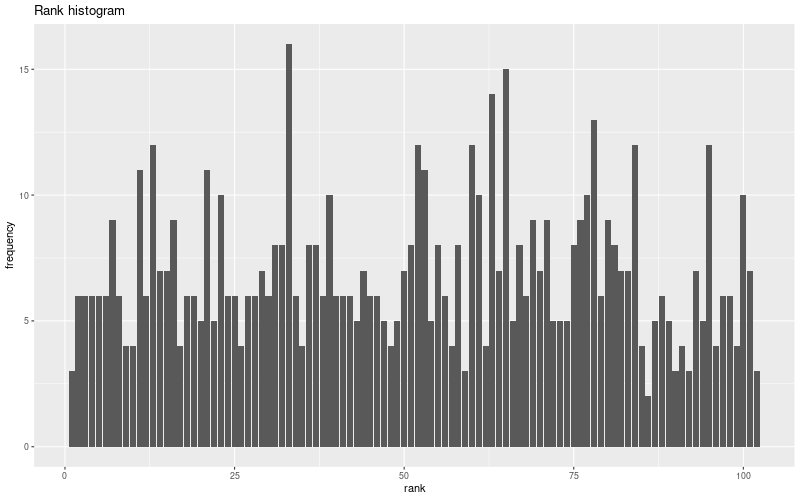
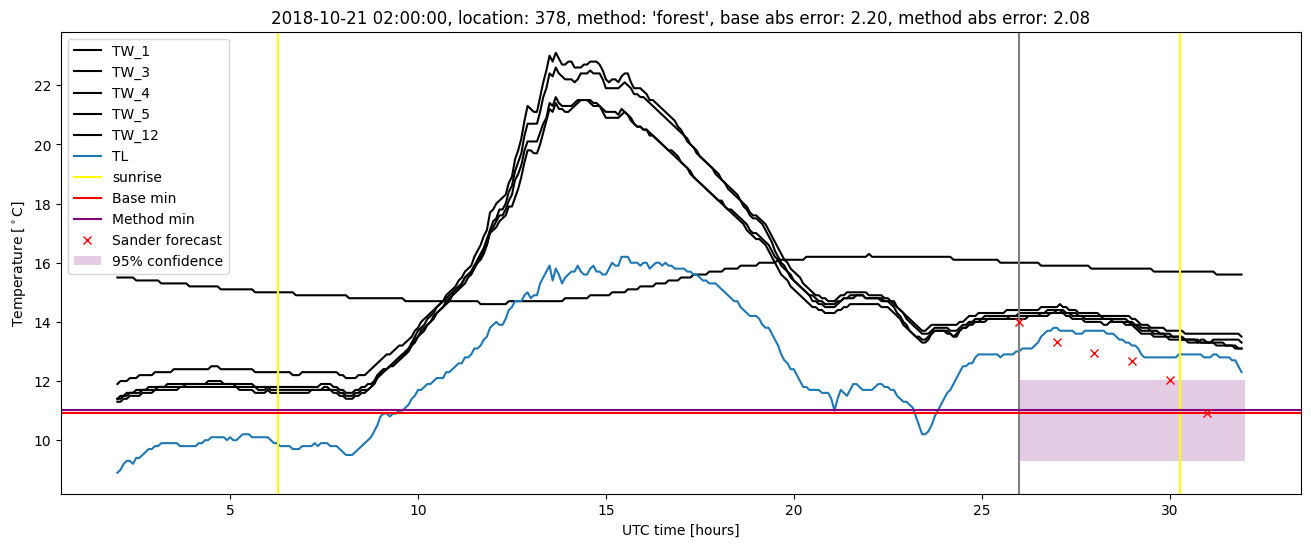
Random forest plots

Extended logistic regression results
| names |
period |
power |
significance |
meanSquareError |
absError |
maxError |
CRPS |
IGN |
| baseline |
winter 2016 |
0.984 |
0.105 |
0.421 |
0.485 |
2.401 |
NaN |
NaN |
| elr |
winter 2016 |
0.995 |
0.158 |
0.355 |
0.457 |
2.377 |
0.519 |
3.056 |
| baseline |
winter 2017 |
0.965 |
0.077 |
0.515 |
0.537 |
2.176 |
NaN |
NaN |
| elr |
winter 2017 |
0.956 |
0.051 |
0.398 |
0.488 |
1.804 |
0.526 |
3.229 |
| baseline |
winter 2018 |
1.000 |
0.083 |
0.395 |
0.475 |
2.297 |
NaN |
NaN |
| elr |
winter 2018 |
0.993 |
0.083 |
0.350 |
0.442 |
2.428 |
0.521 |
2.964 |
| baseline |
winter 2019 |
1.000 |
0.059 |
0.556 |
0.506 |
3.619 |
NaN |
NaN |
| elr |
winter 2019 |
1.000 |
0.000e+00 |
0.477 |
0.478 |
3.862 |
0.502 |
3.477 |
| baseline |
all |
0.988 |
0.081 |
0.467 |
0.499 |
3.619 |
NaN |
NaN |
| elr |
all |
0.988 |
0.072 |
0.392 |
0.465 |
3.862 |
0.517 |
3.172 |
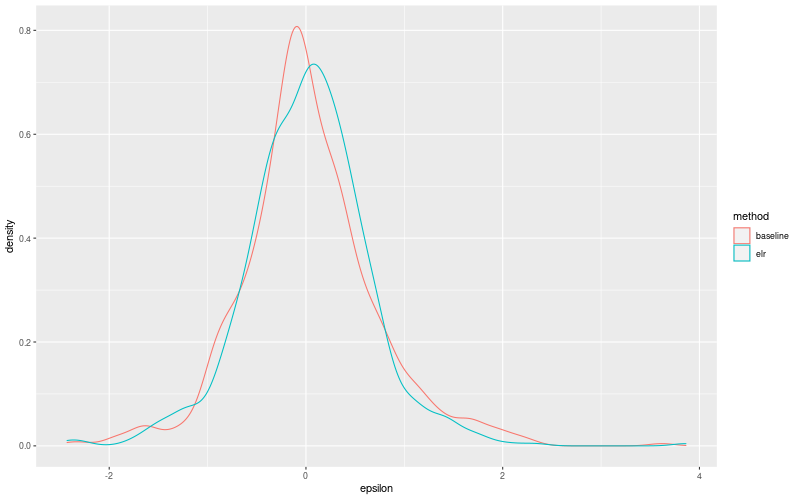
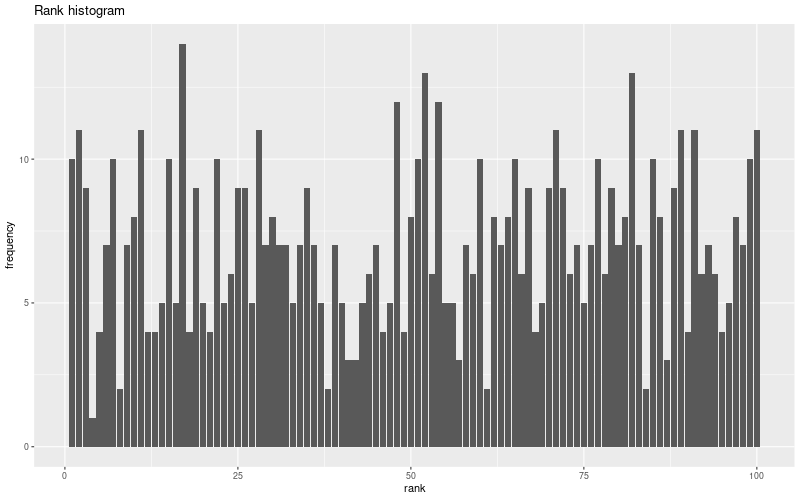
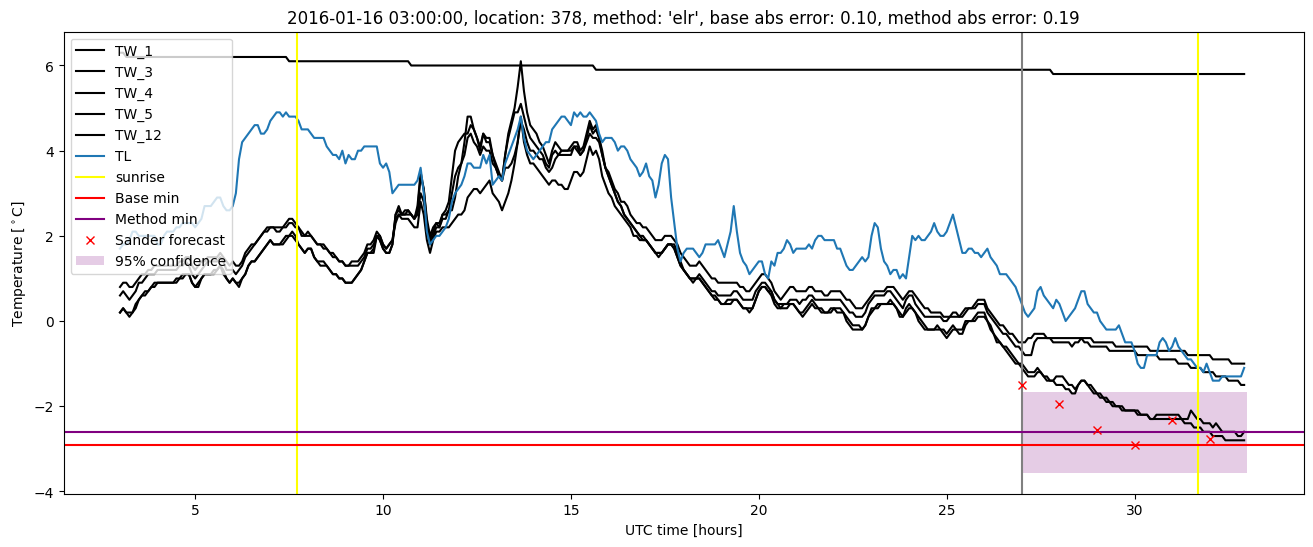
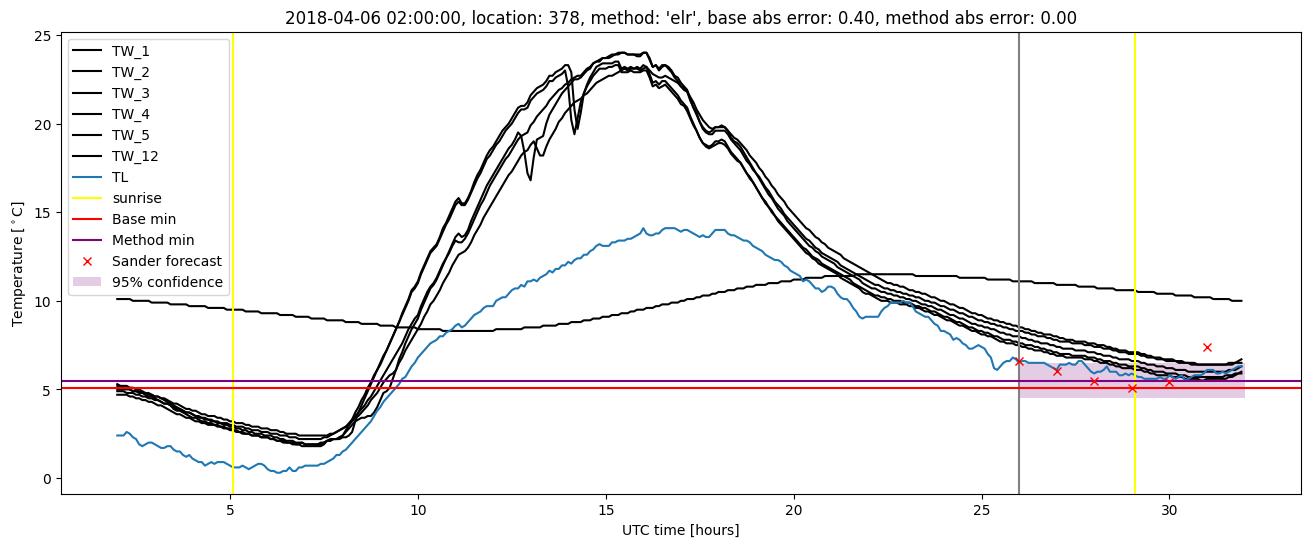
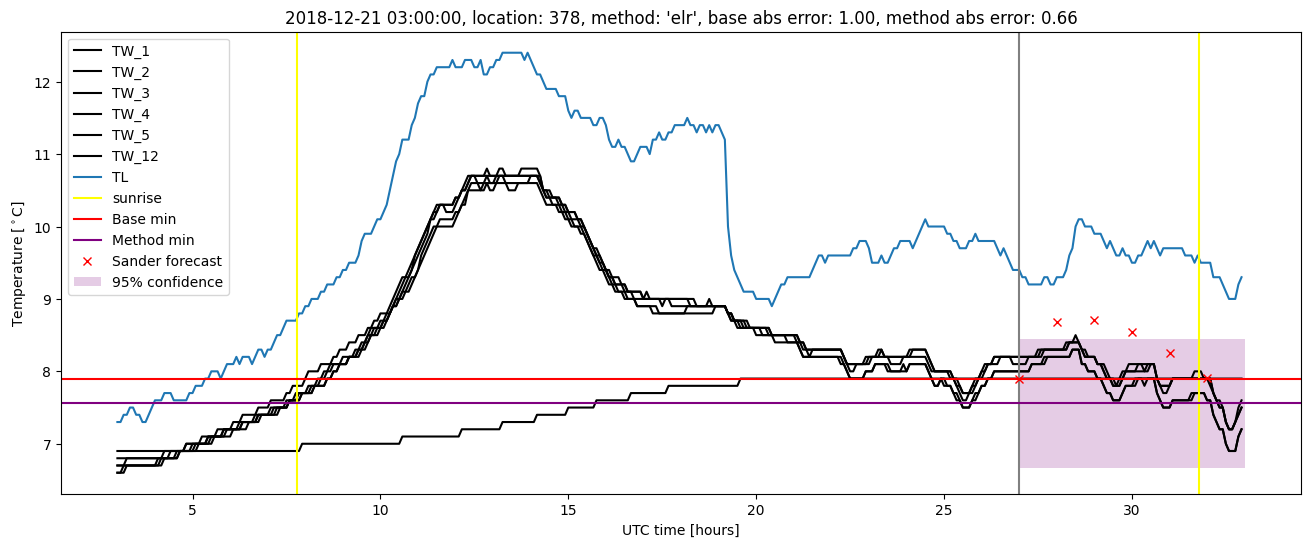
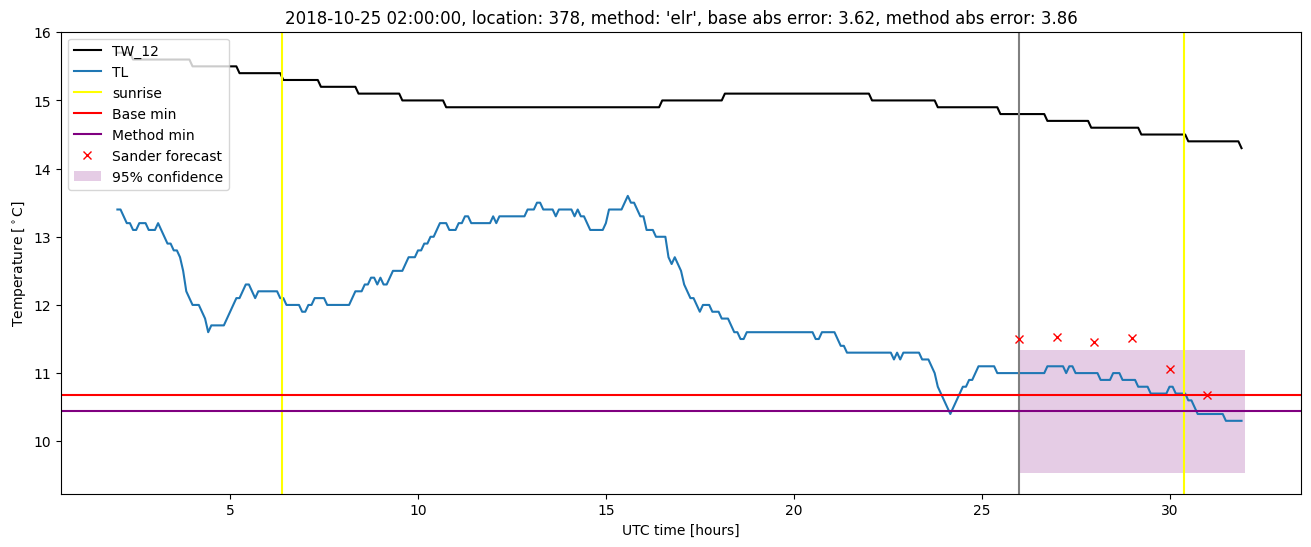
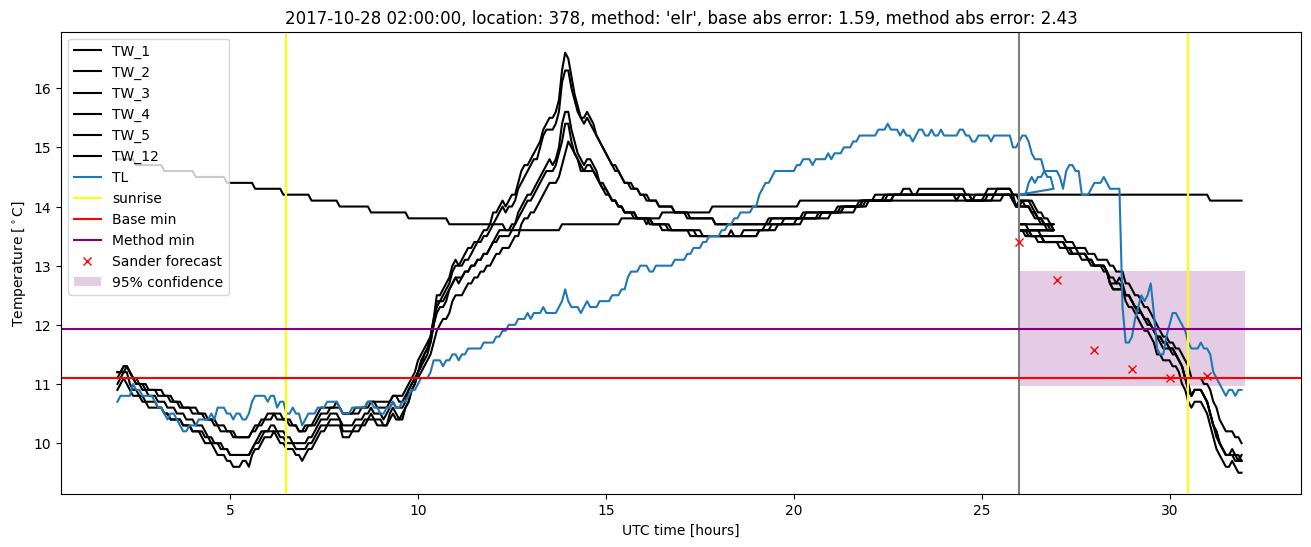
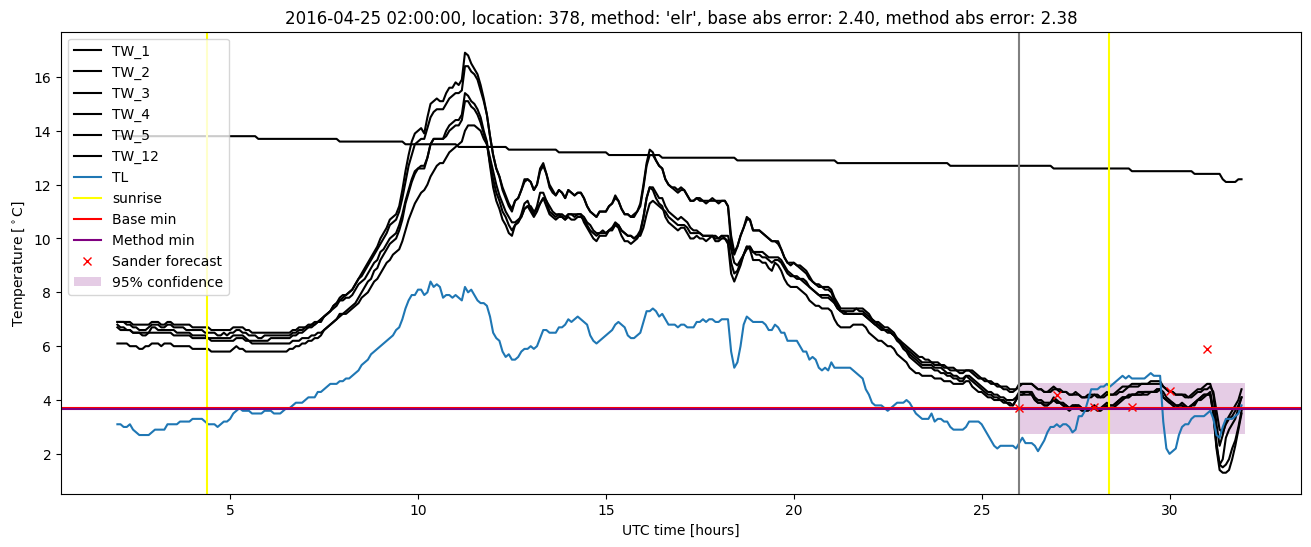
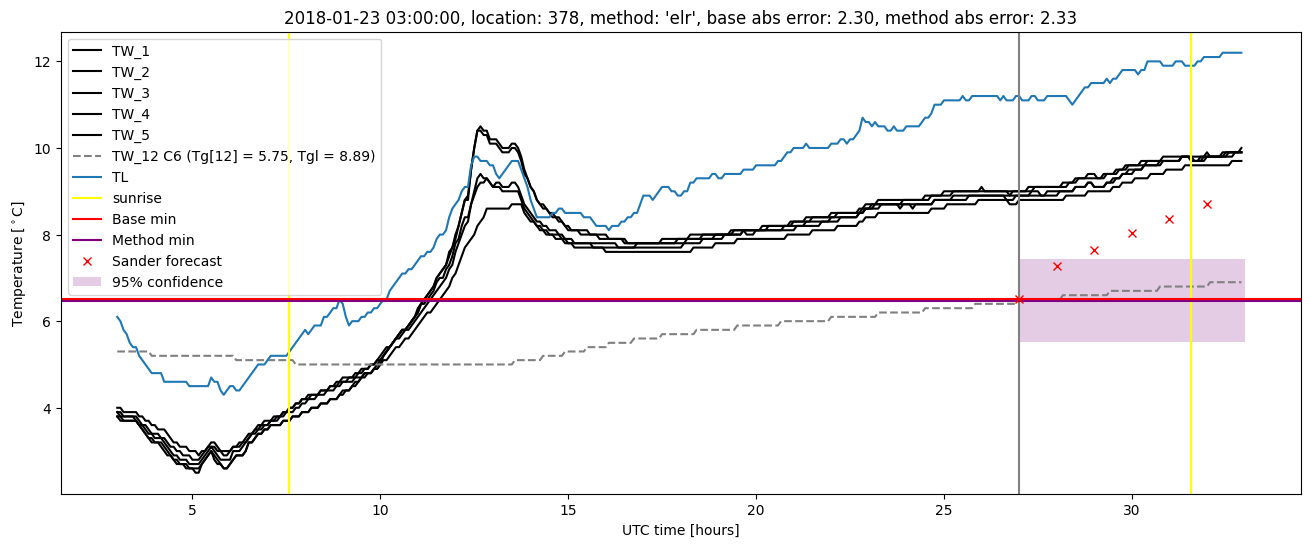
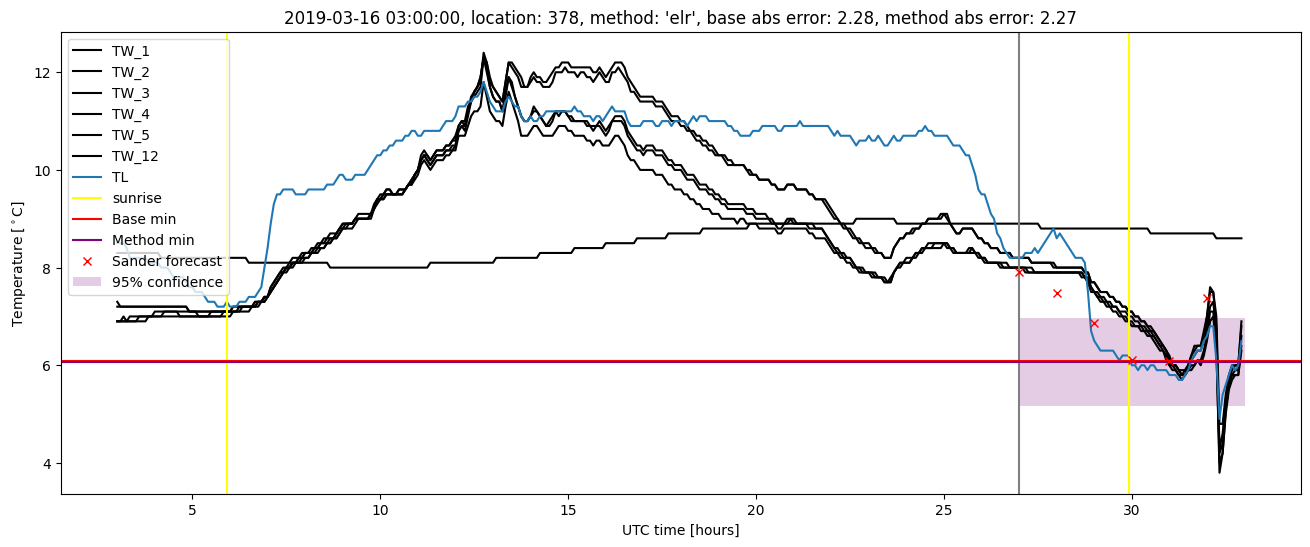
Extended logistic regression plots