GMS location: 377
Random forest results
| names |
period |
power |
significance |
meanSquareError |
absError |
maxError |
CRPS |
IGN |
| baseline |
winter 2016 |
0.978 |
0.000e+00 |
0.393 |
0.477 |
1.999 |
NaN |
NaN |
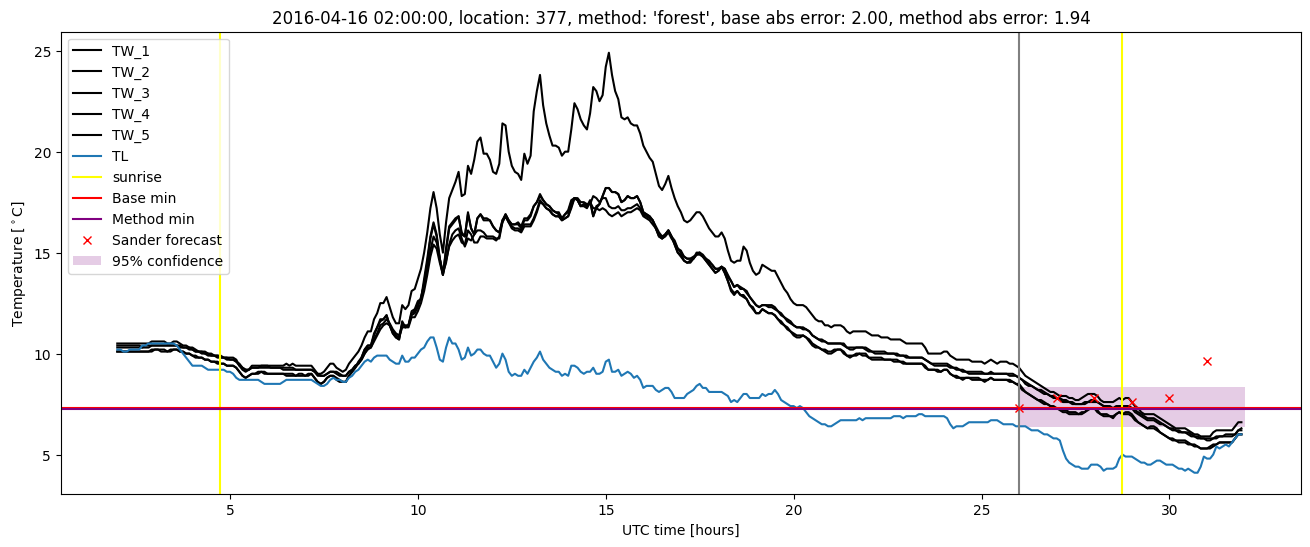
| forest |
winter 2016 |
0.989 |
0.067 |
0.326 |
0.441 |
1.940 |
0.465 |
3.942 |
| baseline |
winter 2017 |
0.952 |
0.038 |
0.329 |
0.427 |
2.315 |
NaN |
NaN |
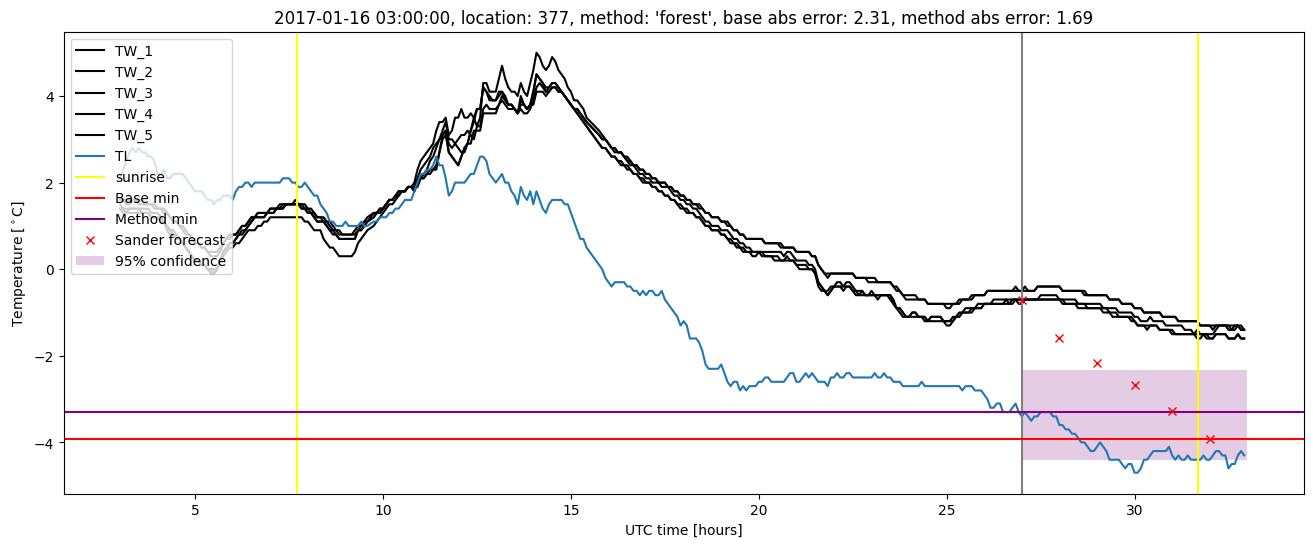
| forest |
winter 2017 |
0.960 |
0.038 |
0.226 |
0.366 |
1.687 |
0.451 |
2.848 |
| baseline |
winter 2018 |
0.990 |
0.103 |
0.288 |
0.414 |
1.676 |
NaN |
NaN |
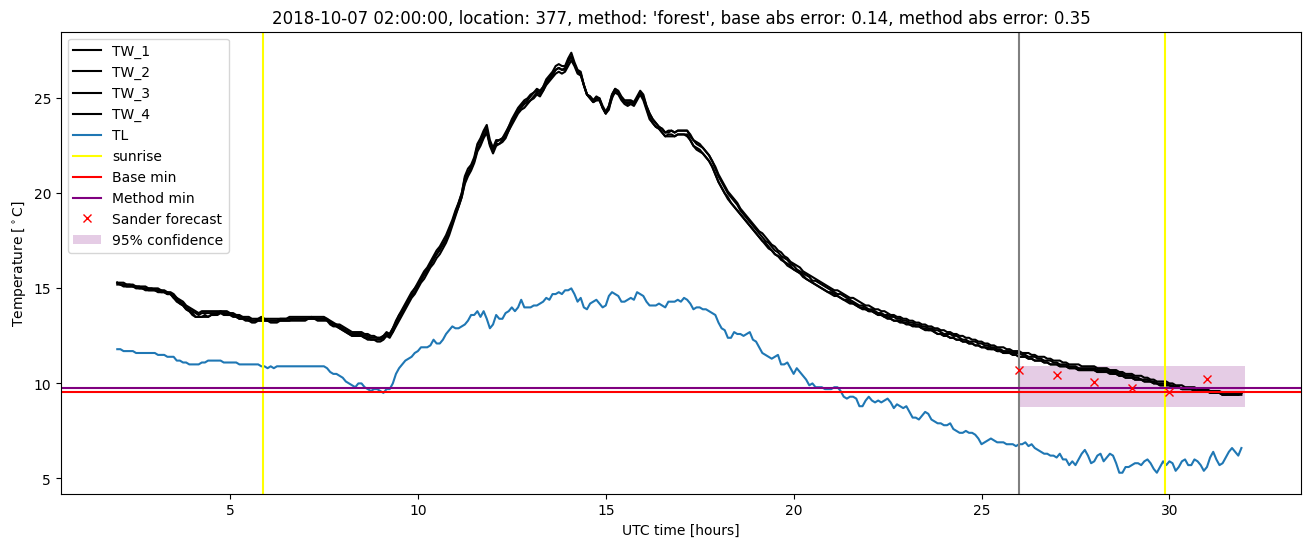
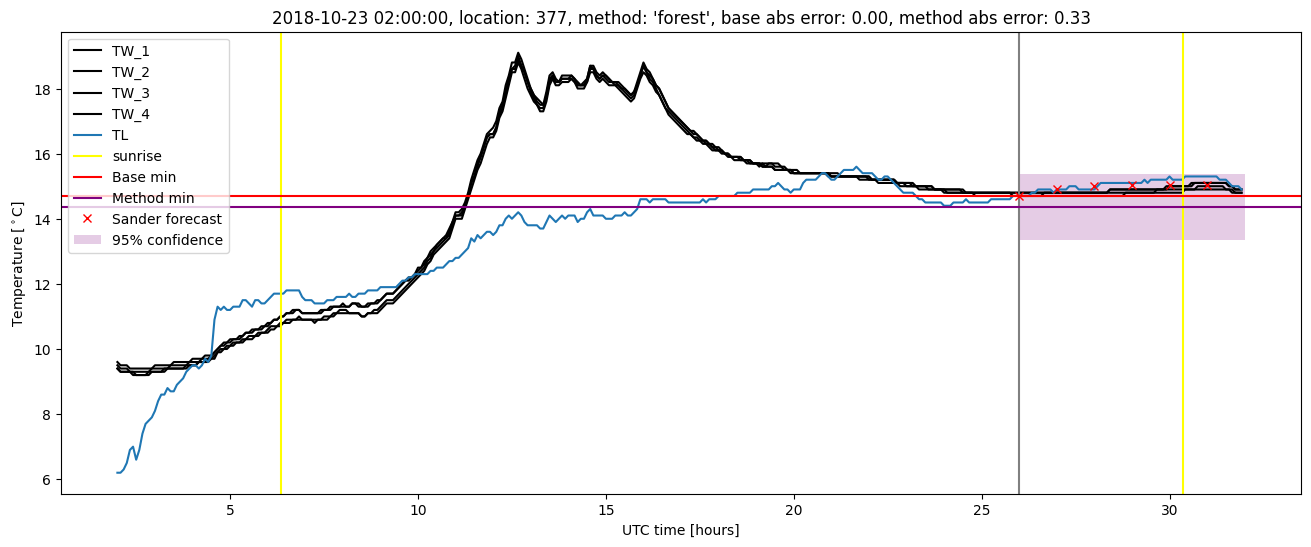
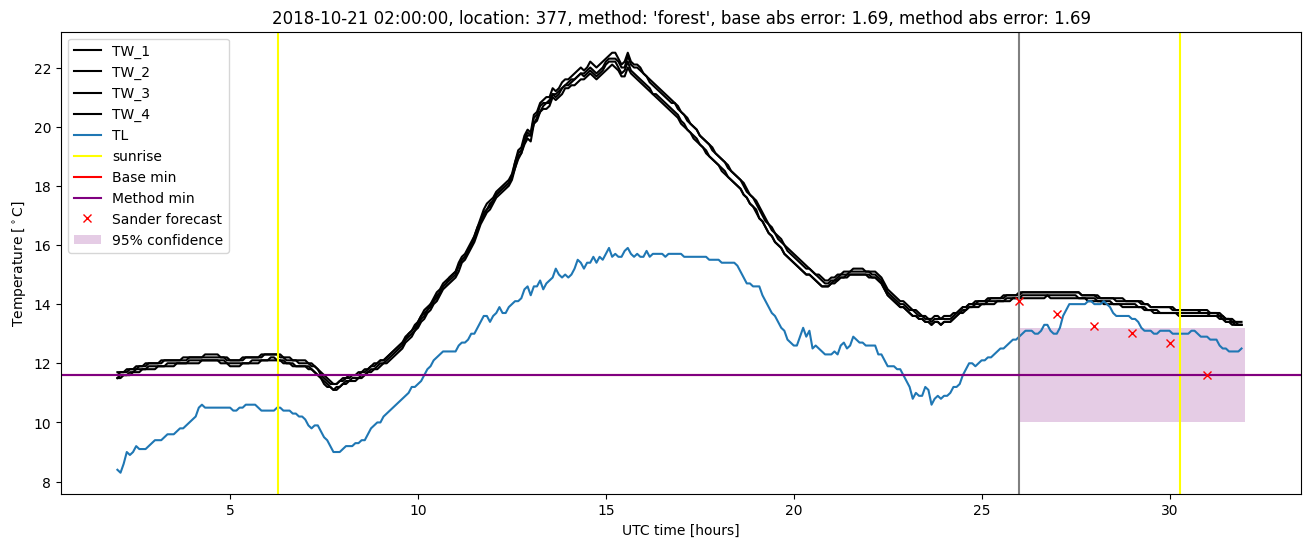
| forest |
winter 2018 |
0.990 |
0.172 |
0.282 |
0.405 |
1.705 |
0.478 |
3.585 |
| baseline |
winter 2019 |
0.987 |
0.091 |
0.284 |
0.390 |
1.997 |
NaN |
NaN |
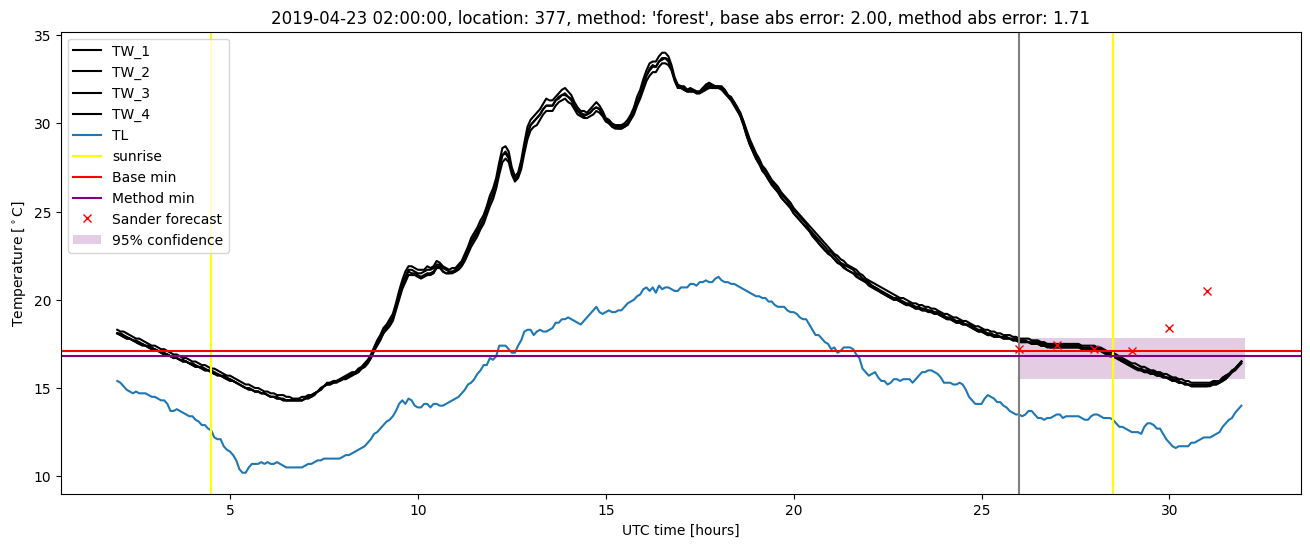
| forest |
winter 2019 |
0.987 |
0.091 |
0.273 |
0.385 |
1.714 |
0.459 |
2.726 |
| baseline |
all |
0.977 |
0.062 |
0.330 |
0.430 |
2.315 |
NaN |
NaN |
| forest |
all |
0.982 |
0.099 |
0.280 |
0.402 |
1.940 |
0.463 |
3.307 |
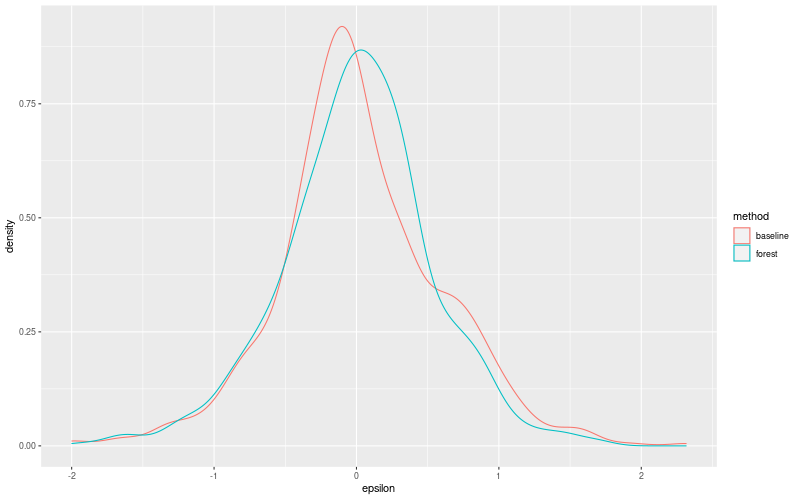
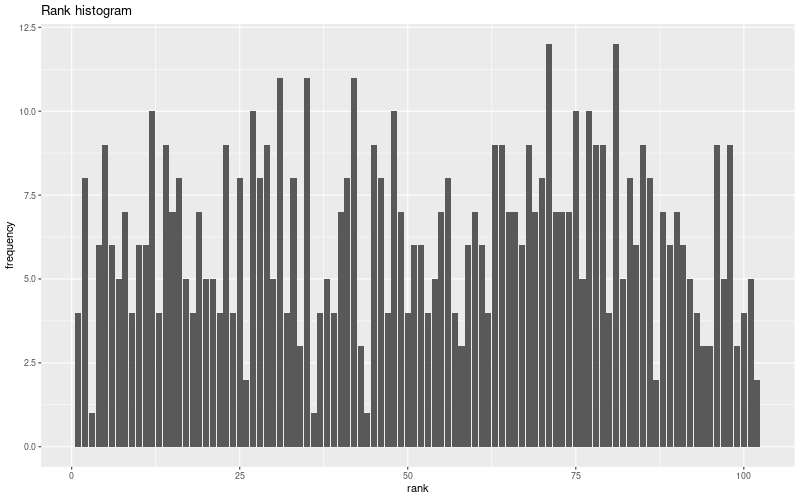
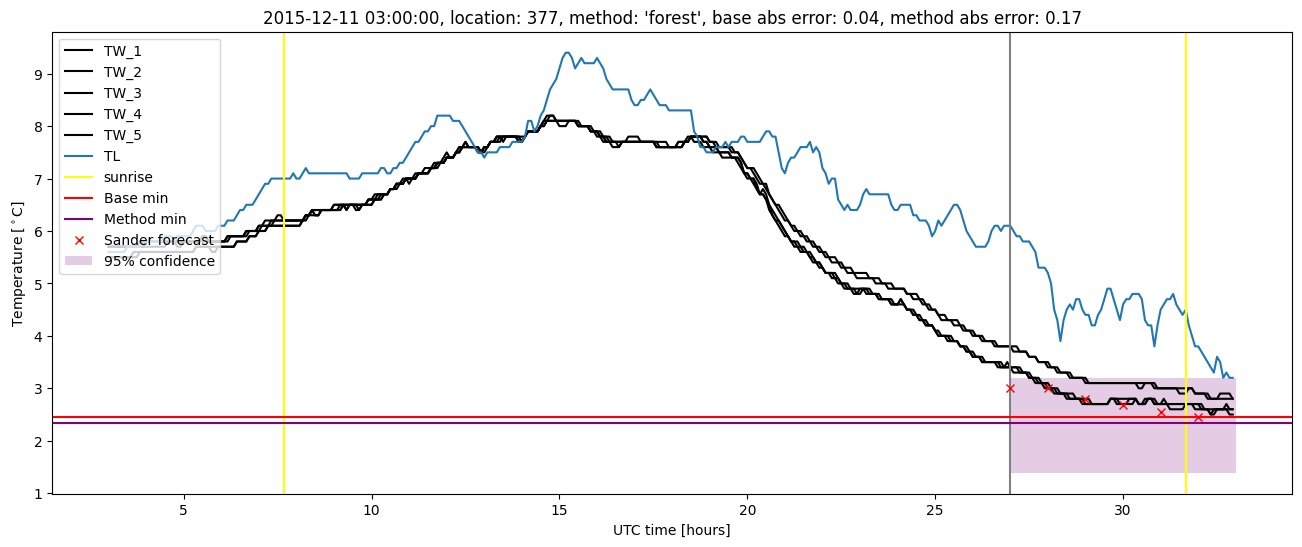
Random forest plots

Extended logistic regression results
| names |
period |
power |
significance |
meanSquareError |
absError |
maxError |
CRPS |
IGN |
| baseline |
winter 2016 |
0.978 |
0.000e+00 |
0.393 |
0.477 |
1.999 |
NaN |
NaN |
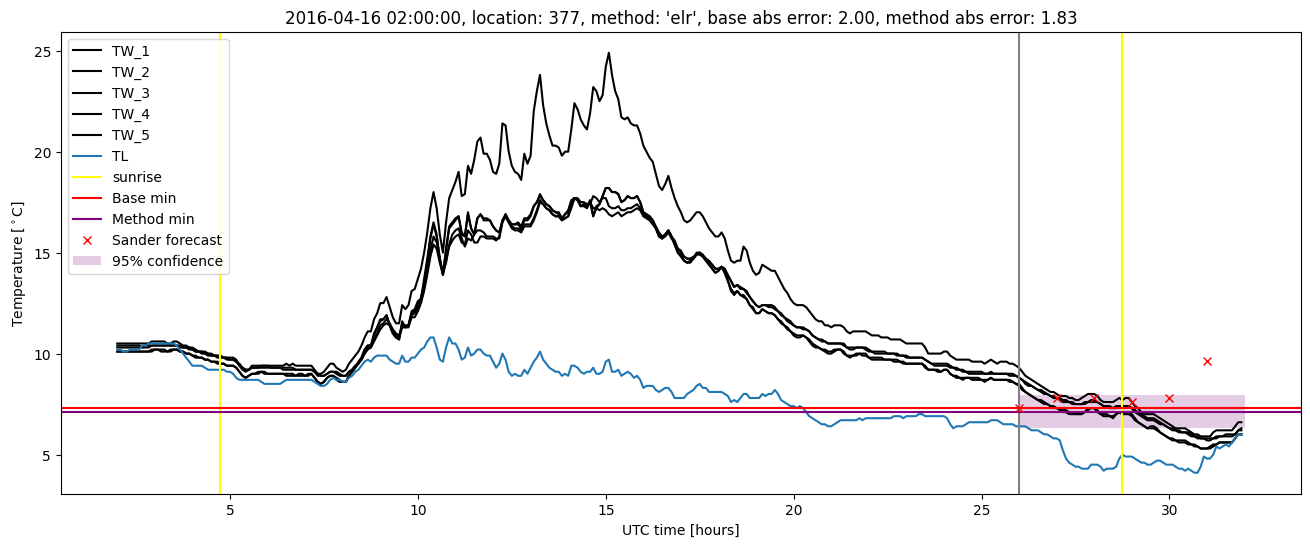
| elr |
winter 2016 |
0.984 |
0.000e+00 |
0.326 |
0.443 |
1.831 |
0.509 |
5.312 |
| baseline |
winter 2017 |
0.952 |
0.038 |
0.329 |
0.427 |
2.315 |
NaN |
NaN |
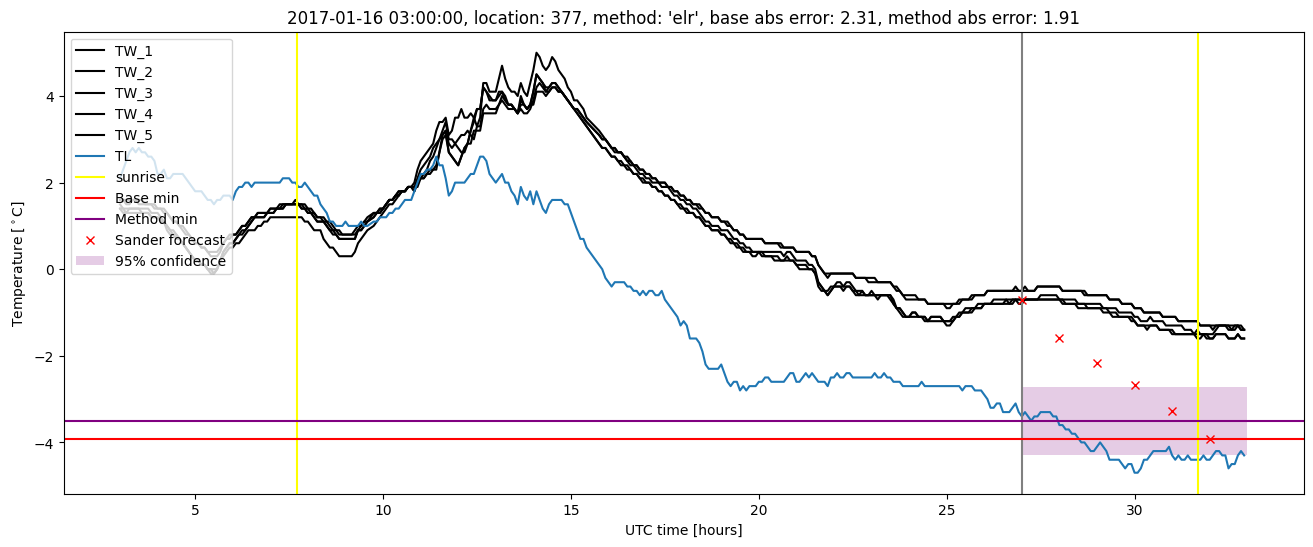
| elr |
winter 2017 |
0.968 |
0.038 |
0.266 |
0.391 |
1.912 |
0.487 |
5.109 |
| baseline |
winter 2018 |
0.990 |
0.103 |
0.288 |
0.414 |
1.676 |
NaN |
NaN |
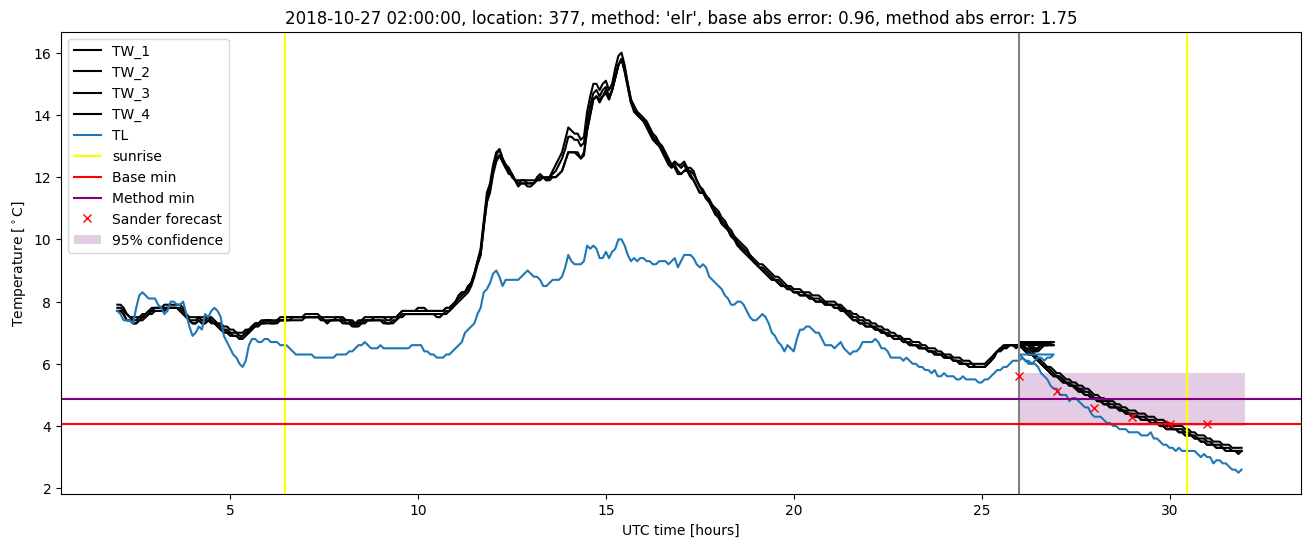
| elr |
winter 2018 |
0.990 |
0.138 |
0.295 |
0.414 |
1.748 |
0.579 |
6.438 |
| baseline |
winter 2019 |
0.987 |
0.091 |
0.284 |
0.390 |
1.997 |
NaN |
NaN |
| elr |
winter 2019 |
0.987 |
0.091 |
0.276 |
0.373 |
1.755 |
0.528 |
4.661 |
| baseline |
all |
0.977 |
0.062 |
0.330 |
0.430 |
2.315 |
NaN |
NaN |
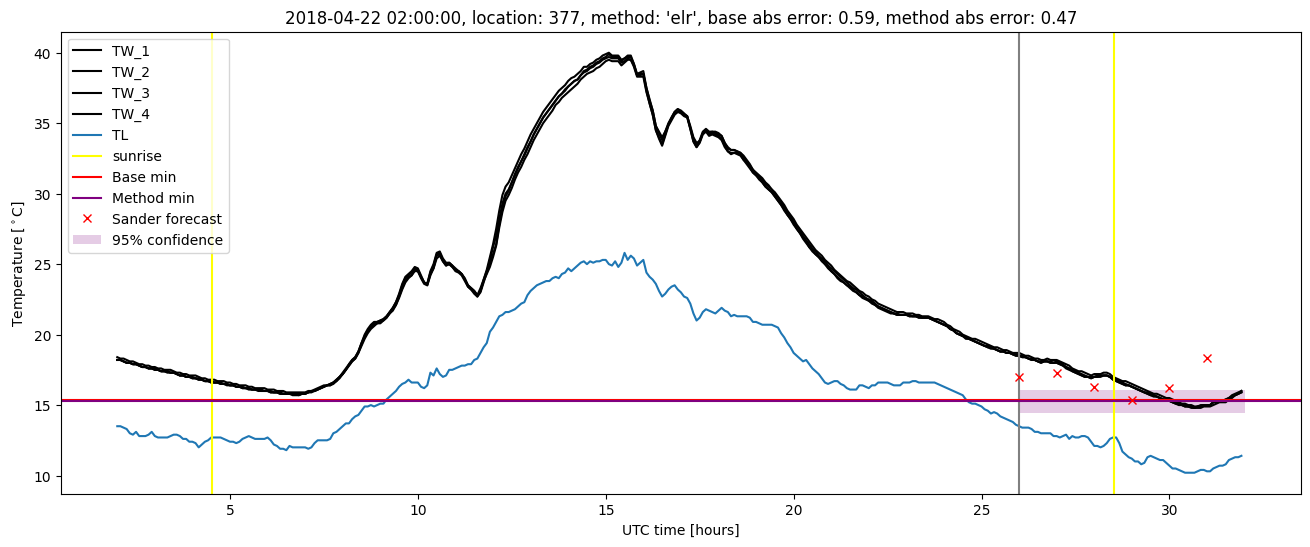
| elr |
all |
0.982 |
0.074 |
0.293 |
0.407 |
1.912 |
0.523 |
5.330 |
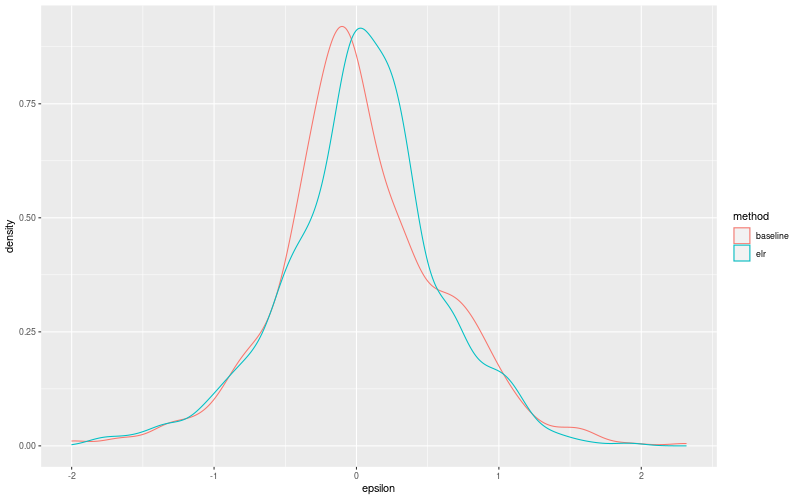
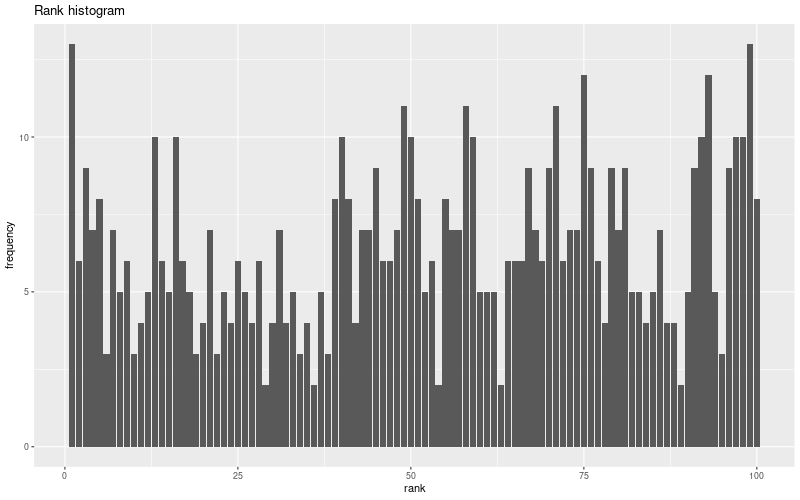
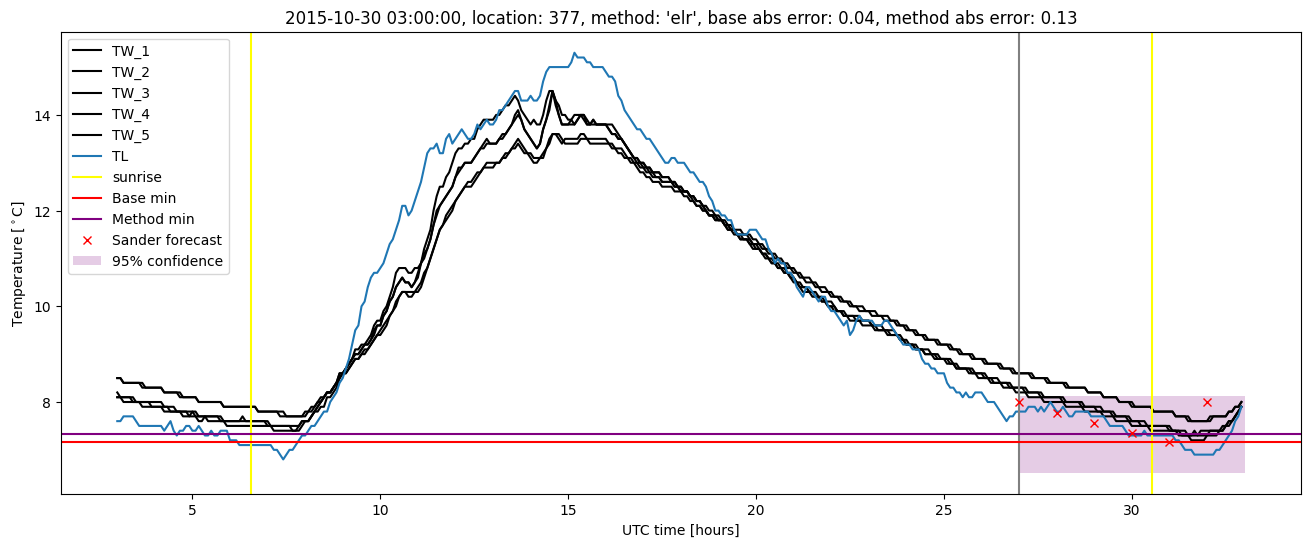
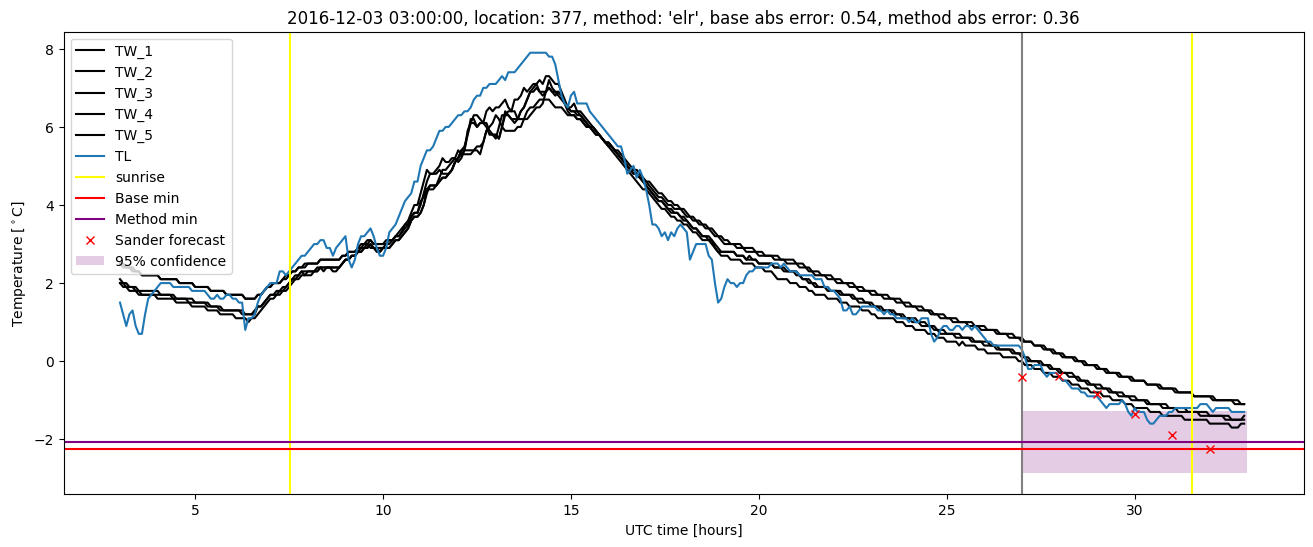
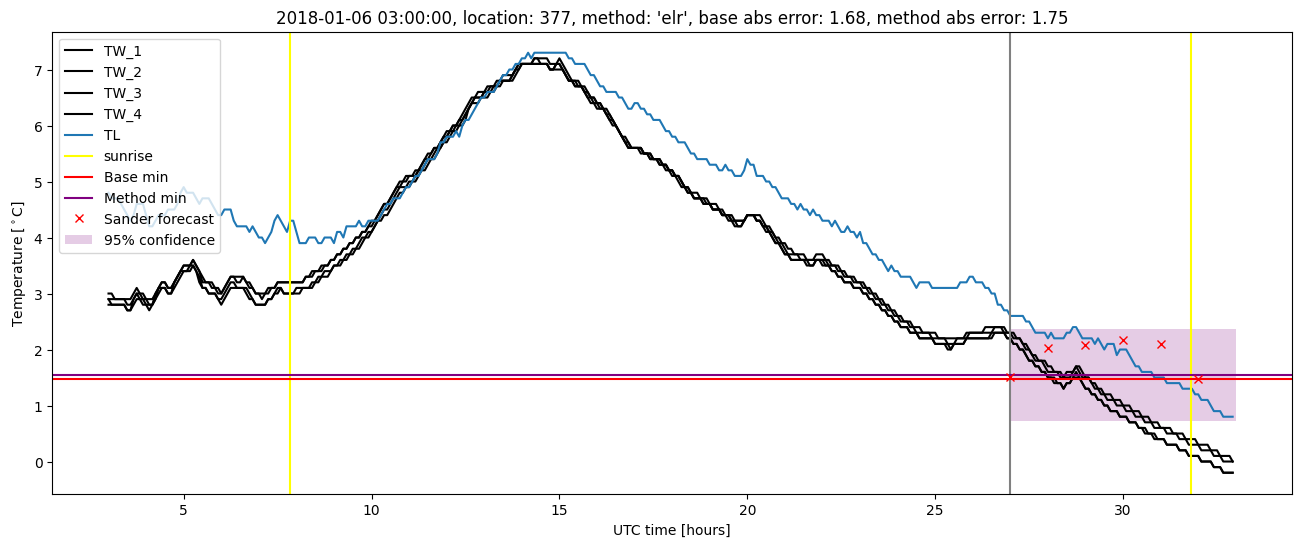
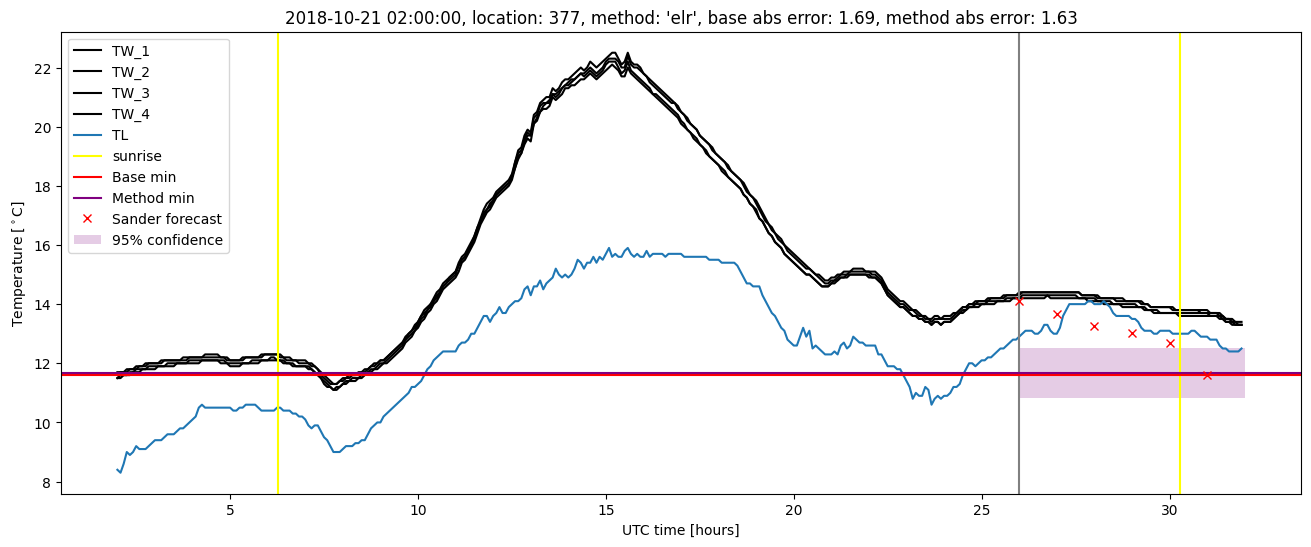
Extended logistic regression plots