GMS location: 376
Random forest results
| names |
period |
power |
significance |
meanSquareError |
absError |
maxError |
CRPS |
IGN |
| baseline |
winter 2016 |
0.995 |
0.000e+00 |
0.286 |
0.401 |
2.000 |
NaN |
NaN |
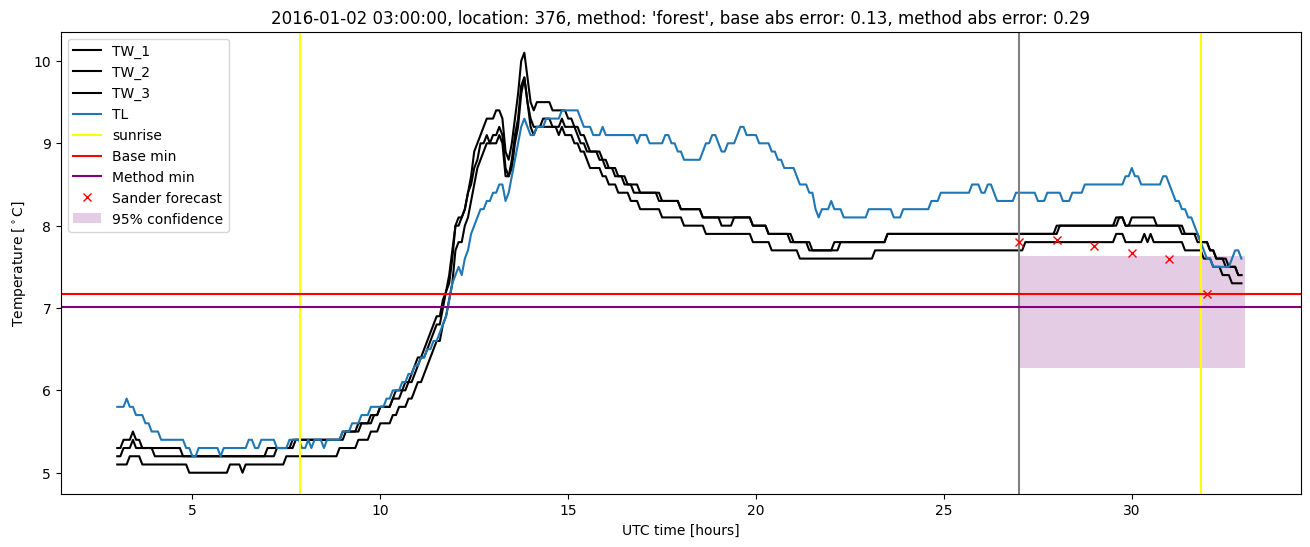
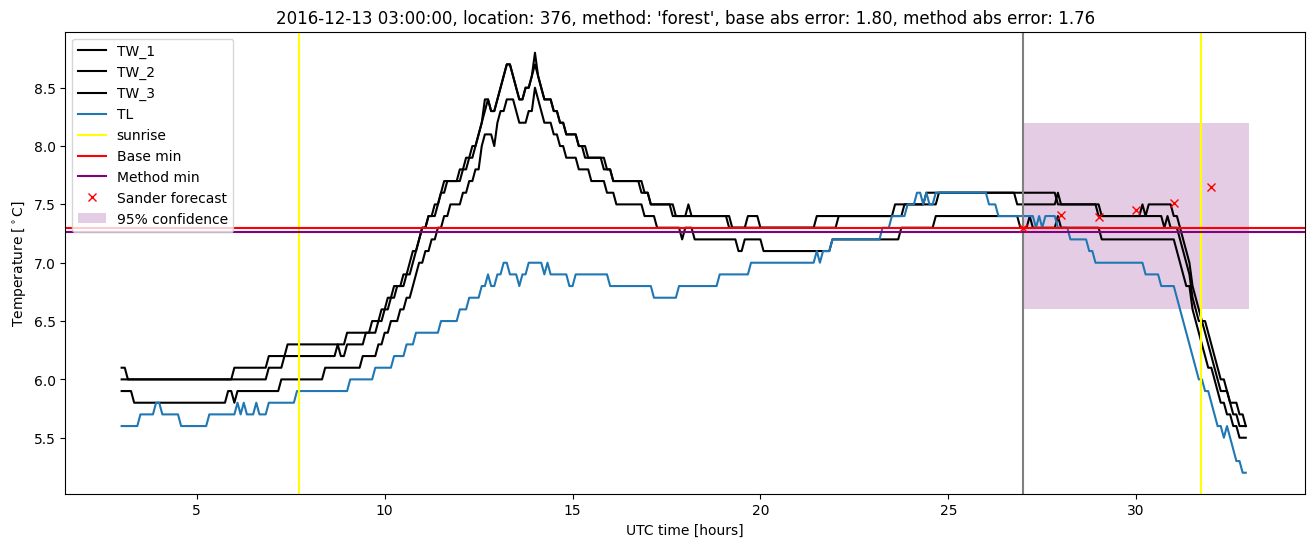
| forest |
winter 2016 |
1.000 |
0.182 |
0.265 |
0.390 |
1.932 |
0.476 |
2.878 |
| baseline |
winter 2017 |
0.985 |
0.045 |
0.380 |
0.448 |
2.188 |
NaN |
NaN |
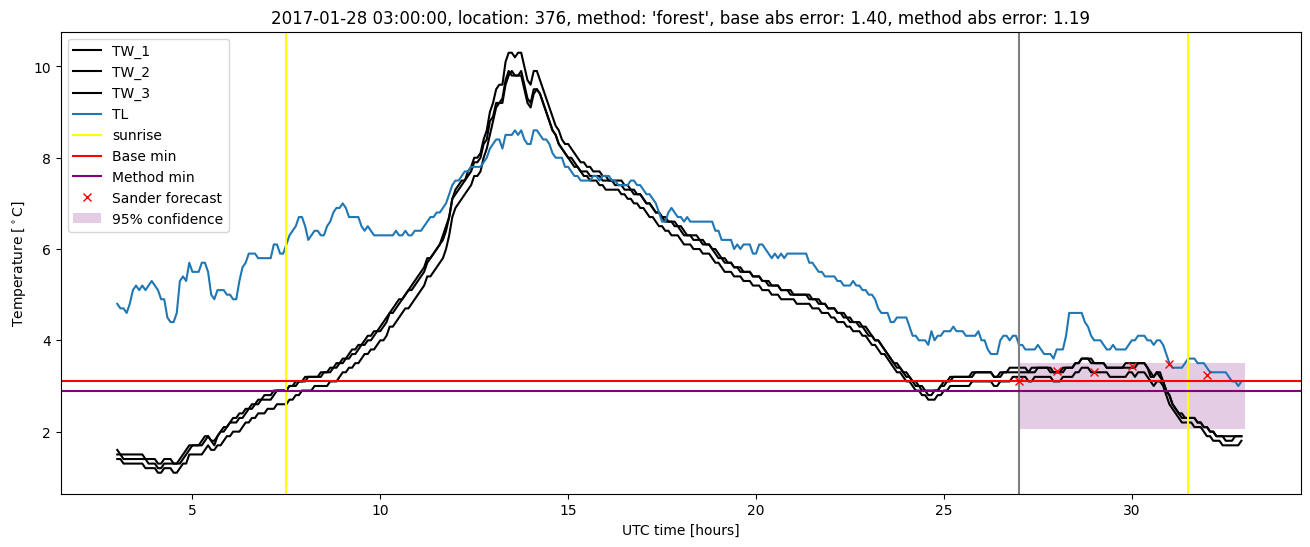
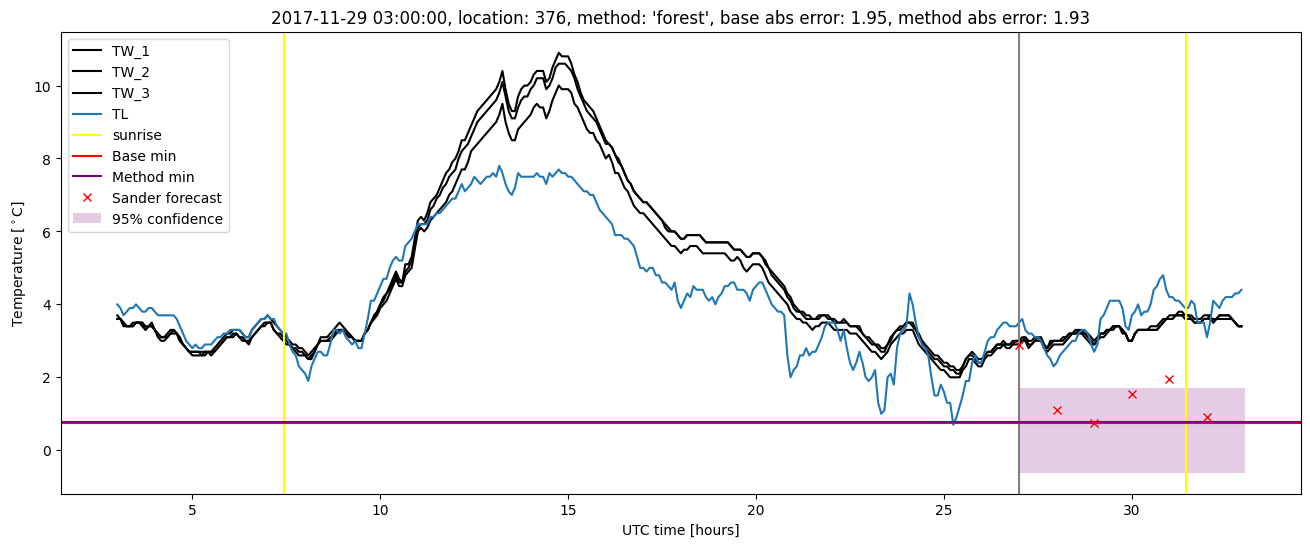
| forest |
winter 2017 |
0.985 |
0.045 |
0.301 |
0.409 |
1.764 |
0.479 |
3.078 |
| baseline |
winter 2018 |
0.988 |
0.100 |
0.377 |
0.407 |
4.575 |
NaN |
NaN |
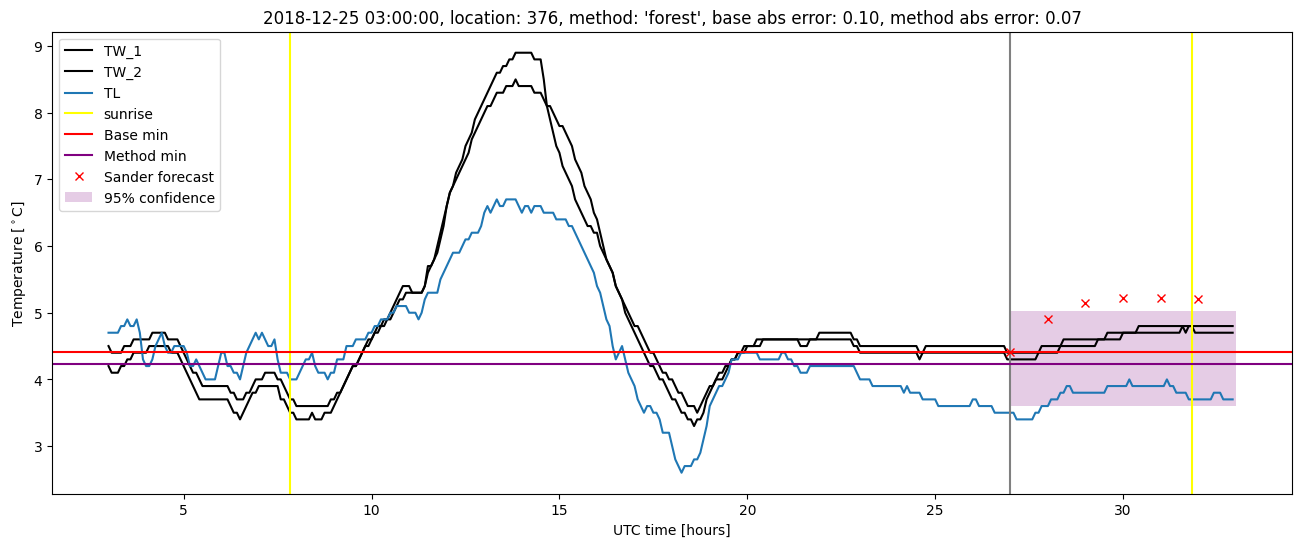
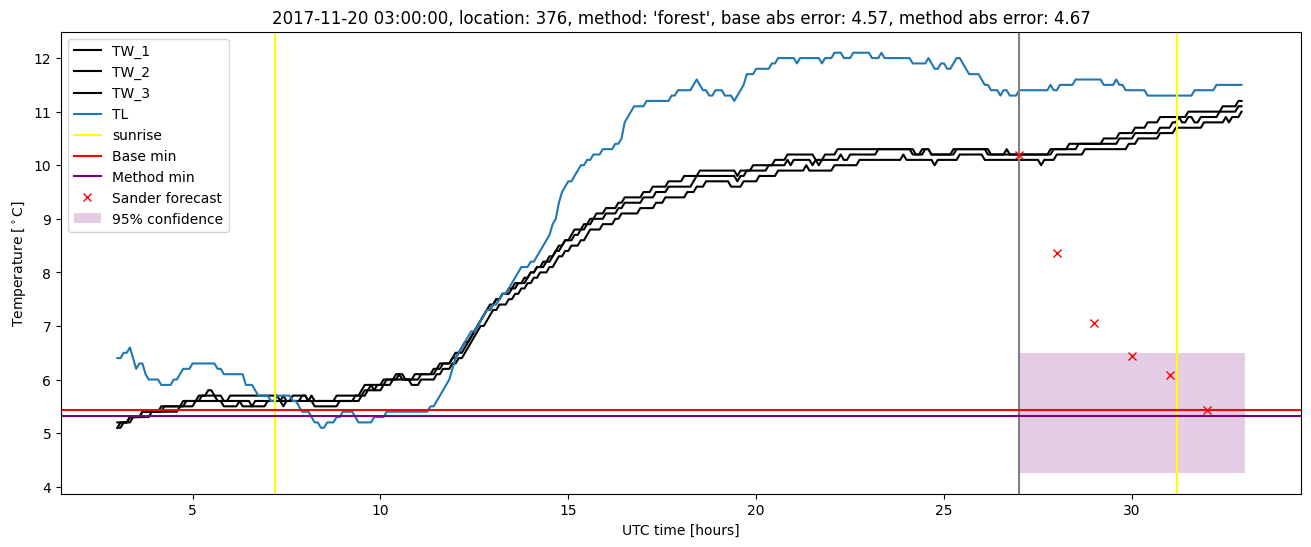
| forest |
winter 2018 |
0.982 |
0.050 |
0.357 |
0.381 |
4.673 |
0.510 |
3.646 |
| baseline |
winter 2019 |
0.987 |
0.000e+00 |
0.231 |
0.353 |
1.892 |
NaN |
NaN |
| forest |
winter 2019 |
0.987 |
0.000e+00 |
0.201 |
0.330 |
1.482 |
0.492 |
2.869 |
| baseline |
all |
0.989 |
0.048 |
0.318 |
0.402 |
4.575 |
NaN |
NaN |
| forest |
all |
0.989 |
0.065 |
0.283 |
0.378 |
4.673 |
0.489 |
3.120 |
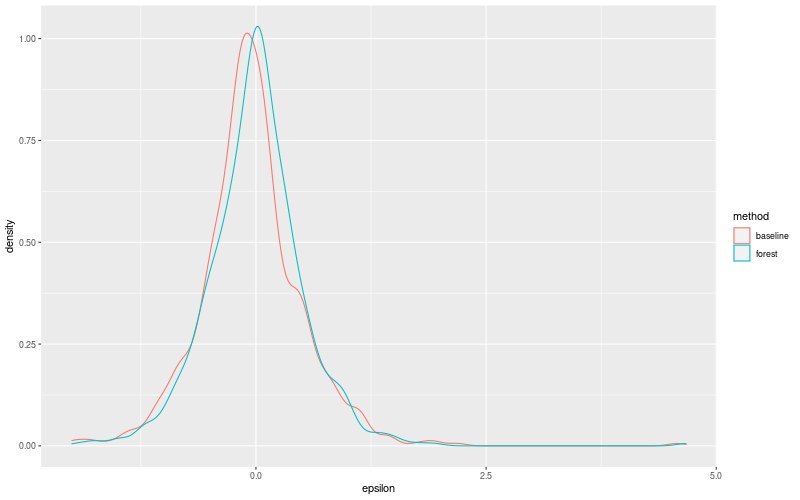
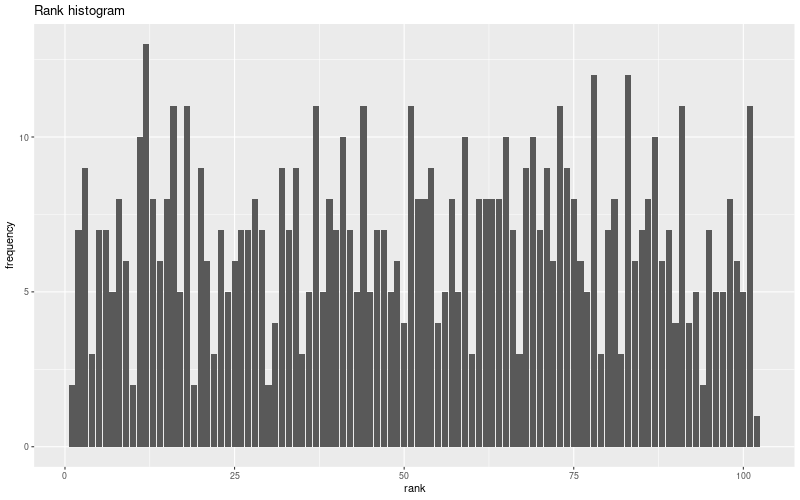
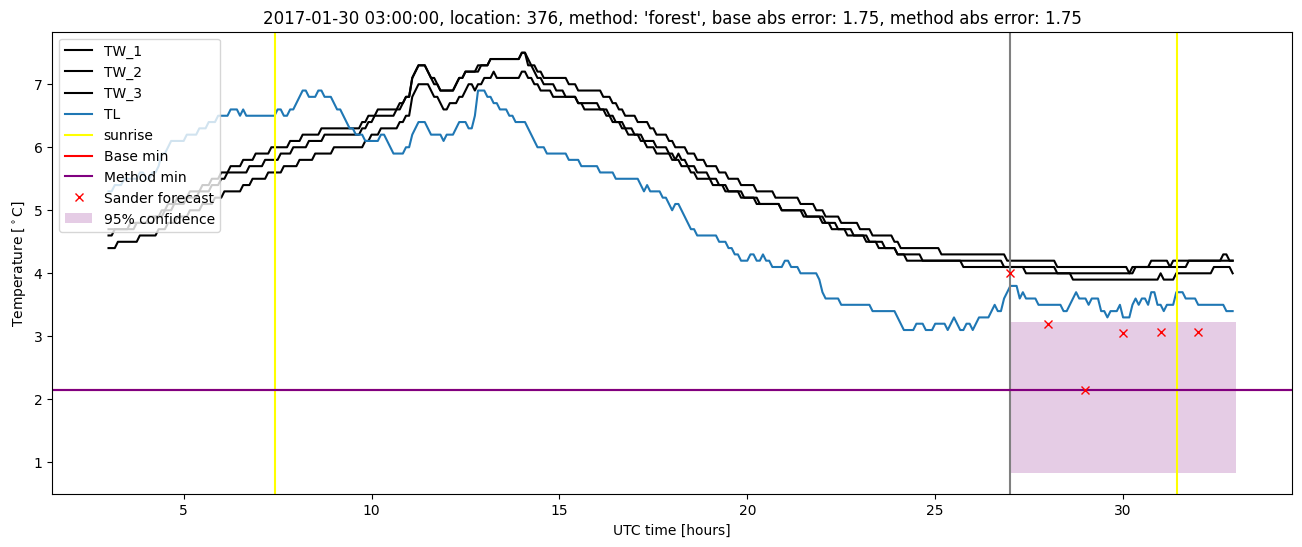
Random forest plots

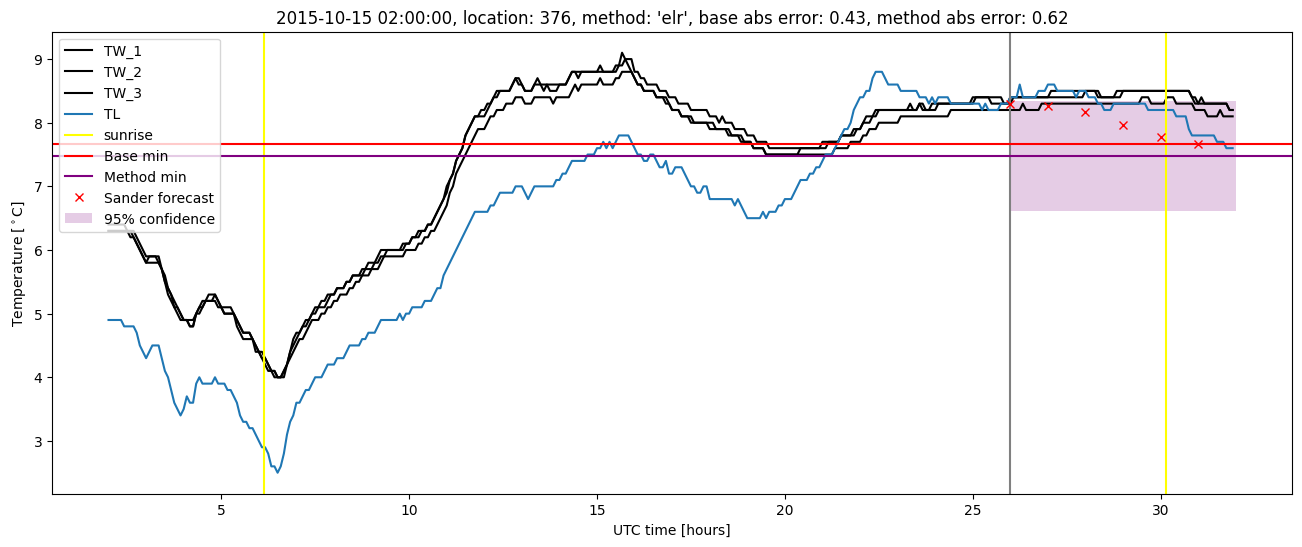
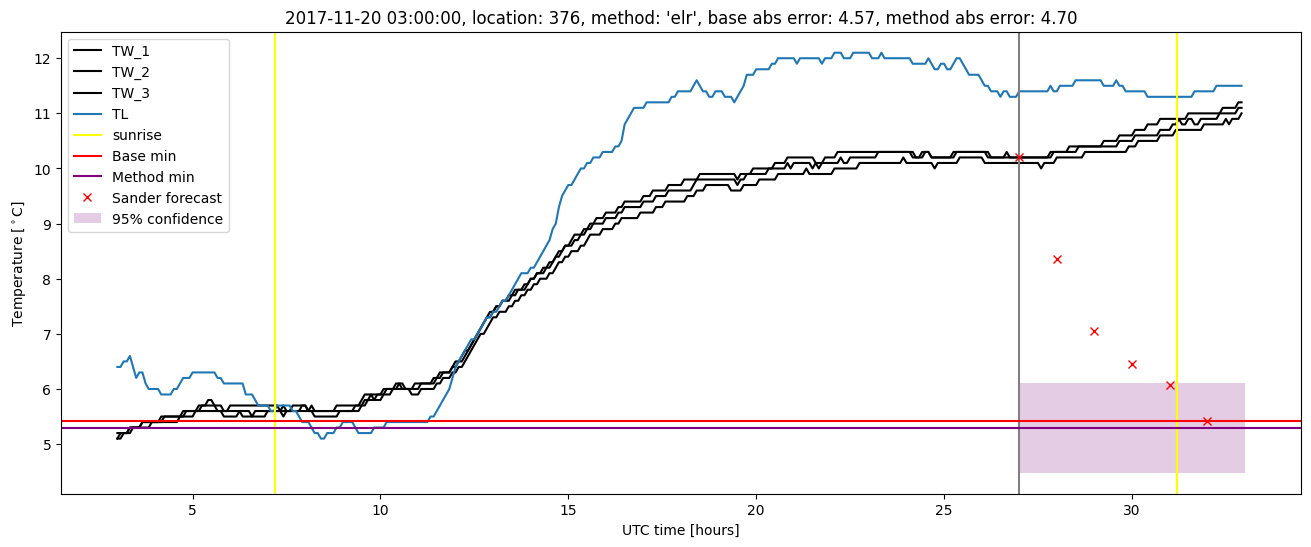
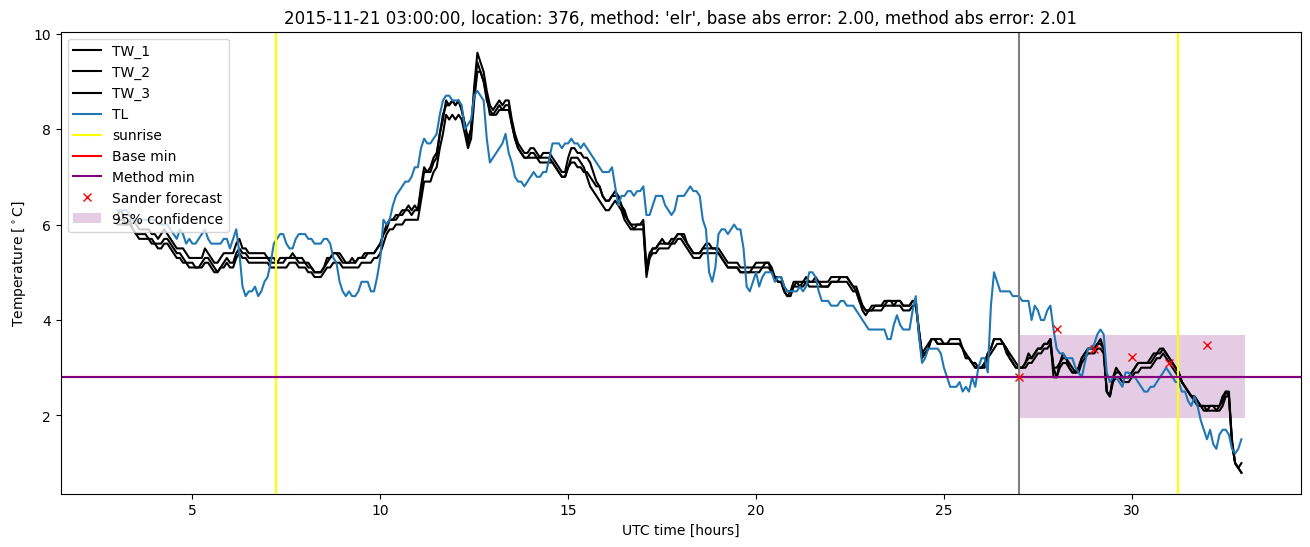
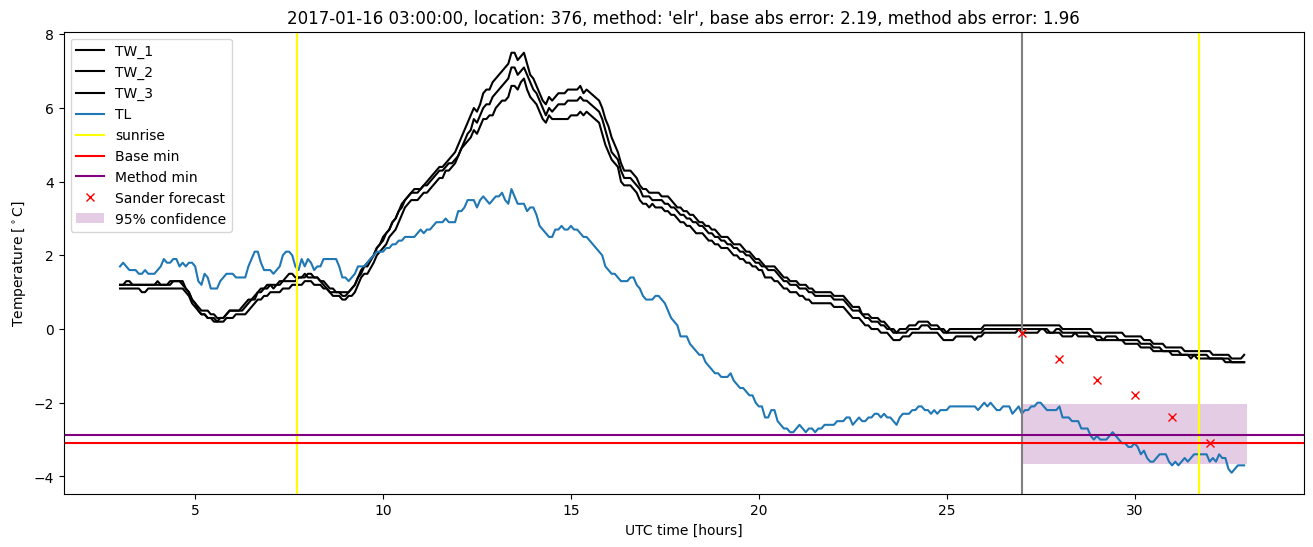
Extended logistic regression results
| names |
period |
power |
significance |
meanSquareError |
absError |
maxError |
CRPS |
IGN |
| baseline |
winter 2016 |
0.995 |
0.000e+00 |
0.286 |
0.401 |
2.000 |
NaN |
NaN |
| elr |
winter 2016 |
0.990 |
0.091 |
0.304 |
0.422 |
2.012 |
0.562 |
4.869 |
| baseline |
winter 2017 |
0.985 |
0.045 |
0.380 |
0.448 |
2.188 |
NaN |
NaN |
| elr |
winter 2017 |
0.970 |
0.045 |
0.360 |
0.459 |
1.964 |
0.540 |
5.748 |
| baseline |
winter 2018 |
0.988 |
0.100 |
0.377 |
0.407 |
4.575 |
NaN |
NaN |
| elr |
winter 2018 |
0.988 |
0.050 |
0.381 |
0.409 |
4.703 |
0.559 |
5.986 |
| baseline |
winter 2019 |
0.987 |
0.000e+00 |
0.231 |
0.353 |
1.892 |
NaN |
NaN |
| elr |
winter 2019 |
0.987 |
0.111 |
0.216 |
0.353 |
1.617 |
0.513 |
3.810 |
| baseline |
all |
0.989 |
0.048 |
0.318 |
0.402 |
4.575 |
NaN |
NaN |
| elr |
all |
0.984 |
0.065 |
0.316 |
0.411 |
4.703 |
0.545 |
5.115 |
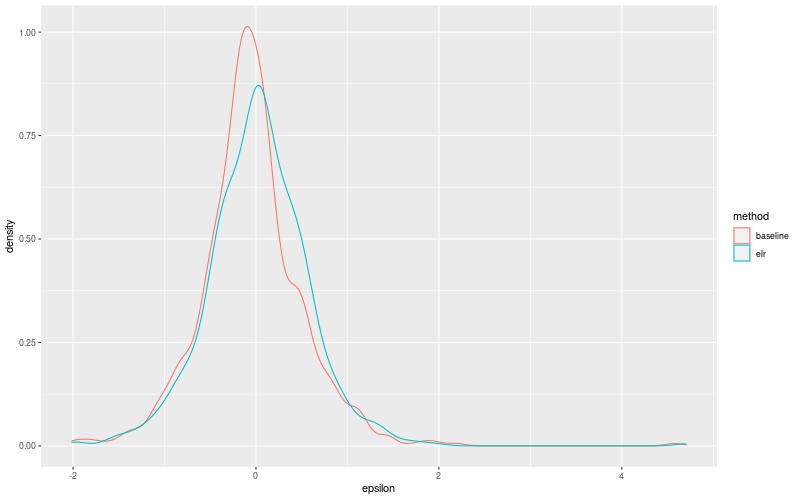
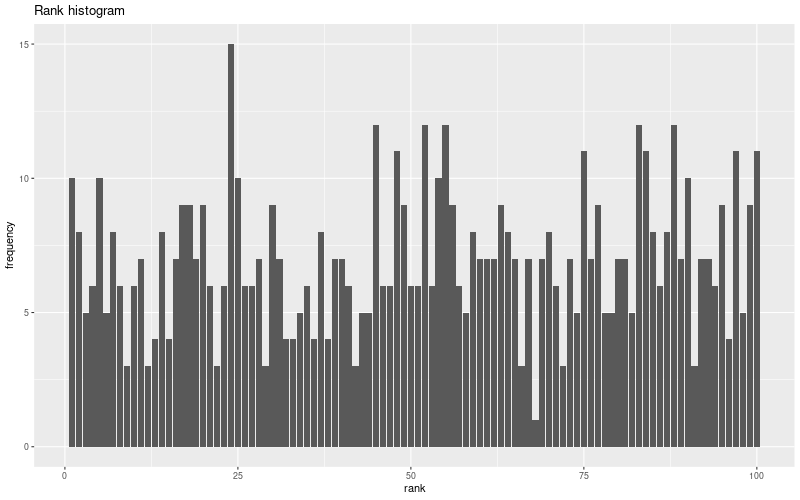
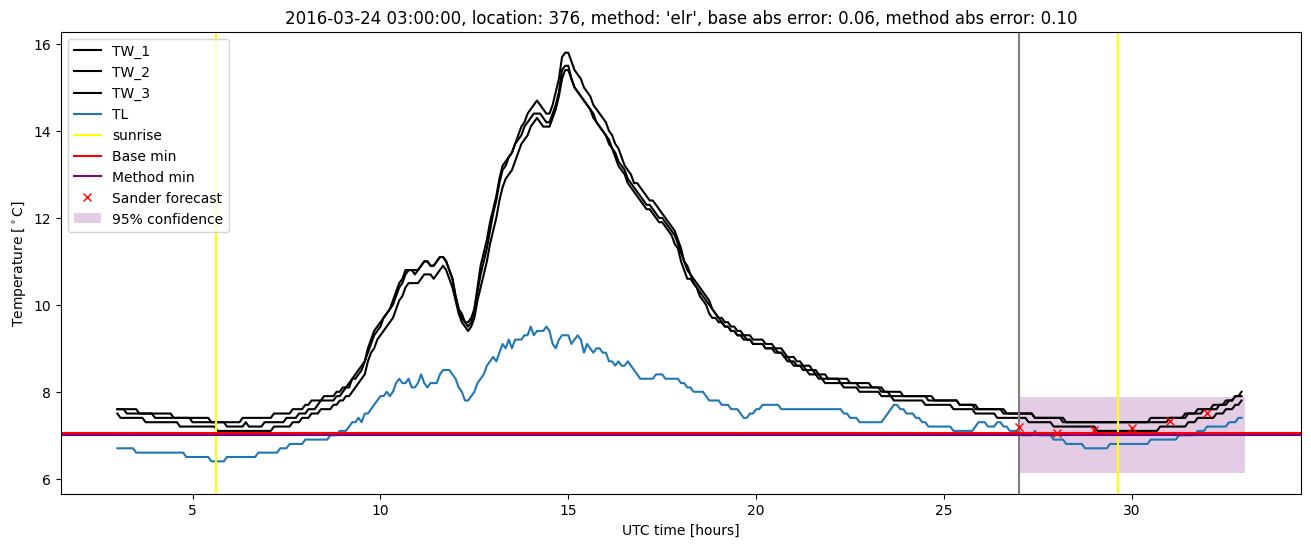
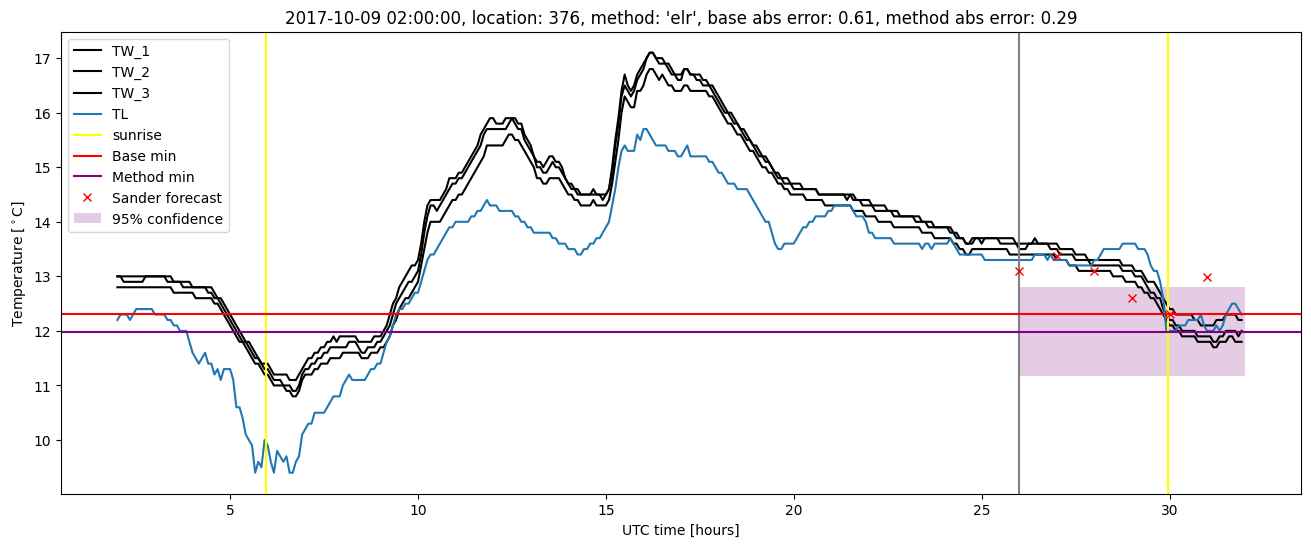
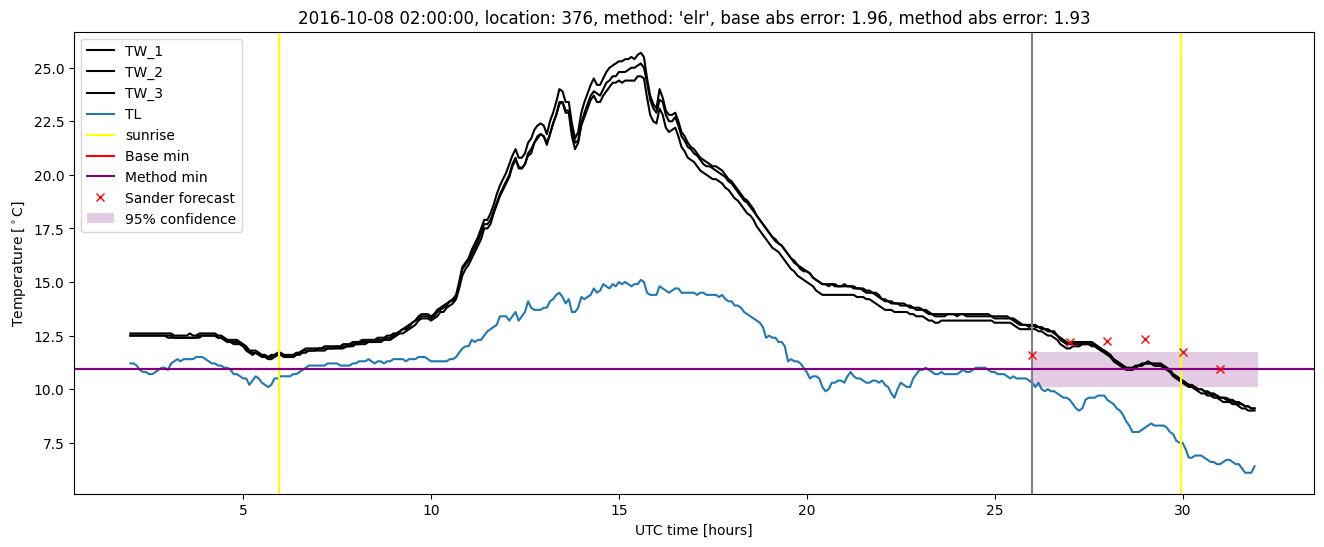
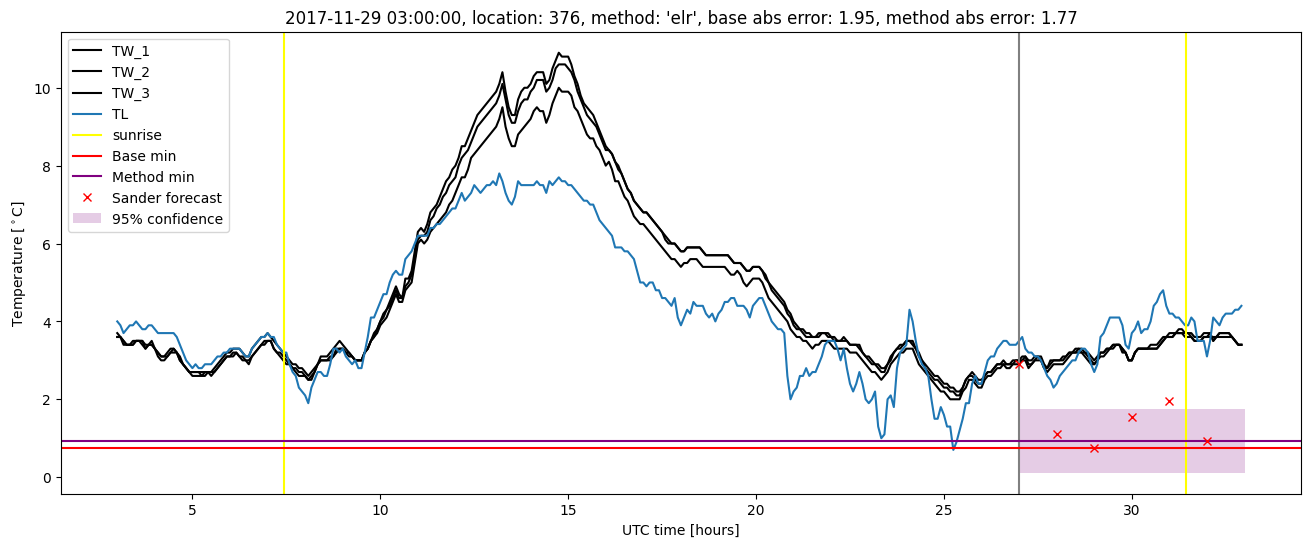
Extended logistic regression plots