GMS location: 375
Random forest results
| names |
period |
power |
significance |
meanSquareError |
absError |
maxError |
CRPS |
IGN |
| baseline |
winter 2016 |
1.000 |
0.071 |
0.295 |
0.429 |
1.513 |
NaN |
NaN |
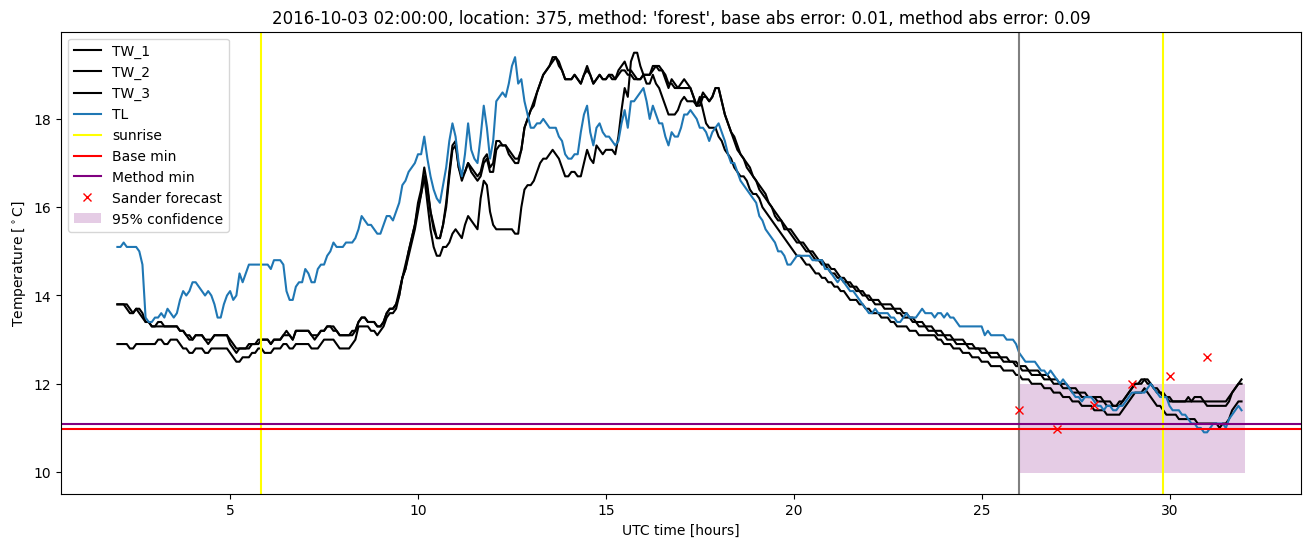
| forest |
winter 2016 |
1.000 |
0.143 |
0.245 |
0.394 |
1.532 |
0.447 |
3.807 |
| baseline |
winter 2017 |
0.985 |
0.000e+00 |
0.363 |
0.424 |
2.484 |
NaN |
NaN |
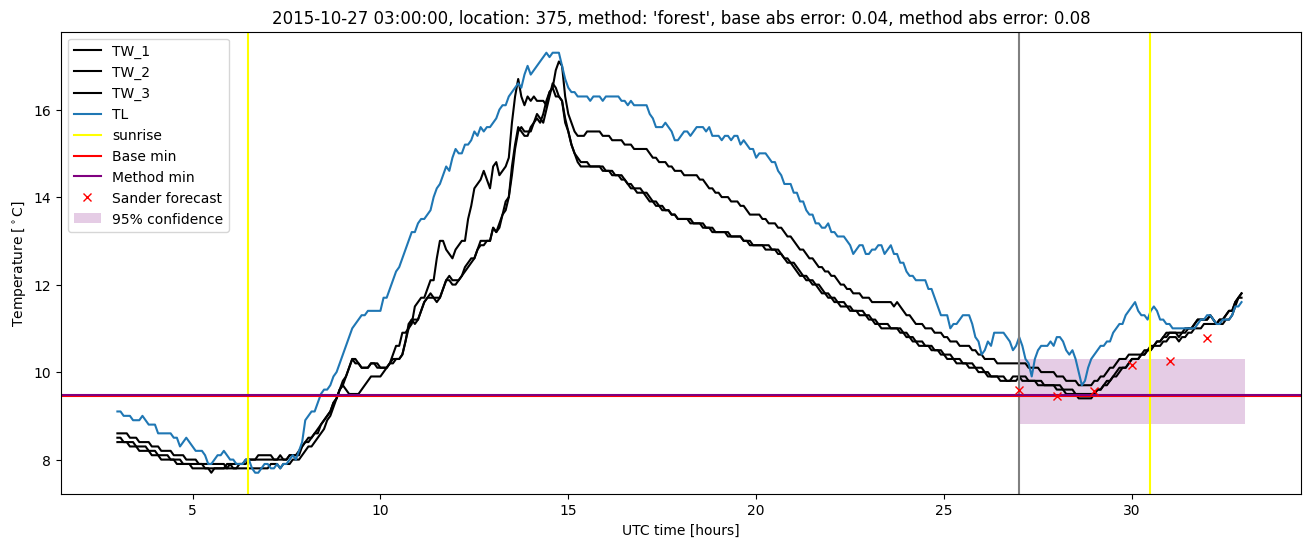
| forest |
winter 2017 |
0.977 |
0.000e+00 |
0.248 |
0.352 |
2.038 |
0.452 |
3.768 |
| baseline |
winter 2018 |
0.977 |
0.059 |
0.317 |
0.449 |
1.797 |
NaN |
NaN |
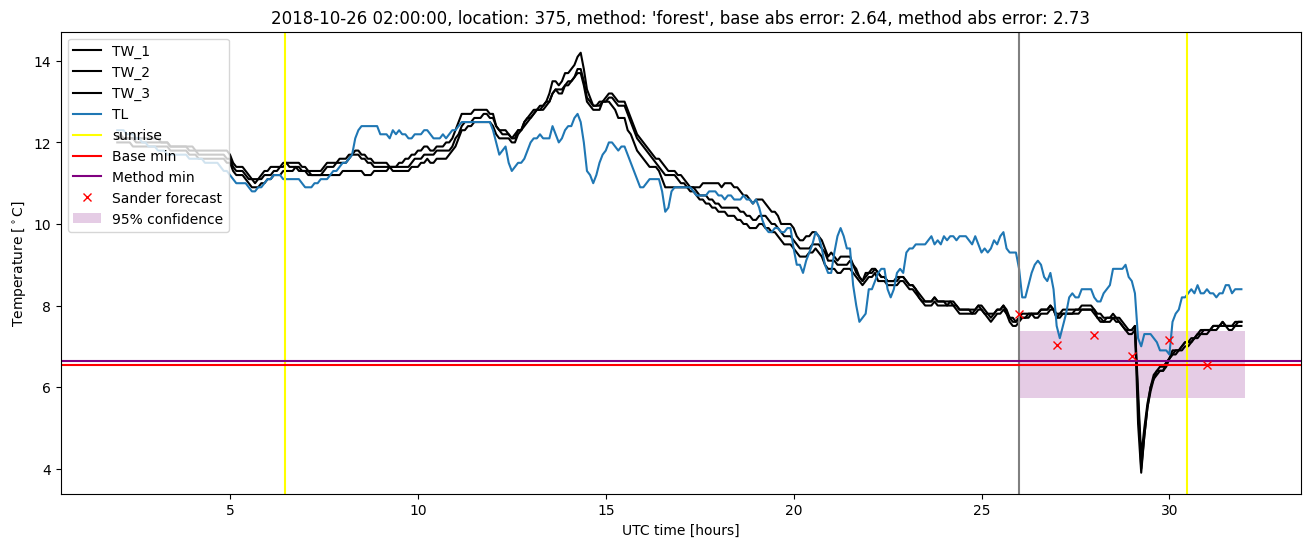
| forest |
winter 2018 |
0.985 |
0.118 |
0.227 |
0.365 |
1.698 |
0.455 |
3.476 |
| baseline |
winter 2019 |
0.993 |
0.000e+00 |
0.382 |
0.436 |
2.645 |
NaN |
NaN |
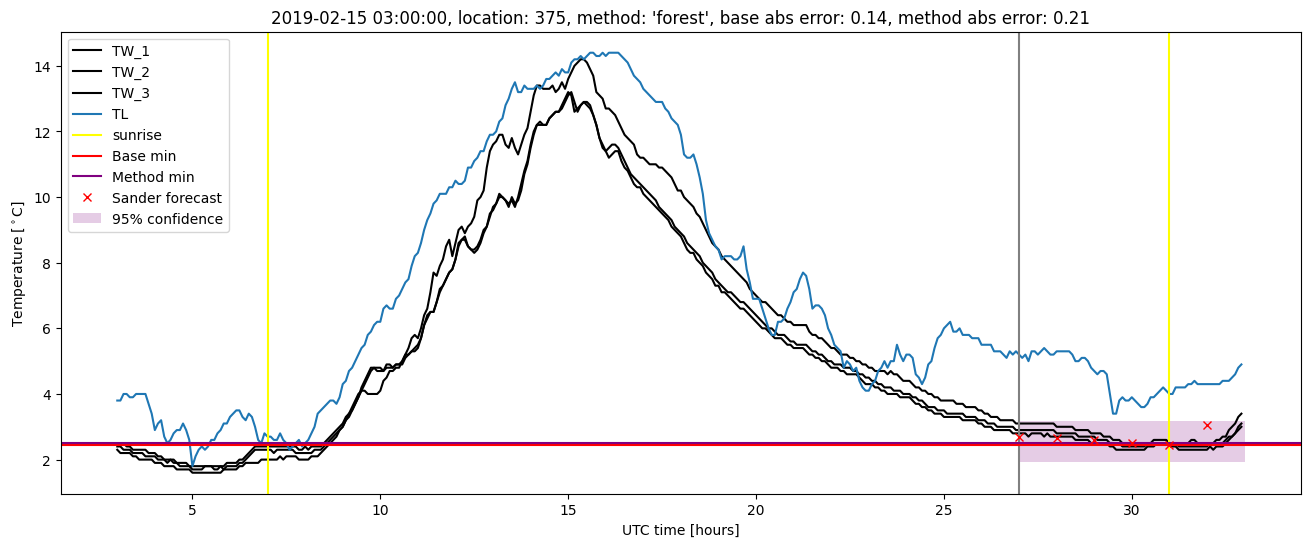
| forest |
winter 2019 |
0.993 |
0.182 |
0.273 |
0.373 |
2.734 |
0.459 |
3.672 |
| baseline |
all |
0.990 |
0.031 |
0.337 |
0.434 |
2.645 |
NaN |
NaN |
| forest |
all |
0.990 |
0.094 |
0.248 |
0.372 |
2.734 |
0.453 |
3.690 |
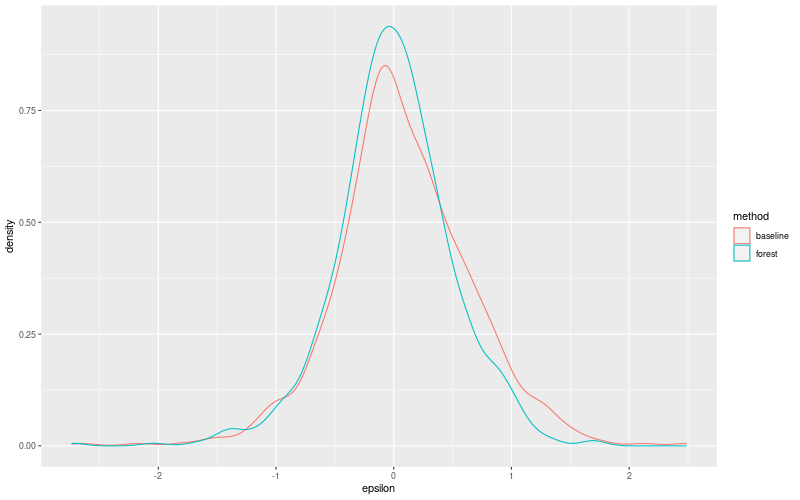
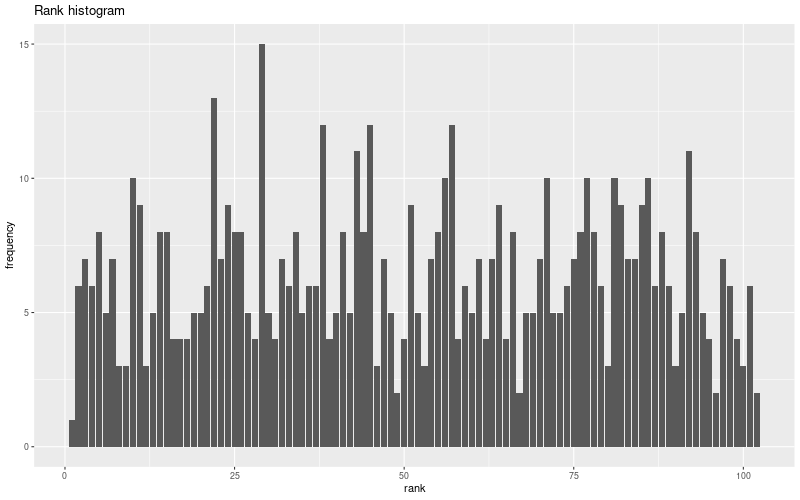
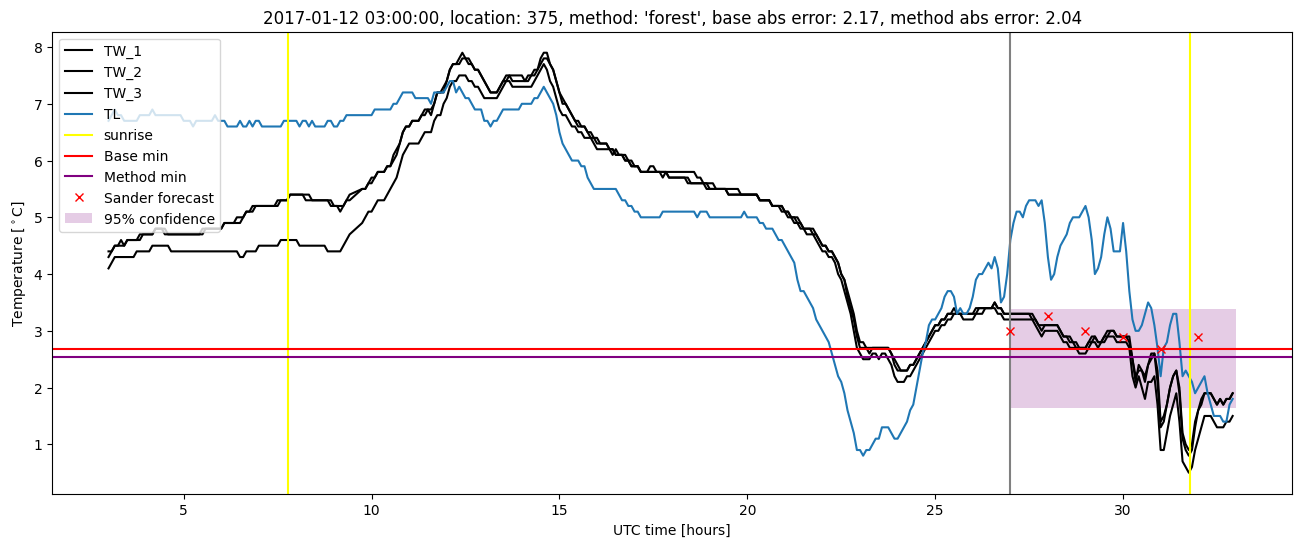
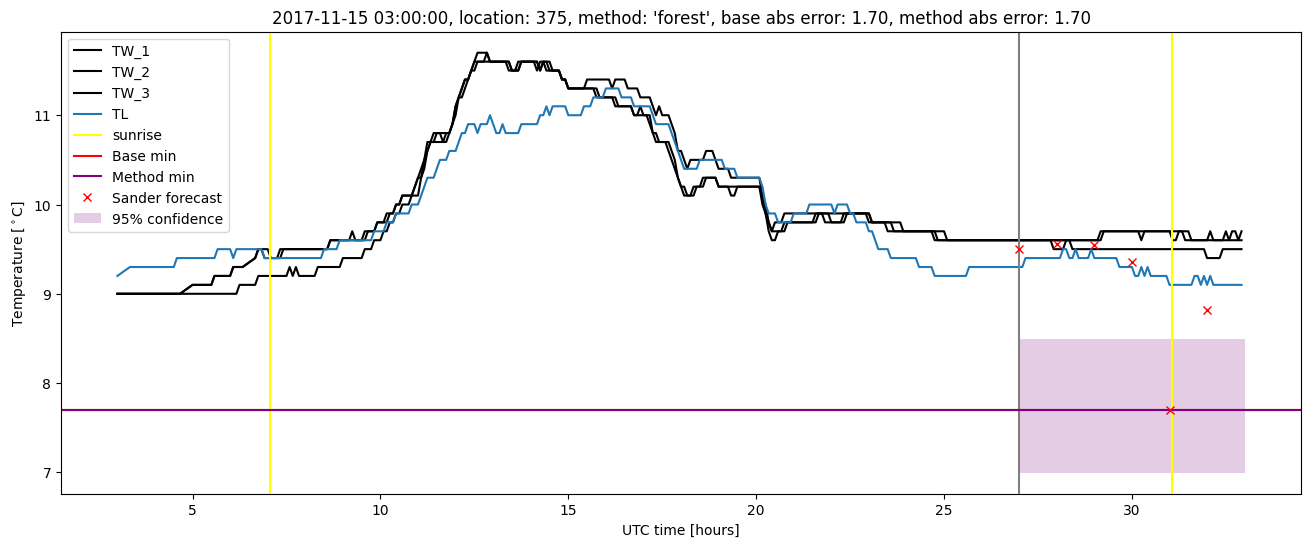
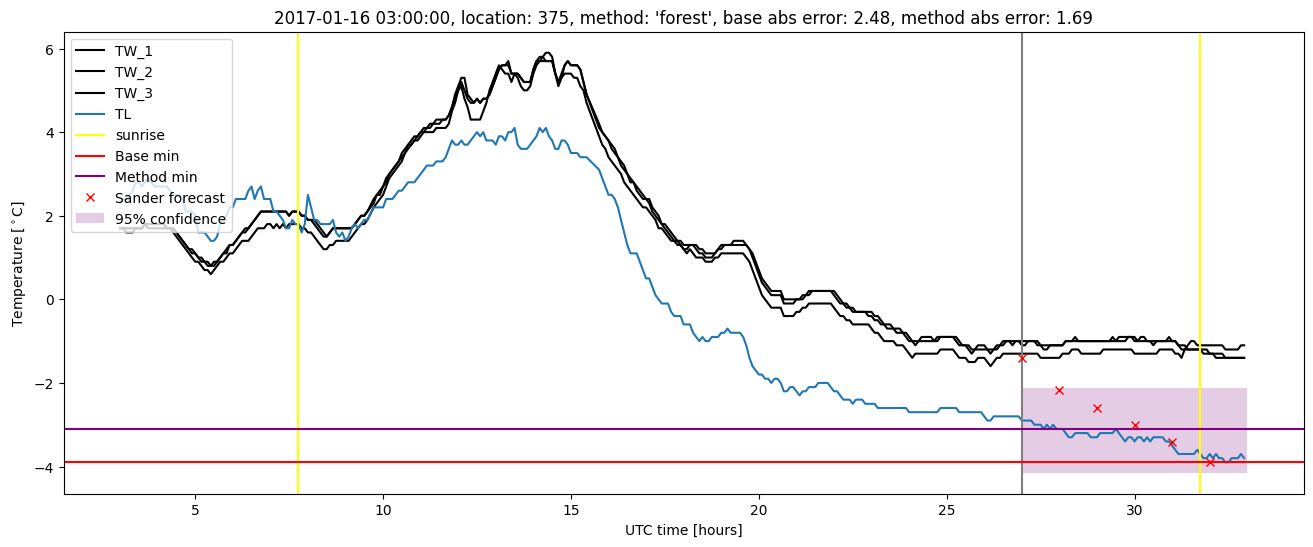
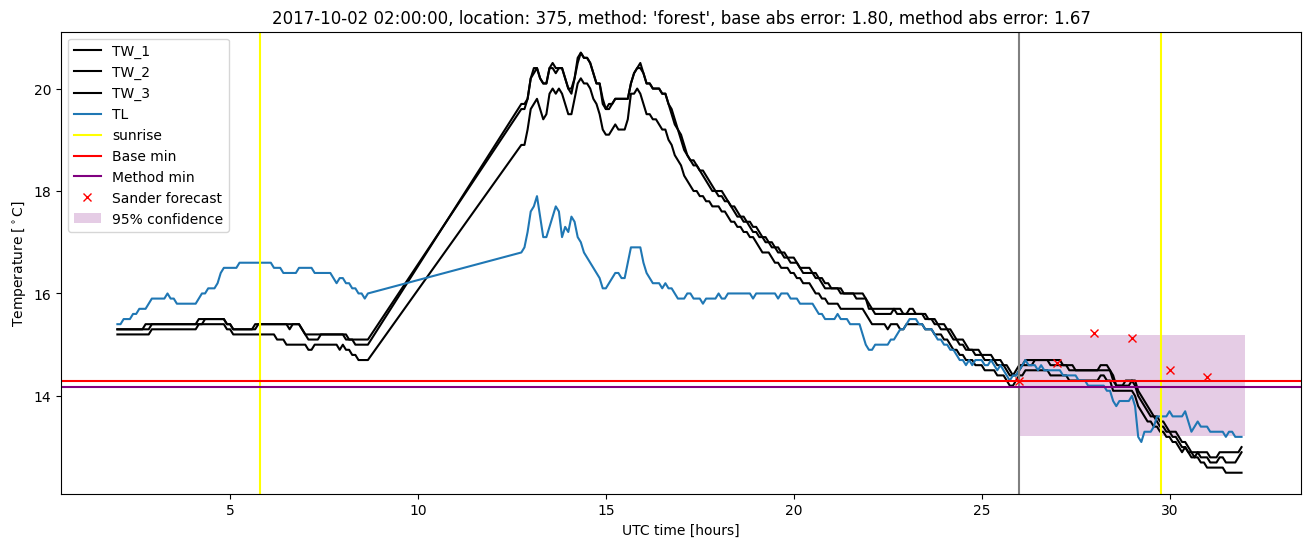
Random forest plots
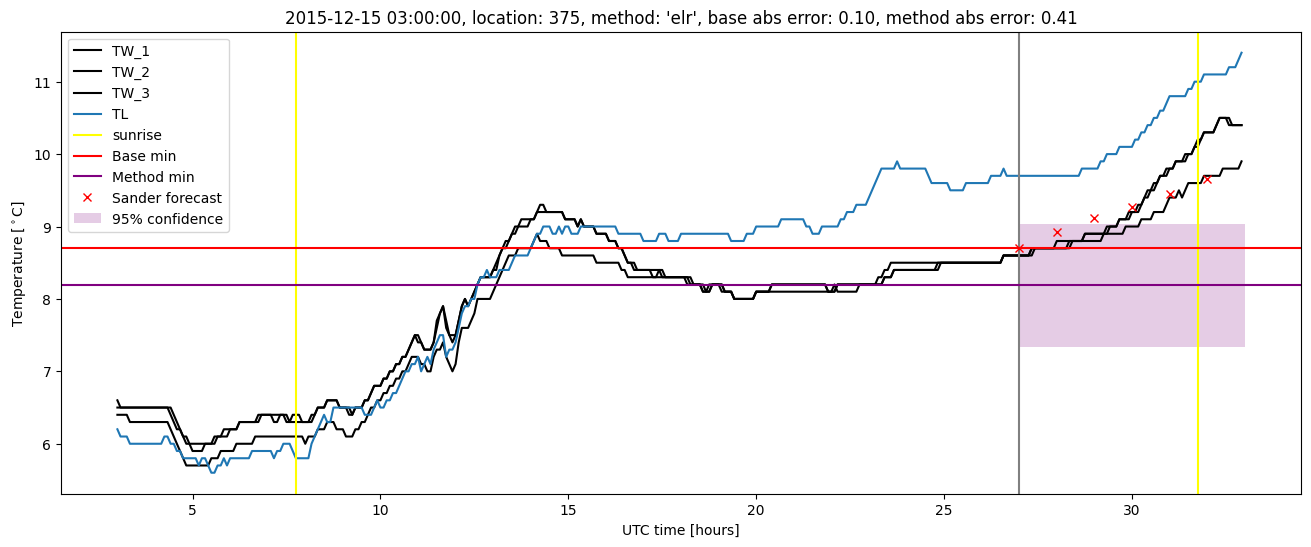
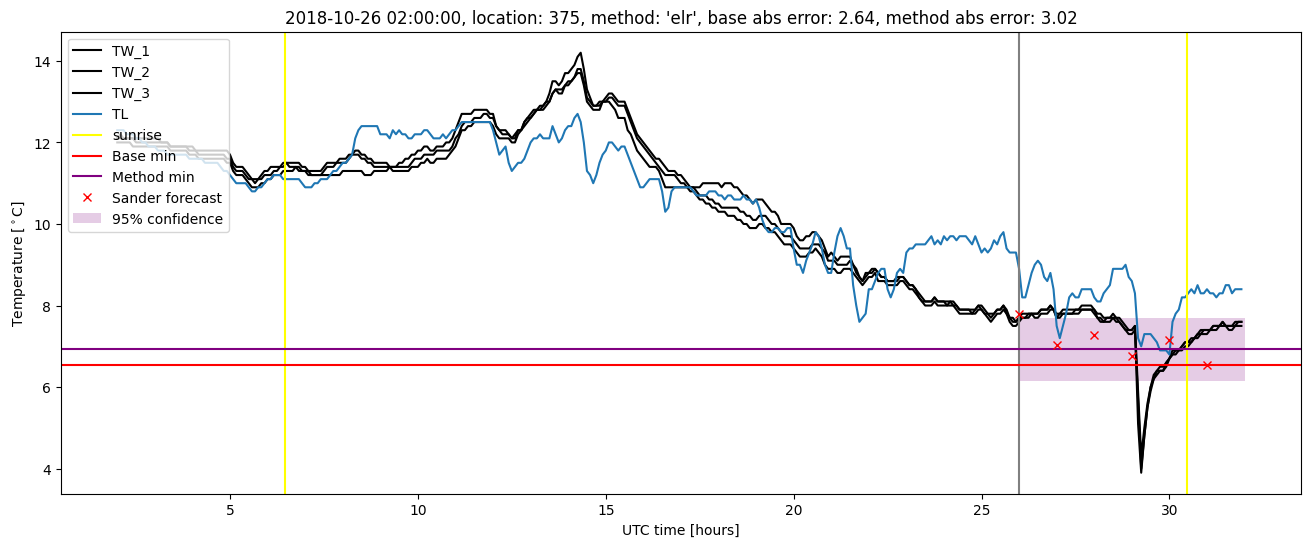
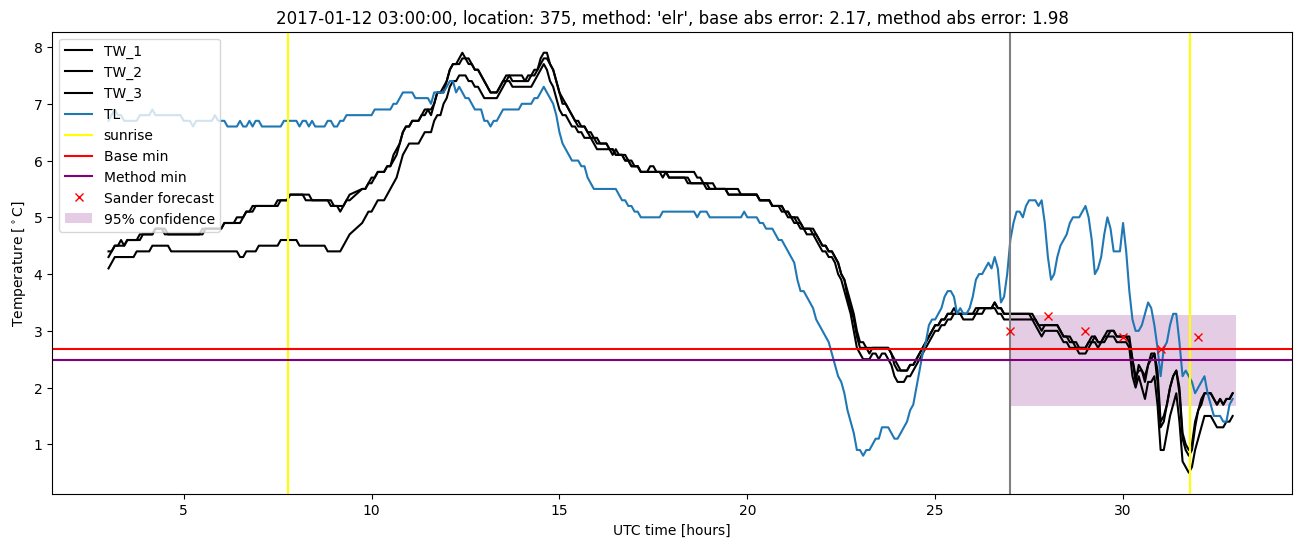
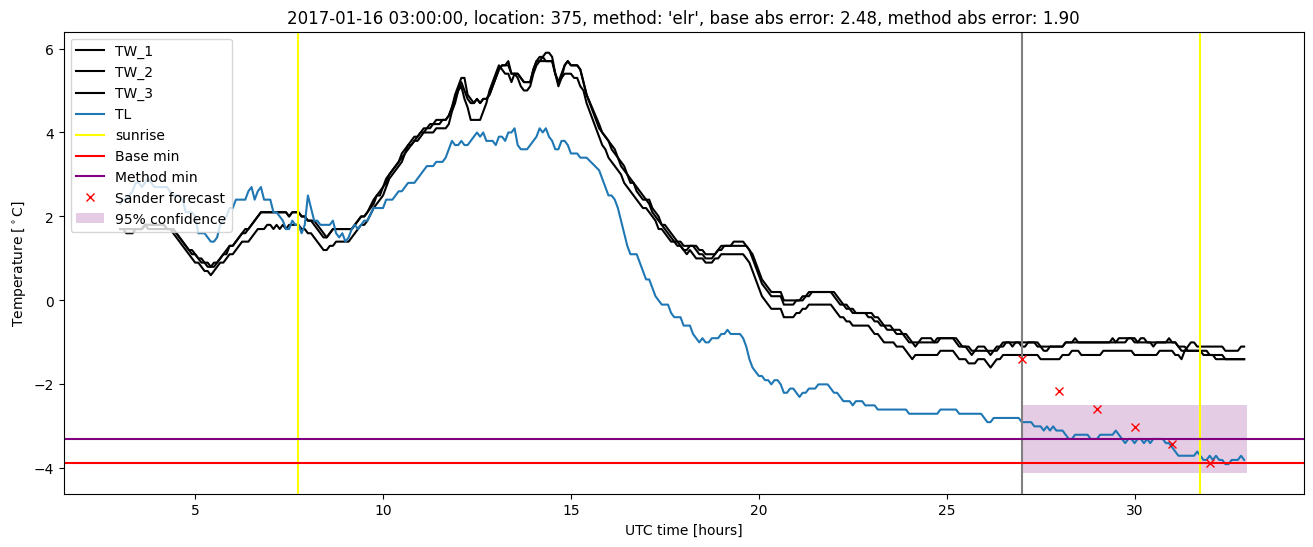
Extended logistic regression results
| names |
period |
power |
significance |
meanSquareError |
absError |
maxError |
CRPS |
IGN |
| baseline |
winter 2016 |
1.000 |
0.071 |
0.295 |
0.429 |
1.513 |
NaN |
NaN |
| elr |
winter 2016 |
1.000 |
0.214 |
0.276 |
0.419 |
1.450 |
0.492 |
3.955 |
| baseline |
winter 2017 |
0.985 |
0.000e+00 |
0.363 |
0.424 |
2.484 |
NaN |
NaN |
| elr |
winter 2017 |
0.977 |
0.000e+00 |
0.282 |
0.396 |
1.980 |
0.522 |
5.514 |
| baseline |
winter 2018 |
0.977 |
0.059 |
0.317 |
0.449 |
1.797 |
NaN |
NaN |
| elr |
winter 2018 |
0.985 |
0.059 |
0.248 |
0.383 |
1.779 |
0.511 |
4.291 |
| baseline |
winter 2019 |
0.993 |
0.000e+00 |
0.382 |
0.436 |
2.645 |
NaN |
NaN |
| elr |
winter 2019 |
0.993 |
0.091 |
0.328 |
0.424 |
3.022 |
0.536 |
6.409 |
| baseline |
all |
0.990 |
0.031 |
0.337 |
0.434 |
2.645 |
NaN |
NaN |
| elr |
all |
0.990 |
0.078 |
0.283 |
0.406 |
3.022 |
0.514 |
4.975 |
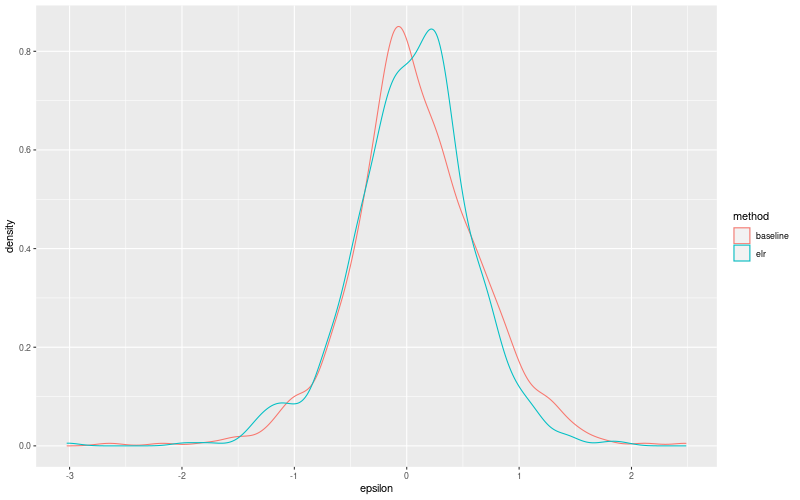
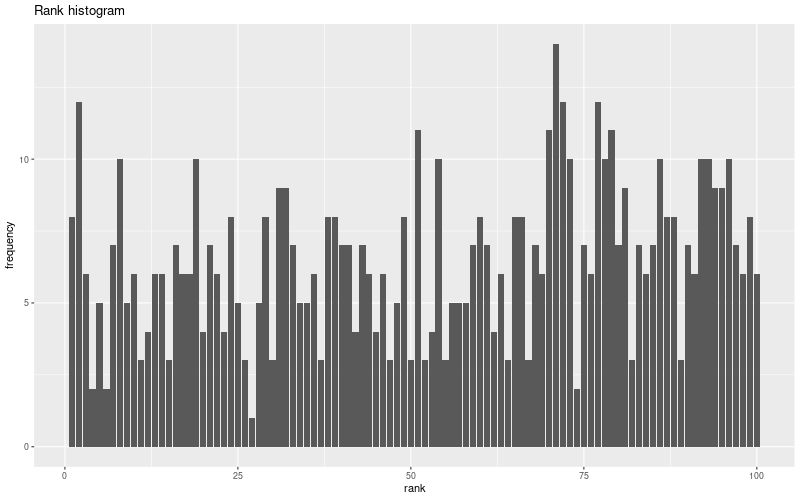
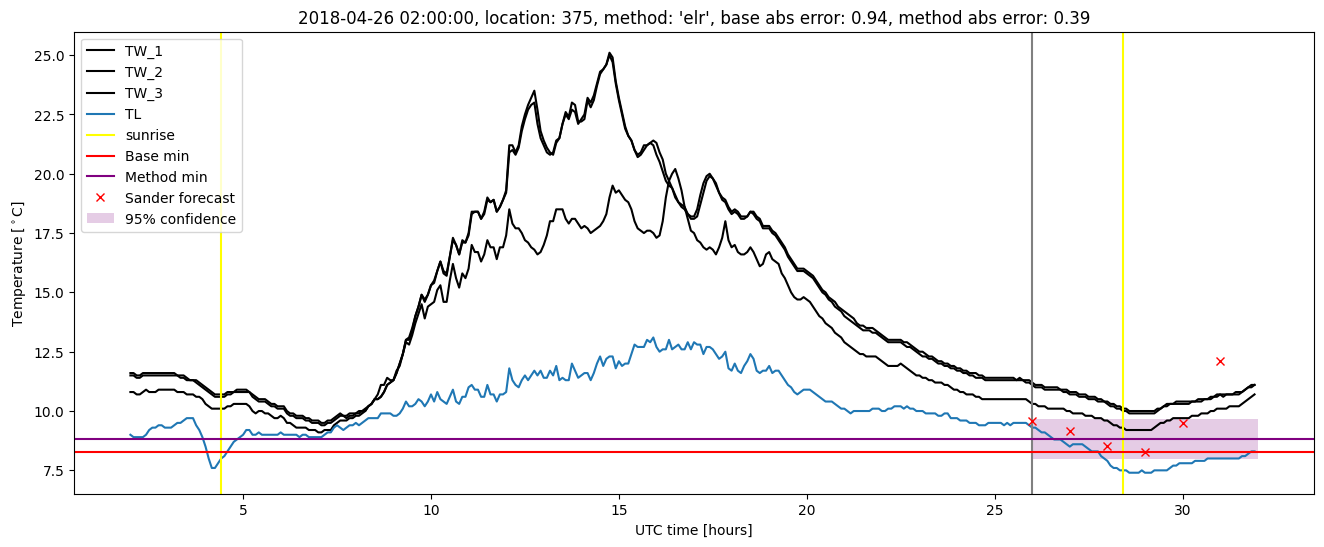
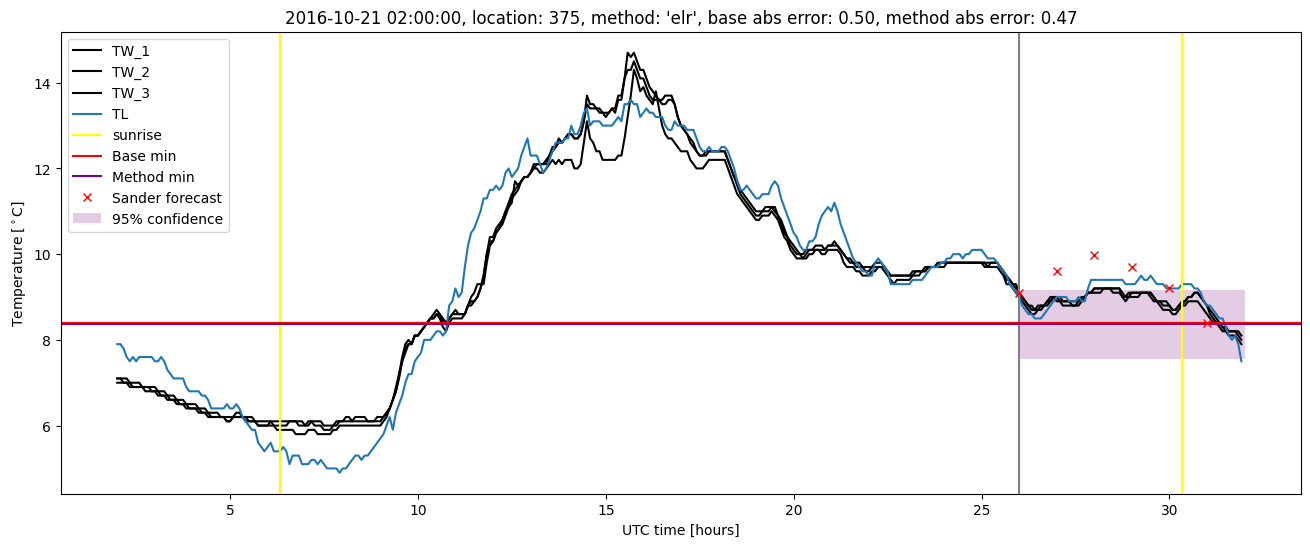
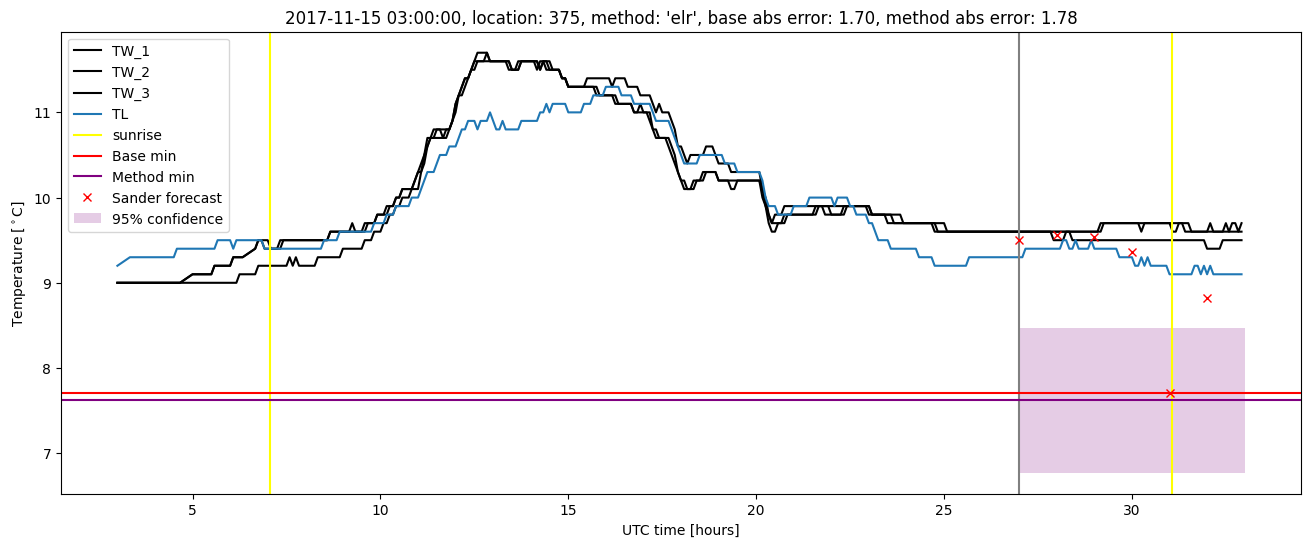
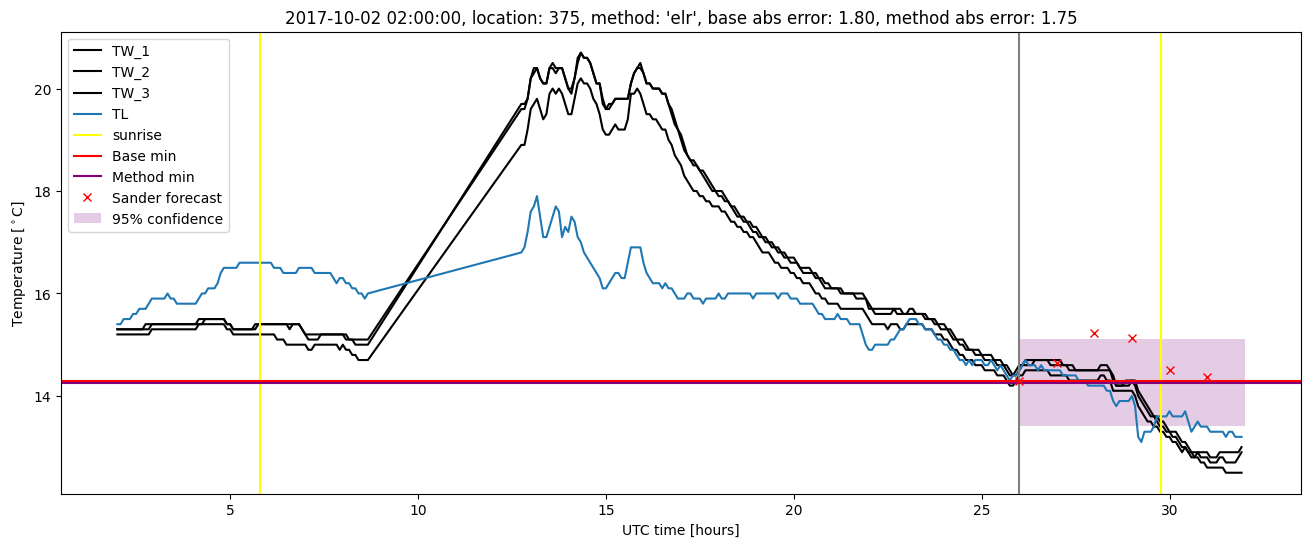
Extended logistic regression plots